Printed version ISSN 0001-3765 / Online version ISSN 1678-2690 www.scielo.br/aabc
Regional movements of the tiger shark, Galeocerdo cuvier, off northeastern Brazil: inferences regarding shark attack hazard
FÁBIO H.V. HAZIN1, ANDRÉ S. AFONSO1,2, PEDRO C. DE CASTILHO1, LUCIANA C. FERREIRA1 and BRUNO C.L.M. ROCHA1
1Departamento de Pesca e Aquicultura, Universidade Federal Rural de Pernambuco, Av. Dom Manoel de Medeiros, s/n, 52171-030 Recife, PE, Brasil
2
Faculdade de Ciências e Tecnologia, Universidade do Algarve, Campus de Gambelas, 8005-139 Faro, Portugal
Manuscript received on November 7, 2011; accepted for publication on October 5, 2012
ABSTRACT
An abnormally high shark attack rate verified off Recife could be related to migratory behavior of tiger
sharks. This situation started after the construction of the Suape port to the south of Recife. A previous study suggested that attacking sharks could be following northward currents and that they were being attracted shoreward by approaching vessels. In this scenario, such northward movement pattern could imply a higher probability of sharks accessing the littoral area of Recife after leaving Suape. Pop-up satellite archival tags
were deployed on five tiger sharks caught off Recife to assess their movement patterns off northeastern
Brazil. All tags transmitted from northward latitudes after 7-74 days of freedom. The shorter, soak distance between deployment and pop-up locations ranged between 33-209 km and implied minimum average speeds of 0.02-0.98 km.h-1. Both pop-up locations and depth data suggest that tiger shark movements were conducted mostly over the continental shelf. The smaller sharks moved to deeper waters within 24 hours
after releasing, but they assumed a shallower (< 50 m) vertical distribution for most of the monitoring period. While presenting the first data on tiger shark movements in the South Atlantic, this study also adds new information for the reasoning of the high shark attack rate verified in this region.
Key words: migration, Recife, satellite telemetry, shark attack, Suape.
Correspondence to: André Sucena Afonso E-mail: [email protected]
INTRODUCTION
Understanding the factors that elicit repeated shark attack events on humans in a local scale is essential in every sort of aspects. Since 1992, the metropolitan region of Recife, Brazil, exhibits one the highest shark attack rates per unit of area in the world, accounting for 53 attacks which resulted in 20 fatalities. Relative abundances assessed off Recife (Fischer et al. 2009), together with forensic
analysis (Gadig and Sazima 2003, Hazin et al. 2008) indicated the tiger shark, Galeocerdo cuvier, and the bull shark, Carcharhinus leucas, to be responsible for most of the attacks. Both species are considered potentially aggressive and have been frequently implicated in attacks on humans worldwide (International Shark Attack File, http:// www.flmnh.ufl.edu/fish/Sharks/ISAF/ISAF.htm. Accessed January 26, 2011).
km to the south of Recife, was the main factor responsible for the attack outbreak due not only to strong environmental degradation, resulting from construction activities, but also to increased attraction of sharks into this area in association with
higher maritime traffic. Sharks are known to follow
ships (Baldridge 1974, Schultz 1975) and to visit port areas and harbors (Coppleson 1958, McCord and Lamberth 2009, Meyer et al. 2009). Attraction of sharks by low-frequency sounds (Myrberg 2001) emitted by transiting vessels (Averson and Vendittis 2000) could partially explain such behavior, as well as the common habit of ship crews to throw garbage overboard. Thus, it is likely that the Suape port may have favored the approximation of sharks to these shores. Hazin et al. (2008) suggested that potentially aggressive sharks occurring off Recife could be moving downstream following northward coastal currents, which would lead them from the coast of Suape directly to the beaches of Recife where most attacks occurred. This would be most applicable in relation to tiger sharks, which have wide home ranges (Meyer et al. 2009) and have been reported to perform long-distance movements in a short amount of time (Heithaus et al. 2007, Kohler et al. 1998). If tiger sharks off northeastern Brazil are moving northward then, under the assumption that sharks are being attracted shoreward towards Suape by incoming vessels, one might predict that they would subsequently visit the littoral area of Recife. This note investigates the regional movements of tiger sharks caught off Recife and addresses the implications of such movements regarding local attack hazard.
MATERIALS AND METHODS
Recife is located in the northeastern Brazilian coast (8°03’S, 34°53’W; Fig. 1), about 20 km to the north of the Suape port. The Suape port was built in a large, mangrove-bordered estuarine system which used to be relatively pristine until construction
activities inflicted intense habitat degradation,
including the partial barring of two of the four
rivers previously discharging in this system. In the metropolitan region of Recife, the area where most of the attacks occurred corresponds to a 20 km stretch of densely populated beaches, which includes the Barra de Jangadas estuary. The continental margin of northeastern Brazil consists of a narrow, 63 km width shelf (Souza 2007) bordered by one of the longest, consistently steep (4 to 20°) slopes in the world (Fainstein and Milliman 1979). In this region, coastal currents assume a northward direction almost all year-round (Stramma 1991, Stramma et al. 1995, Bittencourt et al. 2005).
Pop-up satellite archival (PSAT) tags (model mk10; Wildlife Computers, Washington) were deployed on 5 tiger sharks (T1-T5; Table I) caught off Recife between 2008 and 2010 during the winter season (June-August), since winter presented higher shark attack rates (Hazin et al. 2008). All sharks were caught within 2.0 km from shore between 8-12 m isobaths, using a bottom longline equipped with 10 m length branch lines and 18/0, 0% offset circle hooks, except for T3 which was caught 17 km from shore at about 30 m depth. All sharks were carefully brought onboard, eye-covered, and restrained on deck (T1 and T2) or in a
wooden tank filled with sea water (T3, T4 and T5),
which was readily assembled after the shark was
first sighted. Sharks were then quickly transported
offshore in order to remove them away from the area of risk, and released at isobaths between 20-40 m, depending on oceanographic conditions and the health status of the shark. Before releasing, sharks were measured, sexed, and tagged with both a conventional, stainless steel, dart tag, and a
PSAT-tag. The conventional tag was fitted to the dorsal musculature just below the first dorsal fin, while
the PSAT-tag was attached to the proximal, anterior
region of the first dorsal fin by passing a coated, 2.0 mm polyamide monofilament through a hole
pierced with a 3.0 mm gauge needle and tightly
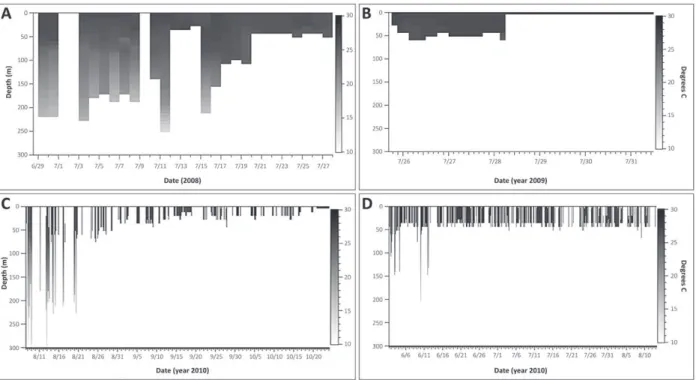
Figure 1 - deployment and pop-up location of Pop-up Satellite Archival Tags (PSAT) fitted on five tiger sharks caught off Recife, Brazil. On the map, locations are represented by: Cross = T1, T2, T4, and T5 tag deployments; plus sign = T3 tag deployment; solid square = T1 tag pop-up; empty circle = T2 tag first transmission; solid circle = T2 tag pop-up location estimate; solid pentagon = T3 tag pop-up; hash mark = T5 tag first transmission. The darkness gradient in the
its anterior region while being towed by the shark. Every procedure carried out with sharks was conducted in accordance to the recommendations at the Regiment of the Commission of Ethics on the Usage of Animals from the Universidade Federal Rural de Pernambuco. This study was ethically approved by the license number 041/2009 (protocol number 23082.009679/2009 D18). All tiger sharks were juveniles, measuring 128-193 cm TL, and were released in good health, generally swimming away from the boat immediately after being returned to the water except for T4, which had to be assisted during approximately 15 min before demonstrating enough strength for being released.
PSAT-tags were programmed to release between 30-99 days after deployment (Table I). Water depth and temperature were recorded every second and further summarized into bins of between 2-24 hours for transmitting during satellite uplinks, which occurs once the tag pops off the shark and
floats to the surface. depth and temperature data
were binned in 14 strata that were set before deployment. The time spent at each stratum was continuously monitored. Disregarding minor variations, depth strata were generally arranged
by classes < 0, 0-5, 5-10, 10-20, 20-40, 40-60,
60-80, 80-100, 100-125, 125-150, 150-200, 200-250, 250-300, and > 300 m. Temperature strata were
arranged by classes < 12, 12-14, 14-16, 16-18,
18-20, 20-22, 22-24, 24-25, 25-26, 26-27, 27-28, 28-29, 29-30, and > 30 °C. Heterogeneous strata sizes required temporal data to be standardized by either depth- or temperature-unit before assessing tiger shark environmental preferences. Data analysis was performed with R 2.12.2 (R development core team
2011) and IGOR Pro 6.1®. In one circumstance, the
pop-up position was derived from surface current direction and speed which were estimated based on
tag drift during the first 24 hours of satellite-linked
transmissions using only messages with location
quality LC ≥ 1 (Argos-based geolocation error < 1 km for LQ ≥ 1) (hays et al. 2001).
Luminosity-based geolocation estimates, which provide a proxy of the horizontal movements performed by the tagged individual during the tracking period, were not considered because position estimates errors at tropical latitudes are yet too great for assessing movements conducted in small spatial scales and thus are most effective for studies conducted in the oceanic realm (Musyl et al. 2011).
TABLE I
Summary of PAT-tag deployments on tiger sharks off Recife, Brazil between 2008-2010. Tagging location
was about [8.1 S; 34.8 W] for all sharks except for T3 [8.25 S; 34.77 W]. Note that T4 tag uplinked to the satellite insufficient times and so pop-up location and tracking data are not available (n.a.).
Tag Sex TL
(cm) Tag date Prog.
span
Track
span Pop-up location
Linear distance
(km)
Km from shore
Max. depth (m)
Min. Avg. speed (km.h-1)
ΔTemp.
(ºC)
Hours. Bin-1
T1 M 130 28-Jun-08 30 d 30 d 6.32S;34.79W 209 23 248 0.29 13.6 –
27.0 24
T2 M 193 25-Jul-09 75 d 4 d 7.34S;34.65W* 94* 16 56 0.98 25.0 –
27.6 3
T3 F 128 1-Jun-10 73 d 74 d 7.97S;34.67W 33 15 200 0.01 15.0 –
29.0 3
T4 F 154 1-Aug-10 50 d 42 d n.a. n.a. n.a. n.a. n.a. n.a. 2
T5 M 150 7-Aug-10 99 d 72 d 7.08S;34.85W** 125** inland** 304 n.a. 13.0 –
28.0 4
*estimated from tag drift;
RESULTS
Following pop-up, all satellite tags transmitted to the north of Recife at linear distances varying between 33 and 209 km from the deployment location (Fig. 1), except for T4 tag. Although the T4 tag transmitted a few messages by the programmed pop-up date, the amount of
consecutive transmissions were insufficient for
generating a geolocation estimate, what could be ascribed to a technical failure such as the antennae being damaged during the deployment. Due to some premature releases, tracking duration varied between 4 and 74 days (Table I). T2 tag transmitted 7 days after deployment, about 152 km to the north of Recife (Fig. 1); however, data analysis showed that the tag had been drifting at the surface for about 3 days before transmitting to the satellite (Fig. 2B). Estimated pop-up position derived from surface current direction (about 10°
NW) and speed (0.25 m.s-1) corresponded to 94
km northward from the tagging location (7.34°
S; 34.65° W). The first transmission of 3 out of
the 4 successfully deployed tags occurred at 15-23 km from the coastline. T5 tag also prematurely released but it was washed up to the beach before transmitting (3 days after releasing) and so the estimate of pop-up position was impossible to assess. Assuming the shorter, soak course between deployment and pop-up locations, calculated minimum average speeds were low for both T1 and T3 (0.29 and 0.02 km.h-1, respectively), but
higher for T2 (mean speed of 0.98 km.h-1, equaling
to 0.13 body length per second).
The vertical depth-and-temperature profiles
were relatively consistent among all tracks. T1, T3 and T5 showed a clear tendency for occupying
deeper water layers during the first ~13 days of
tracking, frequently performing dives between 150-300 m deep (Fig. 2). T5 performed the deepest
Figure 2 - depth-and-temperature profiles of the vertical movements performed by tiger shark (A) T1, (B) T2, (C) T3, and (d)
T5 off Northeastern Brazil. Data illustrates the depth range and associated water temperature per each time-unit successfully
sampled and blanks correspond to data which was not successfully up-linked to ARGOS satellites. Note that both tags T2 and T5
dive observed (= 304 m). The thermal gradients of
the dives of these three sharks went up to 13.4 °C, indicating deep penetration into the thermocline
layer. After that first period, the sharks assumed a more superficial behavior for the remainder of
the tracking period, generally never exceeding the 50 m isobaths, except for T1 which repeated the deep-diving pattern soon after for a couple of days (Fig. 2A). Despite being tracked for only 4 days, T2 movements were conducted exclusively
in shallow water (< 56 m) in an environment with
very little thermal variation (Fig. 2B), resulting in a
quite homogeneous depth-and-temperature profile which was similar to the profiles of the other three
sharks when their movements were restricted to
more superficial waters. All the individuals moved
to the surface during just about every temporal unit of the respective track.
Overall, all the individuals showed a strong
preference for shallower waters, spending on
average 52.5% (Sd = 6.5%) of the tracking time at depths < 10 m and 88.0% (Sd = 7.5%) at depths <
40 m (Fig. 3A). T5 spent the least amount of time
(44.5%) at depths < 10 m, while T2 spent most of
the time (59.7%) at those same depths. T3 spent the least amount of time (1.6%) at depths > 40 m. Standardization of depth strata further reduced the time per unit of depth spent by all sharks at deeper waters and it increased the time per unit of depth
spent at isobaths < 10 m (average = 81.6%, Sd =
7.8%). Generally, all sharks exhibited a decreasing preference for water layers deeper than 10 m, except for T3, which spent twice as much time per unit of depth at depths between 20-40 m than between 10-20 m (Fig. 3B).
All sharks spent most of the tracking time
(average = 94.6%, Sd = 6.8%) between 24-28°C. T1, T2 and T3 spent considerable time (average = 84.3%, Sd = 9.9%) at warmer waters, between
26-28°C, while T5 spent 74.8% of the tracking time between 24-26°C and only 20.0% between 26-28°C (Fig. 4).
DISCUSSION
The present results sustain the hypothesis that tiger sharks occurring off Recife perform regional northward movements, following the direction of coastal currents. Long-distance movements of tiger sharks in both coastal and oceanic realms have been evidenced in previous studies (Heithaus et al. 2007, Kohler et al. 1998), and seasonal migrations
were suggested to occur in some regions (Heithaus 2001, Wirsing et al. 2006). In Hawaii, tiger sharks were noted to move throughout wide-ranging, coastal habitats (15-109 km) which they patrol during a period of time before leaving to a different area (Meyer et al. 2009). Unfortunately, the poor quality of luminosity-based geolocation in tropical waters, most especially regarding latitude estimates (Musyl et al. 2001), did not allow the assessment of directional shifts of latitudinal displacement which could indicate patrolling behavior. Nevertheless, the close proximity of T3 tag to the original deployment location after a long period of time (74 days) suggests that such behavior may have occurred. It contrasted with T2 horizontal movement which produced a considerable displacement in little time, thus indicating a relatively well oriented course northwardly after being tagged off Recife. In any case, if patrolling behavior occurs in tiger sharks off northeastern Brazil, the overall net displacement appears to be directional, aiming to the north, since no tag transmitted to the south of Recife.
Tagged individuals were all juveniles
measuring < 200 cm TL because the majority of the
tiger sharks caught off Recife belong to that size-class, exceeding the number of larger specimens
by 10-fold. They were by far the most prevailing component amongst the catch composition of potentially aggressive species (Hazin et al. 2000). In spite of considerably low relative abundances, juvenile tiger sharks have been noted to occur off Recife in temporal clusters, with two or more individuals being caught in the same week or
even in the same fishing set (F.h.v. hazin et al.,
unpublished data). Even though the role of these smaller individuals in the shark attack problematic is not hitherto clear, it seems plausible that they may have been responsible for some of the incidents.
All tags popped-up over the continental shelf of northward regions, suggesting that juvenile tiger sharks preferentially move in the neritic zone off northeastern Brazil. This was sustained
by the depth-temperature profiles registered by
electronic tags, which evidenced a clear preference
for superficial waters. Indeed, the observed vertical distribution may reflect a depth preference as much
as a bathymetric constraint. The continental shelf off northeastern Brazil is relatively monotonous, slanting gently from the shoreline until a depth of about 50-60 m (Manso et al. 2003), where the slope abruptly starts. General maximum dive depths of 40-60 m observed in the greatest extent of all tracks suggest that juvenile tiger sharks in this region move mostly over the continental shelf, at least during the winter season when they appear to be more abundant off Recife (F.H.V. Hazin et al., unpublished data). The tagged individuals stayed most of the time at the mixed layer and so they were mainly exposed to a thermal niche of
24-28°C throughout the tracking period, as verified by
temperature data. The lower temperature associated with T5 movements should be attributed not only to deep-diving behavior but also to seasonal variation in the water temperature, which usually tends to be minimum in August (Hazin et al. 2000). Interestingly, deeper dives into depths > 100 m were performed by all the three smaller individuals
almost exclusively within the first ~13 days after Figure 4 - Proportion of time spent by tiger sharks T1, T2,
tagging, with all sharks adopting a shallower vertical distribution after that period. The similarity of such pattern between different individuals suggests that it could be ascribed to post-release, stress-mediated behavior. It also suggests that tagged individuals seek refuge in offshore, deeper waters after being released. In fact, three of the sharks were clearly off the continental shelf within a 24 h period after being released. The duration of deep-diving pattern suggests that the behavior of caught-and-released juvenile tiger sharks could be altered during a couple of weeks after releasing, eventually implicating some behavioral biases during the beginning of telemetry studies. T2 was the only individual who did not exhibited such a propensity for escaping to deeper waters, which could be related to its larger size compared to the other specimens. The vertical distribution evidenced by these 4 tiger sharks is comparable with results obtained in Hawaii (Holland et al. 1999, 2001).
Observed minimum average speeds, measured
by considering the shorter, soak distance between deployment and pop-up locations, were greatly different. T2 was the largest shark and appeared to move faster. However, the small duration of its track probably reduced the amount of biases imposed by both longitudinal and vertical movements, which would tend to diminish average speeds in longer tracks. In accordance, T2 minimum average speed was roughly comparable to tiger shark speeds assessed in previous studies. In Hawaii, an average speed of 0.29 body length per second (BL.s-1) was measured for six acoustically tracked, mostly > 300 cm TL tiger sharks (Holland et al. 1999). Assuming 0.29 BL.s-1 as a validated speed, the expected
speed for T2 would be 0.57 m.s-1, which is within the same order of magnitude of the measured speed (0.98 km.h-1 = 0.27 m.s-1). Such compatibility suggests T2 to have moved in a relatively well oriented latitudinal course, as opposed to longitudinal and/or vertical displacements, since T2 would already be expected to swim slower
than > 300 cm TL individuals due to its smaller size. The pop-up latitudes of T1- and T3-tags were distinct, as well as the duration of their tracks. In spite of T3 having the longest track span (74 days), its location was the closest to the tagging site by the end of the tracking period, resulting in an unreasonable estimate of minimum average
speed. On the other hand, T1 exhibited the highest
latitudinal displacement by the end of its track (30 days), indicating that juvenile tiger sharks also utilize wide-ranging habitats off the continental shelf of northeastern Brazil. Despite the long distance achieved, the relatively low minimum average speed of T1 could be attributed to the more frequent longitudinal and vertical displacements when compared to the T2 shark. Tiger shark diel rhythmicity has been recorded in previous studies (Tricas et al. 1981), usually comprising predatory excursions to shallow habitats with high prey density to forage and subsequent returns to deeper waters (Heithaus et al. 2006, 2007, Lowe et al. 1996, 2006), although Meyer et al. (2009) found no evidence of rhythmic patterns of behavior
in a more recent study. Off the Brazilian coast
northward of Recife, such behavior would imply longitudinal movements which would necessarily reduce the rate of latitudinal displacement.
Suape, which is variable at week- and year-level.
Significant statistical correlations between periods of higher maritime traffic into Suape and shark attack
events off Recife have been previously evidenced (Hazin et al. 2008), which further supports this hypothesis. Based on the assumption that the port of Suape is attracting sharks shoreward, the pattern of tiger shark regional movements suggested by the
present study may possibly emerge as a significant
factor contributing for the shark attack outbreak
verified at Recife.
ACKNOWLEDGMENTS
The authors are thankful to Rafael Muniz, José Pacheco, Diogo Nunes, Lucas Flores, Renato Santiago, Sidney Silva, Juliana Viana, Wesley
Oliveira, Gabriel Crema, Camilo Rosa, Camila
Araújo, Anderson Silva, and the crew of R.V.
Sinuelo and R.v. Pedrinho for assisting with field
work. Precious guidance regarding data analysis was kindly supplied by B. Block, S. Jorgensen and M. Castleton, to whom we are deeply appreciated. The authors would like to acknowledge the State Government of Pernambuco and Petrobrás (Brazil) and Fundacão para a Ciência e Tecnologia (Portugal) for funding this research and providing a PhD grant to Afonso AS (MCTES/FCT/SFRH/ BD/37065/2007).
RESUMO
A elevada taxa de ataques de tubarão verificada em
Recife poderá estar relacionada com o comportamento
migratório do tubarão tigre. O início desta situação
coincidiu com a construção do porto de Suape localizado a Sul de Recife. Um estudo anterior sugeriu que algumas das espécies responsáveis pelos ataques poderiam estar seguindo as correntes costeiras para Norte e que
o trânsito marítimo estaria atraindo as mesmas para
junto da costa. Neste cenário, a movimentação dos tubarões para Norte implicaria uma maior probabilidade de estes acessarem o litoral de Recife após sairem de Suape. Para averiguar os padrões de movimentação do
tubarão tigre no nordeste brasileiro, foram aplicados transmissores via satélite a 5 espécimes capturados ao largo de Recife. Todas as marcas transmitiram de latitudes a Norte após 7-74 dias em liberdade. A menor
distância entre os locais de captura e de primeira
transmissão foi de 33-209 km, correspondendo a velocidades médias mínimas entre 0.02-0.98 km.h-1. As localizações da primeira transmissão e os dados de profundidade sugerem que os movimentos dos animais foram realizados principalmente sobre a plataforma
continental. Os tubarões menores deslocaram-se para
águas profundas em até 24 horas após a liberação, mas
assumiram uma distribuição mais superficial (< 50 m)
durante a maior parte do tempo. Este estudo apresenta os primeiros resultados das movimentações de tubarões
tigre no Atlântico Sul e adiciona novas informações para
a compreensão dos motivos que levaram à problemática
de ataques de tubarão verificada nesta região.
Palavras-chave: migração, Recife, telemetria via satélite, ataque de tubarão, Suape.
REFERENCES
AvERSON PT AND VENDITTIS DJ. 2000. Radiated noise characteristics of a modern cargo ship. J Acoust Soc Am 107: 118-129.
BALDRIDGRE HD. 1974. Shark attack: a program of data
reduction and analysis. Contrib Mote Mar Lab 1: 1-98. BITTENCOuRT AC, DOMINGuEz JM, MARTIN L AND SILVA IR.
2005. Longshore transport on the northeastern Brazilian coast and implications to the location of large scale accumulative and erosive zones: An overview. Mar Geol 219: 219-234.
COPPLESON VM. 1958. Shark attack. Sydney: Angus & Robertson Ltd., 269 p.
FAINSTEIN R AND MILLIMAN JD. 1979. Structure and origin of three continental-margin plateaus, northeastern Brazil. Am Assoc Petro Geos Bull 63: 218-238.
FISCHER AF, HAZIN FHV, CARvALhO F, VIANA DL, RÊGO MG
AND WOR C. 2009. Biological aspects of sharks caught off the Coast of Pernambuco, Northeast Brazil. Braz J Biol 69: 1173-1181.
GADIG OBF AND SAZIMA I. 2003. A non-fatal attack by the tiger shark, Galeocerdo cuvier, on the northeast coast of Brazil (Chondrichthyes, Carcharhinidae). Arq Ciênc Mar 36: 119-122.
HAYS GC, AKESSON S, GOdLEY BJ, LUSCHI P AND SANTIDRIAN
HAZIN FHV, BURGESS GH AND CARvALhO FC. 2008. A shark attack outbreak off Recife, Pernambuco, Brasil: 1992-2006. Bull Mar Sci 82: 199-212.
HAZIN FHV, WANDERLEY JÚNIOR JAM AND MATTOS SMC.
2000. distribuição e abundância relativa de tubarões no
litoral do Estado de Pernambuco, Brasil. Arq Cien Mar 33: 33-42.
HEITHAUS MR. 2001. The biology of tiger sharks, Galeocerdo cuvier, in Shark Bay, western Australia: sex ratio, size distribution, diet, and seasonal changes in catch rates. Envirn Biol Fish 61: 25-36.
HEITHAUS MR, HAMILTON IM, WIRSING AJ AND DILL LM.
2006. Validation of a randomization procedure to assess animal habitat preferences: microhabitat use of tiger sharks in a seagrass ecosystem. J Anim Ecol 75: 666-676. HEITHAUS MR, WIRSING AJ AND DILL LM. 2007. Long-term movements of tiger sharks satellite-tagged in Shark Bay, Western Australia. Mar Biol 151: 1455-1461.
HOLLANd KN, BUSH A, MEYER CG, KAJIURA S, WETHERBEE
BM AND LOWE CG. 2001. Five tags applied to a single species in a single location: The Tiger Shark experience. Reviews in Fish Biology and Fisheries. In: Sibert JR and Nielsen J (Eds), Electronic Tagging and Tracking in Marine Fisheries. Dordrecht: Kluwer Academic Publishers, p. 237-248.
HOLLANd KN, WETHERBEE BM, LOWE CG AND MEYER CG.
1999. Movements of tiger sharks (Galeocerdo cuvier) in coastal Hawaiian waters. Mar Biol 134: 665-673. KOhLER NE, CASEY JG AND TURNER PA. 1998. NMFS
Cooperative Shark Tagging Program, 1962–93: an atlas of shark tag and recapture data. Mar Fish Rev 60: 1-87.
LOWE GL, WETHERBEE BM, CROW GL AND TESTER AL.
1996. Ontogenetic dietary shifts and feeding behavior of
the tiger shark Galeocerdo cuvier, in Hawaiian waters. Envir Biol Fish 47: 203-211.
LOWE GL, WETHERBEE BM AND MEYER CG. 2006. Using
acoustic telemetry monitoring techniques to quantify
movement patterns and site fidelity of sharks and giant
trevally around French Frigate Shoals and Midway Atoll. Atoll Res Bull 543: 281-303.
MANSO VAV, CORRÊA-COuTINhO ICS AND GUERRA NC.
2003. Morfologia e sedimentologia da plataforma continental interna entre as praias Porto de Galinhas e Campos – litoral sul de Pernambuco. Pesq Geocien 30: 17-25.
MCCORd ME AND LAMBERTH SJ. 2009. Catching and tracking the world’s largest Zambezi (bull) shark Carcharhinus leucas in the Breede Estuary, South Africa: the first 43
hours. Afric J Mar Sci 31: 107-111.
MEYER CG, CLARK T, PAPASTAMATIOu YP, WHITNEY N AND
HOLLANd KN. 2009. Long term movement patterns of tiger sharks, Galeocerdo cuvier, in Hawaii. Mar Ecol Prog Ser 381: 223-235.
MUSYL MK, BRILL RW, CURRAN DS, GUNN JS, HARTOG JR,
HILL RD, WELCH DW, EvESON JP, BOGGS CH AND
BRAINARD RE. 2001. Ability of archival tags to provide estimates of geographical position based on light intensity. In: Sibert JR and Nielsen JL (Eds), Electronic tagging and
tracking in marine fisheries. dordrecht: Kluwer Academic
Publishers, p. 343-367.
MYRBERG AA. 2001. The acoustical biology of elasmobranchs. Envirn Biol Fish 60: 31-45.
R DEvELOPMENT CORE TEAM. 2011. R: A language and environment for statistical computing. R Foundation for Statistical Computing, Vienna, Austria. ISBN 3-900051-07-0, http://www.R-project.org.
SCHULTZ LP. 1975. Attacks by sharks related to activities of man. In: Gilbert PW (Ed), Sharks and Survival. Boston: D.C. Heath and Company, p. 3-60.
SOuzA PFR. 2007. Circulação hidrodinâmica na região
costeira dos municípios de Recife e Jaboatão dos Guararapes durante o verão austral. MSc thesis, Recife: Universidade Federal de Pernambuco. (Unpublished).
STRAMMA L. 1991. Geostrophic transport of the South
Equatorial Current in the Atlantic. J Mar Res 49: 281-294. STRAMMA L, FISCHER J AND REPPIN J. 1995. The North
Brazil undercurrent. deep-Sea Research Part I. Oceanogr
Res Pap 42: 773-795.
TRICAS TC, TAYLOR LRL AND NAFTEL G. 1981. Diel behavior of the tiger shark, Galeocerdo cuvier, at French Frigate Shoals, Hawaiian Islands. Copeia 4: 903-908.
WICKHAM H. 2009. ggplot2: elegant graphics for data analysis. Springer, London, 210 p.
WIRSING AJ, HEITHAUS MR AND DILL LM. 2006. Tiger shark (Galeocerdo cuvier) abundance and growth in a subtropical
embayment: evidence from 7 years of standardized fishing