Redirects Central
Metabolism to Increase Iron Availability
David B. Friedman1[, Devin L. Stauff2[, Gleb Pishchany2, Corbin W. Whitwell1, Victor J. Torres2, Eric P. Skaar2*
1Mass Spectrometry Research Center, Department of Biochemistry, Vanderbilt University Medical Center, Nashville, Tennessee, United States of America,2Department of Microbiology and Immunology, Vanderbilt University Medical Center, Nashville, Tennessee, United States of America
Staphylococcus aureuspathogenesis is significantly influenced by the iron status of the host. However, the regulatory impact of host iron sources onS. aureusgene expression remains unknown. In this study, we combine multivariable difference gel electrophoresis and mass spectrometry with multivariate statistical analyses to systematically cluster cellular protein response across distinct iron-exposure conditions. Quadruplicate samples were simultaneously analyzed for alterations in protein abundance and/or post-translational modification state in response to environmental (iron chelation, hemin treatment) or genetic(Dfur) alterations in bacterial iron exposure. We identified 120 proteins representing several coordinated biochemical pathways that are affected by changes in iron-exposure status. Highlighted in these experiments is the identification of the heme-regulated transport system (HrtAB), a novel transport system which plays a critical role in staphylococcal heme metabolism. Further, we show that regulated overproduction of acidic end-products brought on by iron starvation decreases local pH resulting in the release of iron from the host iron-sequestering protein transferrin. These findings reveal novel strategies used by S. aureus to acquire scarce nutrients in the hostile host environment and begin to define the iron and heme-dependent regulons ofS. aureus.
Citation: Friedman DB, Stauff DL, Pishchany G, Whitwell CW, Torres VJ, et al. (2006)Staphylococcus aureusredirects central metabolism to increase iron availability. PLoS Pathog 2(8): e87. DOI: 10.1371/journal.ppat.0020087
Introduction
Staphylococcus aureus requires iron to successfully colonize the host [1]. To ensure efficient uptake and metabolism of host iron sources, bacterial pathogens regulate a variety of genes in response to the levels of available iron. The canonical bacterial repressor responsible for this iron-dependent regulation is the ferric uptake regulator (Fur) [2].S. aureushas a functional Fur which has been implicated in the iron-dependent repression of a subset of genes [3–5]. AnS. aureusDfurmutant has a significant defect in virulence in a mouse model of infection, underscoring the importance of iron metabolism to staphylococcal pathogenicity [6]. The consensus sequence to which theS. aureusFur binds has been predicted using in silico techniques [7]; however, a global analysis of Fur and iron-affected proteins in this important human pathogen has not been reported. The demonstrated role for iron and Fur in staphylococcal pathogenesis emphasizes the importance of identifying the iron-dependent Fur regulon ofS. aureus.
Heme is the preferred iron source ofS. aureus,and heme acquisition contributes to staphylococcal infection [8]. We have proposed a model for heme-Fe acquisition that involves the hemolysin-dependent lysis of host erythrocytes followed by hemoglobin recognition, heme removal, and transport into the bacterial cytoplasm [9]. Once inside the bacterium, heme can either be degraded by staphylococcal heme monoxygenases [10,11] or segregated to the bacterial mem-brane, where it is likely incorporated intact into bacterial heme-binding proteins [8]. It is possible that the different potential fates for intracellular heme are dependent on the level of iron and/or heme exposure experienced by the bacterium in distinct host environments. If correct, this model suggests that bacterial pathogens monitor the level of intracellular heme and alter protein expression in response to changes in heme status.
Based on the demonstrated role for iron, Fur, and heme in staphylococcal pathogenesis, we sought to evaluate changes in global protein status in response to alterations in bacterial iron status using two-dimensional (2D) difference gel electro-phoresis (DIGE). DIGE enables quantitative differential-display analysis with statistical confidence and is based on 2D gel separations whereby thousands of protein features can be resolved based on isoelectric point and by apparent molecular mass. It uses spectrally resolvable fluorescent dyes (Cy2/3/5) to prelabel samples that are then multiplexed onto the same gel, allowing for direct quantification of each resolved protein feature between the three dye channels without analytical (gel-to-gel) variation. Multiple samples from a complex experiment can be analyzed across several DIGE gels, whereby an internal standard comprised of every sample present in the experiment is included in each multiplexed gel [12–15]. Within each gel, quantitative measurements are made for each resolved protein feature relative to the cognate signal from the internal standard, which is then used to normalize the intragel ratios between gels in a coordinated experiment. Thus, DIGE enables
Editor:Fred M. Ausubel, Harvard Medical School, United States of America ReceivedMarch 31, 2006;AcceptedJuly 14, 2006;PublishedAugust 25, 2006
DOI:10.1371/journal.ppat.0020087
Copyright:Ó2006 Friedman et al. This is an open-access article distributed under the terms of the Creative Commons Attribution License, which permits unrestricted use, distribution, and reproduction in any medium, provided the original author and source are credited.
Abbreviations:2D, two-dimensional; DIGE, difference gel electrophoresis; DIP, 2,29-dipyridyl; Fur, ferric uptake regulator; MS, mass spectrometry; PCA, principal component analysis; sRNA, small regulatory RNA; TCA, tricarboxylic acid; TSB, tryptic soy broth
* To whom correspondence should be addressed. E-mail: [email protected]
multiple conditions with repetition to be quantitatively analyzed with statistical confidence. Proteins of interest are then identified using mass spectrometry (MS) and database interrogation. Multivariate algorithms, such as principle component analysis (PCA) and unsupervised hierarchical clustering, can now be applied to DIGE datasets to enable analysis of global expression patterns. Combining multi-variable DIGE/MS with multivariate statistical analyses clus-ters cellular protein responses across distinct environmental conditions based on total expression profiles. These tech-nologies can be combined to identify expression changes in coordinated biochemical pathways.
In this manuscript, we report the application of multi-variable DIGE/MS to S. aureus cultures exposed to various biochemical and genetic manipulations in cellular iron status. We found that 21 distinct proteins undergo expression changes in response to exogenous hemin, representing the first reported global analysis of bacterial proteins that are affected by this host molecule. Further, through biochemical classifica-tion of proteins undergoing expression changes upon alter-ations in iron status, we observed an overrepresentation of proteins involved in the central metabolic pathways ofS. aureus. Based on these observations, a series of experiments was performed revealing that the Fur protein of iron-starvedS. aureus redirects central metabolic pathways to increase production of lactate as a fermentative end-product. This increase in lactate production contributes to a decrease in local pH, facilitating the release of iron from host transferrin. Results obtained from this study identify a novel strategy used byS. aureusto increase host iron availability and begin to define the iron- and heme-dependent regulons ofS. aureus.
Results
Changes in Iron Status Alter Staphylococcal Protein Expression Patterns
To identify proteins that are affected by alterations in host iron sources, we performed differential expression analyses
onS. aureuscultures grown under various conditions of iron exposure. Cytoplasmic proteins were prepared from wild-type and Dfurmutant cells grown under either iron-replete conditions, after iron starvation elucidated by treatment with 2,29-dipyridyl (DIP), or after exposure to hemin. Protein extracts from each of the four conditions were independently isolated in quadruplicate to control for nonbiological variation, and the resulting 16 extracts were simultaneously coresolved across eight DIGE gels that were coordinated by a Cy2-labeled 16-mix pooled-sample internal standard as described in Materials and Methods (Figure 1). PCA was used to group the 16 individual Cy3- or Cy5-labeled proteome maps based on the overall expression pattern from the more than 1,000 resolved protein forms under survey. PCA allowed for independent confirmation of distinct expression patterns from the four groups and demonstrated high reproducibility between the replicate samples. The four groups (control, iron-starved, Dfur, and hemin) all clustered into separate quadrants with only one proteome map from the hemin group clustering equidistant from the hemin group and the control group (Figure 1B). These assignments were reiterated in an unsupervised hierarchical clustering of the independent proteome maps presented as a heat map, where expression patterns of the individual proteins can also be compared (Figure 1D).
DIGE analysis combined with subsequent PCA and hier-archical clustering allowed for the grouping of protein expression changes between these four conditions into the following five classes: (I) proteins that are affected by hemin independent of Fur or iron (Table 1, proteins that are more abundant as shown in Figure 1C), (II) proteins that are negatively affected by iron and Fur (Table 2 and Figure 1C), (III) proteins that are positively affected by iron and Fur (Table 3 and Figure 1C), (IV) proteins that are affected by iron independent of Fur (Table 4), and (V) proteins that are affected by Fur independent of iron (Table 5). We identified 29 resolved protein features (representing 20 distinct proteins including isoforms) under iron-dependent negative control by Fur, 30 distinct features (25 proteins including isoforms) under iron-dependent positive Fur-mediated con-trol, and 21 distinct proteins that are exclusively affected by hemin.
Using the PCA and hierarchical clustering approach, we were able to further group the proteome expression maps into two primary clusters, one containing all eight samples prepared from bacteria grown in TSB or TSB containing hemin and a second containing all eight samples prepared from Dfur bacteria or bacteria starved for iron. This comprised the first principle component, which accounted for 62.3% of the variance in the system. These multivariate analyses of protein expression changes allow for a global representation of the similar patterns in protein expression that occur upon inactivation offur versus those that occur upon iron starvation. Furthermore, this analysis reveals that exposure ofS. aureusto hemin results in a vastly different, and less severe, change in cellular protein expression as compared to altering the iron status of the bacterium (Figure 1D).
S. aureusProteins Regulated by Hemin Independently of Iron or Fur (Class I)
The reactive nature of heme presents a unique problem to bacterial pathogens, as they must maintain an intracellular
Synopsis
heme homeostasis that prevents toxicity while internalizing enough heme for nutrient iron needs [8]. This raises the possibility that bacterial pathogens undergo a coordinated change in protein expression in response to exogenous heme. To identify proteins that respond to heme, we grewS. aureus in the presence of 10lM hemin and identified proteins that change expression upon hemin exposure but not upon inactivation of fur or iron starvation. Twenty-one proteins were identified that responded exclusively to excess hemin with statistical confidence (0.04.p.0.0000037), 16 of which were down-regulated between 1.25-fold and 3.6-fold (Table 1). These proteins represent a variety of predicted biochemical functions without clear overrepresentation of any one physiological pathway. Only five proteins increased expres-sion exclusively in response to hemin, comprising a hemin-activated regulon (Figure 1C). These proteins are involved in lactate metabolism (Ddh, 5.26-fold, p ¼ 0.000067), gene regulation (SaeR, 1.34-fold, p¼ 0.02), and stress response (YaaD, 3.78-fold,p¼0.000037, ClpL, 1.58-fold,p¼0.033). The
fifth protein, a putative conserved ABC transporter (SAV2359), exhibited a 45-fold increase (p¼0.0000037) upon exposure to hemin, and is predicted to encode for a conserved transporter with no demonstrated function. These experiments describe the first global analysis of the heme-regulon of a bacterial pathogen and identify a putative transport system that is highly up-regulated exclusively upon exposure to hemin.
The Hrt System Is Required forS. aureusGrowth in Hemin
The protein demonstrating the most significant increase upon hemin exposure (45-fold increase) is an ATP-binding component (SAV2359) of a previously uncharacterized ABC-type transport system. The gene encoding for SAV2359 is located immediately adjacent to a predicted permease component (SAV2360) of the same transport system. Based on our proteomic observations, we have named these proteins the heme-regulated transporter ATPase (HrtA) and permease (HrtB). Importantly, genomic analyses demonstrate that this transport system is conserved across many patho-Figure 1.Proteome Analysis Using 2D DIGE
(A) False–colored representative gel from the eight-gel set containing three differentially labeled samples as described in Materials and Methods. Cy2-labeled internal standard (blue), Cy3-Cy2-labeled control No. 1 (green), and Cy5-Cy2-labeled iron-starved No. 1 (red) are overlaid for illustrative purposes. (B) Unsupervised PCA properly groups the 16 individual DIGE expression maps differentiated by two principle components (PC1 and PC2) and demonstrates high reproducibility between the replicate samples within each group.
(C) Composites of DIGE expression patterns representing the five proteins that increase abundance in the presence of hemin (Class I, Table 1), the 29 Class II protein features negatively affected by Fur and iron (Table 2), and the 30 Class III protein features positively affected by Fur and iron (Table 3). (D) Unsupervised hierarchical clustering of the 16 individual DIGE expression maps (groups, shown along top) and of individual proteins (shown on the left), with relative expression values for each protein displayed as a heat map using a relative scale ranging from0.5 (green) toþ0.5 (red). The gel number (1 through 8), samples (A, TSB; B, iron-starved; C, hemin; and D,Dfur), and Cy3/5 dye labeling for each sample are listed below.
genic bacteria, including Bacillus anthracis, Listeria monocyto-genes,andEnterococcus faecalis(unpublished data).
To explore the contribution of the Hrt system to heme transport, we investigated whether strains inactivated forhrtA orhrtBcan grow when hemin is the sole available iron source. There was no detectable difference in the ability of wild-type, hrtA,andhrtBmutant strains to grow in medium where the sole iron source was FeSO4(Figure 2). In contrast, compared to wild-type, the hrtA and hrtB mutant strains are severely impaired in their ability to grow when hemin is the sole iron source (Figure 2). To further confirm that the hemin-dependent growth defect exhibited by strains inactivated forhrtAandhrtBis dependent on the insertional mutations, and as an attempt to rule out the possibility that the observed growth defects were due to secondary mutations, we transduced the hrtA and hrtB mutations into a clean wild-type background as previously described [10]. Successful transductants exhibited identical phenotypes as the original hrtAor thehrtBmutants, suggesting that inactivation of the Hrt system is responsible for the observed inability to grow in the presence of high hemin concentrations (Figure 2). Taken together, these observations identify the HrtAB as a novel staphylococcal heme transport system that is critically important to proper heme metabolism.
S. aureusProteins Negatively Regulated by Iron and Fur (Class II)
Proteins that increase abundance upon iron starvation or inactivation of fur (via release from repression) represent proteins negatively regulated by Fur in an iron-dependent manner, and hence comprise the canonical Fur regulon of the bacterium. We identified 29 distinct protein features
com-prising 20 unique cytoplasmic proteins that are increased from 1.3-fold to over 9-fold in the absence of iron or Fur (0.04
.p.0.0000012, Table 2). These results demonstrate a strong correlation between expression changes upon iron chelation versus the absence of Fur. As expected, iron acquisition systems previously shown to be iron-regulated via Fur are up-regulated under these conditions including proteins involved in siderophore synthesis (SbnE isoforms exhibiting over 3-fold increases in minus iron orDfur,0.013.p.0.00013) [16] and transport (FhuA, over 8-fold increases, p, 0.0000016) [17].
Five of 21 proteins that were classified as having Class II expression patterns with mostly moderate increases (approx-imately 1.5-fold) are enzymes of the glycolytic pathway including fructose 1-P kinase (FruB), fructose bisphosphate aldolase (FbaA), triosephosphate isomerase (Tpi), glyceralde-hyde 3-phosphate dehydrogenase (Gap), and transketolase (Tkt) (Table 2). This observation is consistent with a systemic up-regulation of glycolysis upon iron starvation, which would lead to a commensurate increase in pyruvate for subsequent use in the tricarboxylic acid (TCA) cycle or as a substrate for fermentative metabolism (Figure 3).
S. aureusProteins Positively Affected by Iron and Fur (Class III)
Fur is traditionally considered a repressor of iron-regulated gene transcription. However, recent work has highlighted a role for Fur in the direct and/or indirect activation of a small subset of genes inHelicobacter pylori[18], Vibrio cholerae [19], Neisseria meningitidis [20], Escherichia coli [21,22], and Bacillus subtilus [23]. We identified 30 distinct protein features representing 25 unique proteins that were Table 1.Proteins Affected by Hemin Independent of Iron and Fur
Protein IDa SAV Locusb Gene Nameb,c Functiond Fold Change p-Valuee
2776 0133 sodM Superoxide dismutase 2.66 0.014
2514 0211 acpD Acyl carrier protein phosphodiesterase 1.51 0.0067
1263 0390 guaB Inositol monophosphate dehydrogenase 1.39 0.0024
1166 0517 lysS Lysyl-tRNA synthetase 1.72 0.0066
1954 0519 yaaD Putative pyridoxal 59-phosphate synthetase 3.78 0.000037
1550 0550 bioF 7-Keto-8-aminopelargonate synthase 1.37 0.023
2139 0551 hchA hsp31 severe stress chaperone 1.55 0.04
2369 0706 saeR Response regulator 1.34 0.02
1392 0844 nifS Pyridoxal phosphate-dependent aminotransferase 1.14 0.027
1706 0956 NA Putative NADH-dependent flavin oxidoreductase 1.55 0.049
1416 0970 cdr Coenzyme A disulfide reductase 1.75 0.0025
1907 1063 folD methylenetetrahydrofolate dehydrogenase 1.29 0.044
3530 1446 NA Hypothetical protein 1.25 0.0028
1420 1475 engA GTPase possibly involved in ribosome assembly/stability 1.39 0.027
1111 1732 fhs Formyltetrahydrofolate synthetase 1.49 0.032
2803 1854 NA Hypothetical protein 1.41 0.024
2644 2359 hrtA Putative ABC transporter 45.14 0.0000037
2337 2514 bcrA Bacitracin ABC transporter 3.63 0.00061
1947 2524 ddh D-SpecificD-2-hydroxyacid dehydrogenase 5.26 0.000067
0883 2548 clpL Stress-responsive ATPase chaperone 1.58 0.033
1994 2606 fda Fructose-bisphosphate aldolase 1.66 0.018
a
Protein ID corresponds to Master Number in the Master Table S1.
bSAV number corresponds to position in the annotatedS. aureusMu50 genome.
cGene name corresponds to name listed in annotation of Mu50 genome. NA signifies no gene name listed. dGene name and function were determined based on closest hit in a BLAST search with an e value of less than 1010. e
positively affected by Fur in an iron-dependent manner as measured by decreased detection in the absence of Fur or upon iron starvation (Table 3).
Numerous regulatory factors were positively affected by Fur in an iron-dependent manner including RsbU. RbsU, down 2.12-fold (p¼0.0014) and 1.48-fold (p¼0.016) inDfur and iron-deplete conditions, respectively, controls the ex-pression of a variety of virulence genes and regulatory systems. Based on this pleotropy, small changes in RbsU expression may have profound affects on cellular metabolism. In particular, RbsU activates acetate catabolism; therefore, the Fur-dependent activation of RbsU is consistent with a down-regulation of the TCA cycle upon iron starvation orfur inactivation [24].
The value of iron to the bacterium is underscored by the Fur-mediated iron dependent increase of four separate proteins that are predicted to contain iron-sulfur clusters. Three of these proteins are the TCA cycle enzymes succinate dehydrogenase (SdhA, decreased 6.42-fold inDfur, p¼0.0015 and 3.8-fold in iron-depleted, p ¼ 0.00053), aconitate hydratase (CitB, decreased over 4-fold,p , 0.0002 in both conditions), and fumarate hydratase (CitG, decreased over 2-fold in both conditions, p , 0.00025). A fourth TCA cycle
enzyme, phosphoenolypyruvate carboxykinase (PckA), which coverts oxaloacetate to phosphoenypyruvate during gluco-neogenesis, was decreased approximately 1.7-fold upon inactivation offur(p¼0.0023) or iron depletion (p¼0.037). Two additional proteins associated with central metabolism and demonstrating group III expression patterns are D
-fructose-6-phosphate amidotransferase (GlmS) exhibiting 2.29-fold (p¼0.00063) and 1.8-fold (p¼0.0038) decreases in Dfurand iron-depleted conditions, respectively, and glycer-aldehyde 3-P dehydrogenase (GapB), exhibiting 14.5-fold (p¼
0.00052) and 6.1-fold (p¼0.000088) decreases in Dfur and iron-deplete conditions, respectively. GlmS converts fructose 6-P to glucosamine-6-P, and hence depletes substrate for phosphofructokinase in effect antagonizing glycolysis. GapB is a second glyceraldehyde 3-P dehydrogenase ofS. aureusand based on its function inBacillus subtilus,is predicted to possess an enzymatic GAPDH activity involved in gluconeogenesis [25]. These results support the Fur-mediated up-regulation of glycolysis upon iron starvation and suggest a commensurate systemic and regulated inhibition of the TCA cycle. Together, these findings support a model whereby in iron-starved S. aureus, excess pyruvate produced as a result of an up-Table 2.Proteins Negatively Affected by Fur and Iron
Protein IDa SAV Locusb
Gene Nameb,c
Functiond Fold Change
(Fe)
p-Valuee Fold Change (Dfur)
p-Valuee
1888 0116 NA Cysteine synthetase 9.41 0.0012 9.98 0.00054
1902 0116 NA Cysteine synthetase 3.00 0.00018 2.64 0.00056
1740 0117 NA Ornithine cyclodeaminase 3.12 0.0038 3.83 0.00022
1742 0117 NA Ornithine cyclodeaminase 14.13 0.0022 17.88 0.00086
1002 0120 sbnE Siderophore synthesis 3.22 0.00044 4.13 0.00013
1003 0120 sbnE Siderophore synthesis 4.47 0.0025 5.63 0.0011
1004 0120 sbnE Siderophore synthesis 4.07 0.013 5.22 0.0067
2790 0123 sodM Superoxide dismutase 1.57 0.033 2.13 0.0022
2793 0123 sodM Superoxide dismutase 2.37 0.00032 2.07 0.0021
2548 0255 ispD 2-C-methyl-D-erythritol-4-phosphate cytidyltransferase 1.73 0.0013 1.32 0.039
2037 0513 cysK O-Acetylserine (thiol)-lyase 1.36 0.013 1.70 0.00095
2139 0551 hchA Chaperone 1.99 0.00015 1.42 0.027
2410 0647 fhuA Ferrichrome transport 8.19 0.0000012 8.34 0.0000016
2066 0699 fruB Fructose 1-phosphate kinase 1.59 0.0097 1.43 0.031
1700 0772 gap Glyceraldehyde 3-phosphate dehydrogenase 1.69 0.0054 2.27 0.0048
1723 0772 gap Glyceraldehyde 3-phosphate dehydrogenase 1.53 0.014 1.66 0.0011
1726 0772 gap Glyceraldehyde 3-phosphate dehydrogenase 1.51 0.036 1.44 0.022
2492 0774 tpi Triosephosphatase isomerase 1.46 0.0068 1.52 0.0085
2188 0968 NA Decarboxylase 1.57 0.0036 1.22 0.046
1432 0984 NA 3-Oxoacyl synthase 1.73 0.0038 1.30 0.021
2217 1011 fabI Enoyl-[acyl carrier protein] reductase [NADH] 2.07 0.00046 1.42 0.026
2725 1259 frr Ribosome recycling factor 1.49 0.00081 1.27 0.03
0859 1342 tkt Transketolase 2.37 0.0000066 1.51 0.0013
0866 1342 tkt Transketolase 2.59 0.000041 1.78 0.00078
0956 1630 aspS Aspartyl-tRNA-synthetase 1.26 0.0034 1.31 0.015
2168 2125 fbaA Fructose bisphosphate aldolase 1.53 0.00061 1.49 0.00016
2169 2125 fbaA Fructose bisphosphate aldolase 1.40 0.029 1.46 0.002
1994 2125 fbaA Fructose bisphosphate aldolase 5.19 0.00000098 5.93 0.000001
2005 2125 fbaA Fructose bisphosphate aldolase 3.66 0.0001 4.63 0.00005
1786 2302 NA D-Octopine dehydrogenase 1.93 0.0028 1.33 0.042
1750 2455 NA Endo-1,4b-gluconase 1.94 0.0015 1.52 0.016
a
Protein ID corresponds to Master Number in the Master Table S1.
b
SAV number corresponds to position in the annotatedS. aureusMu50 genome.
c
Gene name corresponds to name listed in annotation of Mu50 genome. NA signifies no gene name listed.
d
Gene name and function were determined based on closest hit in a BLAST search with an e value of less than 1010
.
ep
regulation of the glycolytic pathway is shuttled into fermen-tative pathways as opposed to the TCA cycle.
In keeping with the above model, Class III proteins associated with fermentative metabolism were represented by alcohol dehydrogenase (Adh1), butyryl-CoA dehydrogen-ase (between 1.5- to 7-fold decredehydrogen-ases for the two conditions, 0.05.p. 0.00002), and three distinct isoforms of formate acetyltransferase (PflB) (between 3.6 to 7.3-fold decreases for the two conditions across isoforms). These three enzymes are involved in the conversion of pyruvate to distinct end-products of fermentative metabolism: formate, ethanol, or butyrate, respectively. These decreases upon iron chelation suggest that iron-starved S. aureus metabolize pyruvate through fermentation to metabolic end-products other than formate, ethanol, or butyrate. These results suggest that excess pyruvate produced as a result of increased glycolysis is converted to other predicted products of staphylococcal fermentative metabolism, such as 2,3-butanediol and/or lactate (Figure 3).
S. aureusProteins Regulated by Iron Independently of Fur (Class IV)
In addition to Fur,S. aureuspossesses the metal-dependent regulators Zur [26], PerR [27], and MntR [28]. The presence of
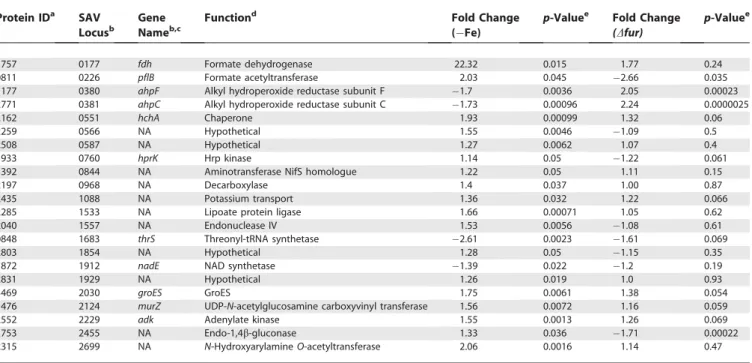
multiple metal-specific regulatory factors raises the possibil-ity that additional as-yet-unidentified factors other than Fur respond to changes in cellular iron content. We identified 22 unique proteins that were positively or negatively affected by iron starvation, but whose expression was not affected by inactivation of fur (Table 4). Four of these proteins are associated with cellular respiration including formate dehy-drogenase (Fdh) which was up-regulated 22.32-fold in the absence of iron (p¼0.015), Hpr Kinase (HprK), NAD synthase (NadE), and a single isoform of formate acetyltransferase (PflB). Thus, we have identified a significant pool of proteins that are affected by iron independently of Fur, raising the possibility that an additional transcriptional regulator exists inS. aureusto monitor intracellular iron status.It should be pointed out that DIP binds divalent cations other than iron which might be responsible for some of the Class IV expression changes that were observed.
S. aureusProteins Regulated by Fur Independently of Iron (Class V)
We also identified 24 unique proteins that changed expression upon inactivation of fur without any significant changes in iron availability status (Class V, Table 5). One Class V protein, GapR, is an activator of Gap expression and is Table 3.Proteins Positively Affected by Fur and Iron
Protein IDa SAV Locusb
Gene Nameb,c
Functiond Fold Change
(Fe)
p-Valuee Fold Change (Dfur)
p-Valuee
2302 0018 vicR Response regulator 1.39 0.03 1.53 0.01
0825 0226 plfB Formate acetyltransferase 7.04 0.0022 3.58 0.012
0846 0226 pflB Formate acetyltransferase 7.30 0.0043 4.55 0.0094
0845 0226 pflB Formate acetyltransferase 6.67 0.0033 4.46 0.0054
1964 0519 NA Pyridoxine biosynthesis 2.23 0.0078 2.86 0.0025
2748 0520 NA SNO glutamine amidotransferase 1.67 0.0083 1.65 0.0044
1979 0548 tuf Translation elongation TU 4.07 0.036 4.17 0.035
1855 0605 adh1 Alcohol dehydrogenase 1.73 0.0046 1.38 0.037
1867 0605 adh1 Alcohol dehydrogenase 1.63 0.0074 1.42 0.05
1543 0938 NA Pyridine nucleotide disulfide oxidoreductase 2.61 0.00003 4.25 0.0000053
0567 1139 pheT Phe-tRNA synthetase 1.19 0.043 1.42 0.0039
1066 1148 sdhA Succinate dehydrogenase 3.80 0.00053 6.42 0.0015
3073 1178 NA Hypothetical protein 1.61 0.00073 1.40 0.041
2428 1255 codY Transcriptional repressor 1.49 0.0052 2.35 0.0031
0487 1350 citB Aconitate hydratase 4.15 0.00013 5.82 0.0000087
2235 1492 srrA Staphylococcal respiratory regulator 1.87 0.0011 1.99 0.000012
1679 1512 NA Tripeptidase 1.22 0.0022 1.54 0.0014
1595 1687 gapB Glyceraldehyde 3-phosphate dehydrogenase 2 6.10 0.000088 14.48 0.00052
1554 1729 tyrS Tyrosyl tRNA synthetase 1.24 0.017 1.26 0.033
1133 1791 pckA Phosphoenolpyruvate carboxykinase 1.77 0.037 1.75 0.0023
1382 1851 citG Fumarate hydratase 2.47 0.00025 3.78 0.000011
1943 2067 rbsU Sigma B 1.48 0.016 2.12 0.0004
1526 2136 pdp Pyridine-nucleoside phosphorylase 1.77 0.0028 2.34 0.00034
0970 2154 glmS D-Fructose-6-phosphate amidotransferase 1.53 0.024 1.82 0.006
0968 2154 glmS D-Fructose-6-phosphate amidotransferase 1.42 0.007 4.66 0.000011
0969 2154 glmS D-Fructose-6-phosphate amidotransferase 1.80 0.0038 2.29 0.00063
1765 2165 NA MRP-like ATP-binding protein 1.59 0.0052 1.62 0.0026
2216 2204 NA Hypothetical 1.39 0.0044 1.62 0.0001
1694 2285 NA Butyryl-CoA dehydrogenase 2.15 0.000057 2.56 0.00002
1782 2305 NA Glycerate dehydrogenase 1.67 0.0073 2.02 0.00067
a
Protein ID corresponds to Master Number in the Master Table S1.
bSAV number corresponds to position in the annotatedS. aureusMu50 genome.
cGene name corresponds to name listed in annotation of Mu50 genome. NA signifies no gene name listed. dGene name and function were determined based on closest hit in a BLAST search with an e value of less than 1010. e
Table 4.Proteins Affected by Iron Independently of Fur
Protein IDa SAV Locusb
Gene Nameb,c
Functiond Fold Change
(Fe)
p-Valuee Fold Change (Dfur)
p-Valuee
1757 0177 fdh Formate dehydrogenase 22.32 0.015 1.77 0.24
0811 0226 pflB Formate acetyltransferase 2.03 0.045 2.66 0.035
1177 0380 ahpF Alkyl hydroperoxide reductase subunit F 1.7 0.0036 2.05 0.00023
2771 0381 ahpC Alkyl hydroperoxide reductase subunit C 1.73 0.00096 2.24 0.0000025
2162 0551 hchA Chaperone 1.93 0.00099 1.32 0.06
2259 0566 NA Hypothetical 1.55 0.0046 1.09 0.5
2508 0587 NA Hypothetical 1.27 0.0062 1.07 0.4
1933 0760 hprK Hrp kinase 1.14 0.05 1.22 0.061
1392 0844 NA Aminotransferase NifS homologue 1.22 0.05 1.11 0.15
2197 0968 NA Decarboxylase 1.4 0.037 1.00 0.87
2435 1088 NA Potassium transport 1.36 0.032 1.22 0.066
2285 1533 NA Lipoate protein ligase 1.66 0.00071 1.05 0.62
2040 1557 NA Endonuclease IV 1.53 0.0056 1.08 0.61
0848 1683 thrS Threonyl-tRNA synthetase 2.61 0.0023 1.61 0.069
2803 1854 NA Hypothetical 1.28 0.05 1.15 0.35
1872 1912 nadE NAD synthetase 1.39 0.022 1.2 0.19
2831 1929 NA Hypothetical 1.26 0.019 1.0 0.93
3469 2030 groES GroES 1.75 0.0061 1.38 0.054
1476 2124 murZ UDP-N-acetylglucosamine carboxyvinyl transferase 1.56 0.0072 1.16 0.059
2552 2229 adk Adenylate kinase 1.55 0.0013 1.26 0.069
1753 2455 NA Endo-1,4b-gluconase 1.33 0.036 1.71 0.00022
2315 2699 NA N-HydroxyarylamineO-acetyltransferase 2.06 0.0016 1.14 0.47
a
Protein ID corresponds to Master Number in the Master Table S1.
b
SAV number corresponds to position in the annotatedS. aureusMu50 genome.
c
Gene name corresponds to name listed in annotation of Mu50 genome. NA signifies no gene name listed.
d
Gene name and function were determined based on closest hit in a BLAST search with an e value of less than 1010
.
ep
-Values were calculated using the Student’st-test. DOI: 10.1371/journal.ppat.0020087.t004
Table 5.Proteins Affected by Fur Independently of Iron
Protein IDa SAV Locusb
Gene Nameb,c
Functiond Fold Change
(Fe)
p-Valuee Fold Change (Dfur)
p-Valuee
2456 0126 butA Acetoin reductase 1.27 0.15 1.55 0.024
2776 0133 sodM Superoxide dismutase 1.46 0.062 2.33 0.0024
1456 0139 drm Phosphopentomutase 1.2 0.096 1.47 0.0087
0807 0226 pflB Formate acetyltransferase 1.75 0.065 3.5 0.0053
0811 0226 pflB Formate acetyltransferase 2.03 0.045 2.66 0.035
1177 0380 ahpF Alkyl hydroperoxide reductase subunit F 1.7 0.0036 2.05 0.00023
2771 0381 ahpC Alkyl hydroperoxide reductase subunit C 1.73 0.00096 2.24 0.0000025
2312 0491 NA TatD-related DNase 1.01 0.83 1.76 0.033
2042 0513 cysK O-Acetylserine (thiol)-lyase 1.3 0.093 1.42 0.025
2465 0531 NA tRNA/mRNA methyltransferase 1.13 0.26 1.51 0.00085
1771 0771 gapR Glycolytic operon regulator 1.16 0.44 1.24 0.05
2503 0842 NA ABC transporter 1.22 0.061 1.4 0.0067
1712 0957 rocD Ornithine-oxo-acid transaminase 1.51 0.067 3.14 0.0012
1434 0958 gudB NAD-glutamate dehydrogenase 1.04 0.7 1.42 0.013
0595 0975 clpB ClpB chaperone 1.29 0.09 2.06 0.0055
2560 1339 lexA Transcriptional repressor 1.02 0.84 1.59 0.026
1916 1425 NA Hypothetical 1.1 0.3 1.55 0.000079
1580 1694 citC Isocitrate dehydrogenase 1.12 0.7 2.8 0.018
1582 1694 citC Isocitrate dehydrogenase 1.4 0.12 3.85 0.000048
1572 1737 NA 3-Deoxy-7-phosphoheptulonate synthase 1.02 0.76 1.53 0.0053
1142 1791 pckA Phosphoenolpyruvate carboxykinase 1.35 0.12 2.85 0.00039
2397 2416 pgm Phosphoglycerate mutase 1.06 0.96 1.94 0.24
2398 2416 pgm Phosphoglycerate mutase 1.27 0.093 2.02 0.000075
1753 2455 NA Endo-1,4b-gluconase 1.33 0.036 1.71 0.00022
a
Protein ID corresponds to Master Number in the Master Table S1.
b
SAV number corresponds to position in the annotatedS. aureusMu50 genome.
c
Gene name corresponds to name listed in annotation of Mu50 genome. NA signifies no gene name listed.
d
Gene name and function were determined based on closest hit in a BLAST search with an e value of less than 1010
.
ep
increased in the absence of Fur (1.24-fold, p¼0.05). This moderate increase in expression may contribute to the increase in Gap expression observed upon inactivation of fur(as much as 2.27-fold,p¼0.0048; Table 2). Inactivation of furleads to down-regulation of PckA (2.85-fold,p¼0.00039) and isocitrate dehydrogenase (CitC; 3.85-fold, p¼ 0.0018), consistent with our previous observation of Fur-mediated activation of the TCA cycle. Furthermore, acetoin reductase (ButA) is decreased by inactivation offur(1.55-fold,p¼0.024) implying a commensurate decrease in the production of 2,3-butanediol upon iron starvation. Taken together with results described above, this suggests that a major metabolic end-product of carbohydrate metabolism produced by iron-starvedS. aureusis lactate (Figure 3).
Iron-StarvedS. aureusProduce Excess Lactate Leading to a Decrease in Local pH
Iron-starved S. aureus are known to restrict oxidative capacity by oxidizing glucose with the accumulation of much lactate and minor amounts of pyruvate, acetate, and acetoin [29]. The coordinated expression changes of the staph-ylococcal central metabolic pathways identified using DIGE/ MS are summarized in Figure 3 and provide a mechanistic explanation for this observation. Our results suggest that iron-starvedS. aureusundergo a Fur-mediated redirection of central metabolic pathways leading to the production of lactate as a primary end-product of fermentative metabolism. To test this hypothesis, we measured the amount of lactate produced by S. aureus after growth in either iron-replete conditions, upon iron starvation elicited by DIP, or uponfur inactivation. S. aureus grown under iron-starved conditions produced approximately 3-fold more lactate thanS. aureus grown in the presence of iron. Similarly, inactivation offur increased lactate production by approximately 2-fold in iron-replete medium (Figure 4A). To test whether this increase in
lactate production contributes to a commensurate decrease in pH, we measured the pH of medium from cultures of iron-replete, iron-deplete,Dfur, andDfurcontaining a full-length copy offurprovided in trans(Dfurþfur). These experiments demonstrated a drop in the pH of the iron-starved culture from 7.2 to 5.2 upon either iron starvation orfurinactivation (Figure 4B). Providing fur in trans complemented the pH decrease of theDfurstrain linking the observed decrease in pH to an absence offur. When subjected to identical growth conditions, iron-replete cultures increased pH to close to 8.0 (Figure 4B). From these data, we conclude that S. aureus elaborates a Fur-mediated redirection of central metabolism under iron starvation to increase lactate production and decrease pH.
Transferrin-iron represents a viable iron source to invad-ing bacterial pathogens. In order to utilize transferrin-iron as a nutrient iron source, the iron must be dissociated from transferrin and transported into the bacterium. Free Fe3þis more readily utilized as a nutrient source than transferrin bound iron, and iron is known to dissociate from transferrin upon changes in pH [30]. We hypothesized that the Fur-dependent redirection of central metabolism by iron-starved S. aureus facilitates the release of iron from transferrin through a decrease in local pH. To test this hypothesis, we measured iron release from transferrin mediated by spent medium from either iron-replete, iron-deplete,Dfur, orDfurþ
fur staphylococcal cultures. We found that medium from iron-starved or Dfur staphylococcal cultures significantly increased the rate of iron release from transferrin and this phenotype was partially complemented by providing furin trans (Figure 4C). A similar pattern of iron release was observed upon incubation of transferrin in the presence of lactate (Figure 4D). Taken together, these results demonstrate that the Fur-mediated production of lactate by iron-starvedS. aureusfacilitates the release of iron from host iron-sequester-ing proteins.
Discussion
In this study, we have analyzed changes in the cytoplasmic protein profile of S. aureus upon genetic (Dfur) and bio-chemical (iron chelation, hemin treatment) alterations in iron exposure. Using large-format, high-resolution DIGE with mixed-sample internal standards, we simultaneously surveyed the S. aureus proteome in response to these manipulations versus control in quadruplicate to provide for statistical confidence. Overall, 156 protein features of interest, specify-ing approximately 120 individual proteins (includspecify-ing changes in post-translational modification) were identified by mass spectrometry and placed into functional groups defining Fur-dependent and inFur-dependent iron regulation as well as hemin-affected proteins.
The hemin-affected proteins were particularly of note because this class of proteins has not previously been characterized in bacterial pathogens, despite the identifica-tion of heme-regulated proteins in other bacterial pathogens such asCorynebacterium diptherhia[31] andBordetellasp. [32,33]. The majority of the 21 proteins in this class were decreased upon hemin exposure. However, a few notable exceptions were identified, including a dramatic 45-fold increase of a single protein component (SAV2359) of a putative trans-porter system which we have named the heme-regulated Figure 2. The Hrt System Is Required for Staphyloccocal Growth in
Hemin
S. aureusNewman (WT), SAV2359 mutant(hrtA),SAV2360 mutant(hrtB),
transduced SAV2359 mutant(t-hrtA),and transduced SAV2360 mutant(
t-hrtB)strains were grown in iron-free medium supplemented with iron (Fe) or with hemin (hemin). Bacterial growth was determined by measuring the optical density (O.D.600) of cultures. Results represent the mean6SD from triplicate determinations. Asterisks denote statistically significant differences from wild-type as determined by a Student’st-test (p,0.05).
transporter (HrtAB). This dramatic increase in abundance in the presence of hemin suggests a role for the HrtAB system in heme transport. As a preliminary test of this hypothesis, we individually inactivated hrtA and hrtB and monitored the ability of these strains to grow in the presence of hemin as a sole iron source. These experiments demonstrated a severe growth restriction on hemin upon inactivation ofhrtABand identify the HrtAB system as a critical component of staphylococcal heme metabolism. The Hrt system joins the heme transport system (HtsABC) and iron-regulated surface determinant system, as a third membrane-associated heme transporter [4,8]. The presence of three separate membrane-associated transport systems with roles in heme transit underscores the value of heme metabolism toS. aureus.
The response regulator SaeR was also increased upon exposure to hemin, whereby the modest 1.34-fold increase (p
¼0.02) may well have profound affects on gene transcription of target proteins. SaeR together with SaeS activates the transcription of several exoproteins including a-hemolysin
and b-hemolysin [34], two proteins with potent erythrocyte lysis activity. It is tempting to speculate that the recognition of host heme up-regulates SaeR expression, in turn activating
a- andb-hemolysins, which would lead to an increase in local erythrocyte hemolysis and free hemoglobin concentrations. This might represent a positive regulatory circuit used byS. aureus to increase local heme concentrations, and hence nutrient iron availability.
Another noteworthy class of proteins identified in our study was decreased upon inactivation of fur in an iron-dependent manner, suggesting a Fur-mediated increase in abundance of these proteins. In gram-negative bacteria, the mechanism for Fur-mediated positive regulation of proteins has been elucidated by elegant studies beginning with the work of Masse et al. [35]. These and other investigations have identified the small regulatory RNA (sRNA) RhyB as being responsible for Fur-dependent protein activation in E. coli [35],Pseuodomonas aueruginosa[36],V. cholera[37], andShigella flexerni [38]. The targets of RhyB include some of the same Figure 3.Lactate Is a Primary End-Product of Carbohydrate Metabolism by Iron-StarvedS. aureus
A subset of the predicted central metabolic reactions ofS. aureusis shown. Proteins shown in red are up-regulated in the absence of iron or upon inactivation offur. Proteins shown in blue are down-regulated in the absence of iron or upon inactivation offur. Proteins shown in green are down-regulated in the absence of Fur independent of iron status. The red arrows predict the direction of reactions upon iron starvation, while the blue arrows predict reactions that are inhibited upon iron starvation.
genes identified in our study as being positively regulated by Fur, including the TCA cycle enzymes aconitase (acnA), fumarase (fumA), and succinate dehydrogenase (sdhCDAB) [21]. This observation suggests that a similar mechanism of iron-dependent gene regulation is occurring in S. aureus, however we were unable to identify any potential homologues to RyhB in any Gram positive bacterial genome using traditional BLAST analyses (unpublished data).S. aureus has been reported to express at least 12 sRNAs with predicted roles in translational regulation through message stability [39]. It is likely that an as-yet-undiscovered sRNA-mediated regulatory system exists in S. aureus responsible for iron homeostasis through targeted mRNA degradation.
Our data indicate that iron starvation leads to the reversible inactivation (or down-regulation) of TCA cycle enzymes including aconitase, the down-regulation of which has been implicated as a survival response to oxidative stress induced during the host-pathogen interaction [40]. In S. aureus, downregulation of the TCA cycle through aconitase inactivation prevents maximal expression of the virulence factors lipase, staphylococcal enterotoxin C, anda- and b -hemolytic toxins and therefore alters the interaction between S. aureusand the host [40]. Additionally, inactivation of the
TCA cycle or growth in iron-deplete conditions leads to a decrease in production of formylated delta-toxin, a potent neutrophil attractant [41]. Combined, these two factors have led to the suggestion that down-regulation of the TCA cycle may protect against host immune-mediated recognition of infectingS. aureus[41].
We propose a model whereby upon iron starvation, such as would be encountered inside the host,S. aureusup-regulates glycolysis through the release of Fur-mediated repression of glycolytic enzymes. Based on the simultaneous Fur-mediated down-regulation of TCA cycle enzymes, pyruvate does not enter the TCA cycle but instead is acted on by fermentative pathways. We have demonstrated here that four separate branches of fermentative metabolism are down-regulated under iron starvation, which we predict funnels excess pyruvate into acidic fermentative end-products including lactate (Figure 3).
The production of the acidic end-product lactate contrib-utes to a decrease in the local pH of the microenvironment surrounding infecting staphylococci, a hypothesis supported by the observation that the pH of the spent medium from iron-starved orDfurstaphylococci is significantly more acidic than that of spent medium from iron-replete cultures (Figure 4B). Figure 4.Lactate Produced by Iron-StarvedS. aureusFacilitates Iron Release from Transferrin
(A and B) pH and lactate concentrations of fresh sterile medium(TSB 1),sterile medium after 15 hour incubation at 378C(TSB 2),fresh sterile medium containing 1mM DIP(2,29dipyridyl),spent medium from wild-type staphylococci grown under iron-replete conditions(iron replete),spent medium from wild-type staphylococci grown under iron-starved conditions(iron deplete),spent medium from theDfurmutant grown in TSB(Dfur),or spent medium from theDfurmutant with full-lengthfurprovided intrans (Dfurþfur). Asterisks denote statistical significance as determined by the Student’st-test. A single asterisk represents a comparison to iron-replete cultures, while dual asterisks represent a comparison to iron-deplete orDfurcultures. (C) Iron release from transferrin mediated by various media samples. A decrease in optical density signifies a release of iron from transferrin. (D) Iron release from transferrin mediated by various lactate concentrations shown as molar values. The corresponding pH of the media containing the listed lactate concentrations is shown.
This overproduction of lactate and subsequent decrease in pH dissociates iron from host iron-sequestering molecules (Figure 4C and 4D). Further, the decrease in the local pH combined with a commensurate decrease in Eh (oxidation reduction potential) would be expected to change the oxidation state of host iron atoms converting the insoluble ferric iron to the more bioavailable ferrous iron. An increase in local ferrous iron concentrations would significantly relieve the iron stress placed on the bacterium and provide a growth advantage to invading staphylococci. The Fur-mediated redirection of central metabolic pathways to increase iron availability is supported by published results showing that the uptake of iron (presented as59FeSO4) byS. aureusis twice as great at pH 4.7 as it is at a pH 7.4 [42].
It is possible that additional acidic end-products of fermentative metabolism contribute to the acidification of the culture medium upon growth of iron-starved S. aureus. For instance, the production of formate as a fermentative end-product would contribute to a decrease in the pH of the microenvironment surrounding iron-starvedS. aureus. Acetyl-CoA is converted to formate by formate acetyltransferase (PflB), an enzyme that was identified in our proteomic analyses by three separate isoforms exhibiting decreased abundance upon iron starvation orfurinactivation (Table 3). These results suggest that formate does not significantly contribute to the acidification of spent medium from iron-starved staphylococcal cultures. However, we did identify a single and separate isoform of PflB that increased expression upon iron starvation (2.03-fold; Table 4). Formate dehydro-genase, which subsequently converts formate to NADH, Hþ , and CO2, also exhibited an increase in abundance upon iron starvation (22.32-fold), consistent with the possibility that appreciable amounts of formate are formed by iron-starved staphylococci. We were unable to detect a significant increase in formate accumulation in the medium of iron-starved staphylococcal cultures (unpublished data), suggesting that if formate is being accumulated as a result of iron starvation, it is a transient increase due to catabolism by Fdh.
Although the experiments described here were performed in vitro, the severe iron restriction encountered byS. aureus once inside the host strongly supports an in vivo relevance for these findings. These fundamental changes in metabolic function potentially provide a survival advantage toS. aureus by preventing maximal activation of the immune system while the bacteria struggle to alter its microenvironment to access host iron.
Materials and Methods
Bacterial strains and growth conditions. S. aureusclinical isolate Newman was used in all experiments. Prior to cytoplasmic extraction,
bacteria were grown in TSB for 15 h at 378C with shaking at 180 rpm.
Iron starvation was achieved by addition of 1 mM DIP to the growth cultures prior to inoculation. Hemin treatment was achieved by
addition of 10lM hemin to the growth cultures prior to inoculation.
All cultures were incubated in the dark to maintain the integrity of the hemin. To avoid differential gene expression due to growth phase, the cultures were harvested at comparable optical densities
during early stationary phase. NewmanDfur was created through
transduction of the previously createdDfurallele from RN4220 [43] to
strain Newman with the transducing phage U-85 as previously
described [10].
S. aureus strain NewmanDfurwas complemented by providing a
full-length copy of fur (SAV1498) under the control of its native
promoter in the context of a promoterless pOS1-derived vector.fur
was PCR amplified fromS. aureusNewman genomic DNA using a 59
primer containing an EcoRI site and a 39primer containing a BamHI
site. The PCR product was cloned into pCR2.1 (Invitrogen, Carlsbad, California, United States) and excised by digestion with EcoRI and BamHI (New England Biolabs, Beverly, Massachusetts, United States).
pOS1 was digested with EcoRI and BamHI and fur was inserted,
yielding pOS1fur, where fur is under the control of its native
promoter. pOS1furand pOS1 were electroporated into the
restric-tion deficient primary recipient RN4220, after which they were electroporated into appropriate electrocompetent secondary
recip-ient strains (Newman and NewmanDfurfor pOS1, NewmanDfurfor
pOS1fur).S. aureusstrains harboring plasmids were selected on and
grown in either tryptic soy agar or tryptic soy broth containing 10lg/
ml chloramphenicol.
hrtAandhrtBmutants were obtained from the Phoenix (N) library,
clones PhiNE 03177 (SAV2359) and PhiNE 01762 (SAV2360) [44]. The
Phoenix mutant isolates are derivatives of the clinicalS. aureusisolate
Newman that has been mutagenized using the transposon bursa
aurealistransposon. The exact site of transposon insertions have been determined by DNA sequencing and inactivated genes annotated
using theS. aureusMu50 genome [44]. Thebursa aurealisinsertions in
hrtAandhrtBwere transduced into wild-typeS. aureusNewman with
the transducing phage 85 as previously described [10].
Preparation of cytoplasmic fractions. Cytoplasmic extracts were prepared upon completion of 15 h of bacterial growth. Cells were pelleted by centrifugation at 6,000 g for 15 min. Pellets were resuspended in sucrose buffer (100 mM Tris-HCl [pH 7.0], 500 mM
sucrose, 100 mM MgCl2) and incubated at 378C for 45 min in the
presence of 1 mg of lysostaphin. Following cell wall digestion,
protoplasts were isolated by centrifugation at 13,700gand washed
once and resuspended in 20 ml of buffer (50 mM Tris [pH 7.5], 150
mM NaCl, 100lM phenylmethylsulfonyl fluoride [PMSF]). To lyse the
protoplasts, samples were subjected to two rounds of French Press mediated lysis at 20,000 psi. Insoluble material was removed by
ultracentrifugation at 100,000 g for 45 min. The collected
super-natant, representing the cytoplasmic fraction, was used in subsequent analyses. Successful fractionation was confirmed by immunoblot
using fraction specific antisera which recognize the cytoplasm (a
-IsdG), membrane (a-IsdE), and cell wall (a-IsdB) ofS. aureus[10].
DIGE/MS. Quadruplicate samples from the four conditions were independently prepared as described above. For each sample, 0.25 mg of protein was separately precipitated with methanol and chloroform
[45] and resuspended in 30ll of lysis buffer (7 M urea, 2 M thiourea,
4% CHAPS, 30 mM Tris, 5 mM magnesium acetate). The NHS-ester dyes Cy2/3/5 were used for the minimal labeling protocol using an
internal standard [12,13,46]. Briefly, one-third of each sample (10ll,
83lg) was removed and combined into a single tube to comprise the
pooled-sample internal standard (1,330lg total). The remaining
two-thirds of each individual sample (20 ll, 167 lg) was individually
labeled with 200 pmol of either Cy3 or Cy5, while the pooled-sample was labeled en masse with 1,600 pmol of Cy2. The samples were
quenched with 10 mM lysine (2ll for each 200 pmol) for 10 min on
ice, followed by the addition of equal volume 23rehydration buffer (7
M urea, 2 M thiourea, 4% CHAPS, 4 mg/ml DTT). Pairs of Cy3/Cy5-labeled samples were mixed with an equal aliquot of the Cy2-Cy3/Cy5-labeled internal standard according to the schema in Figure 1. Tripartite
samples were brought up to 450ll with 13rehydration buffer (same
as 23buffer but with 2 mg/ml DTT and 0.5% IPG buffer 4–7) and
passively rehydrated into 24-cm 4–7 immobilized pH gradient (IPG)
strips for 24 h (total of 500lg per gel).
All 2D DIGE-associated instrumentation was manufactured by GE Healthcare/Amersham Biosciences (Piscataway, New Jersey). First-dimensional separations were performed on a manifold-equipped IPGphor first-dimension isoelectric focusing unit, and second-dimensional 12% SDS-PAGE was carried out using hand-cast gels that had one plate presilanized (to ensure subsequent accurate robotic protein excision) using an Ettan DALT 12 unit, both according to the manufacturer’s protocols. Cy2/3/5-specific 16-bit
data files were acquired at 100 lm resolution separately by
dye-specific excitation and emission wavelengths using a Typhoon 9400 Variable Mode Imager, and the gels were stained for total protein content with SyproRuby (Molecular Probes/Invitrogen) per the manufacturer’s instructions.
to normalize and compare Cy3:Cy2 and Cy5:Cy2 abundance ratios across the eight-gel set, enabling statistical confidence to be associated with each change in abundance or charge-altering
post-translational modification using Student’st-test and ANOVA analyses
(Table S1). Unsupervised PCA and hierarchical clustering was performed using the DeCyder Extended Data Analysis (EDA) module. Proteins of interest were robotically excised, digested into peptides in-gel with modified porcine trypsin protease (Trypsin Gold; Promega, Madison, Wisconsin, United States) and peptides applied to a stainless steel target using an integrated Spot Handling Workstation per the manufacturer’s recommendations. Matrix assisted laser desorption/ionization, time-of-flight mass spectrometry (MALDI-TOF MS) and data-dependant TOF/TOF tandem MS/MS was performed on a Voyager 4700 (Applied Biosystems, Framingham, Massachusetts, United States). The resulting peptide mass maps and the associated fragmentation spectra were collectively used to
interrogate S. aureus Mu50 sequences to generate statistically
significant candidate identifications using GPS Explorer software (Applied Biosystems, Foster City, California, United States) running the MASCOT search algorithm (http://www.matrixscience.com). Searches were performed allowing for complete carbamidomethyla-tion of cysteine, partial oxidacarbamidomethyla-tion of methionine residues, and one missed cleavage. Molecular Weight Search (MOWSE) scores, number of matched ions, number of matching ions with independent MS/MS matches, percent protein sequence coverage, and correlation of gel region with predicted MW and pI were collectively considered for each protein identification (all data are presented in Table S1).
Growth curve assays. S. aureus cultures were grown overnight under low-iron conditions by inoculating strains in RPMI
supple-mented with 1% casamino acids plus 200lM DIP. Overnight cultures
were then subcultured in NRPMI (Chelex- treated RPMI) containing
500lM DIP, and inoculated into NRPMIþ(NRPMI containing 25lM
ZnCl2, 25lM MnCl2, 1 mM MgCl2, 100lM CaCl2) supplemented with
500lM DIP, and 20lM iron sulfate or 10lM hemin as indicated.
Cultures were grown at 378C with aeration in a round-bottom 96-well
plate and bacterial growth was monitored by increase of absorbance
(O.D.600) over time.
Measuring pH, transferrin-Fe release, and lactate.Bacteria were grown in 10 ml of tryptic soy broth (TSB) in a 50-ml flask for 15 h at 37 8C with 180 rpm shaking. All strains containing derivatives of
pOS1 were grown in the presence of 10lg/ml chloramphenicol to
ensure successful maintenance of the plasmid and to normalize growth conditions. Iron was chelated from the media by adding DIP to a final concentration of 1 mM. After 15 h, the cultures were centrifuged and the supernatants were collected. All pH values were measured using a S20 SevenEasy pH meter (Mettler Toledo).
Measuring the release of iron from transferrin was performed as previously described [47]. Iron-bound transferrin exhibits an absorp-tion peak at 470 nm. As iron dissociates from transferrin the intensity of the peak at 470 nm absorption decreases. Absorption at 470 nm was measured every 30 s for 15 min upon introduction of the samples.
Transferrin stock solutions of 400lM were prepared by suspending
human transferrin (Sigma, St. Louis, Missouri, United States) in distilled water. Transferrin stock solutions were added at a final
concentration of 40lM to all samples. All absorption readings were
measured using a Cary 100 UV-Vis spectrophotometer (Varian). To measure lactate concentrations, bacteria were grown in 5 ml
(TSB) for 15 h at 378C with 180 rpm shaking. Lactate levels were
measured using a Lactate Assay Kit according to manufacturer’s recommendations (Department of Biochemistry at The State Uni-versity of New York at Buffalo). This kit measures the lactic acid– dependent production of formazan which exhibits an absorption maximum of 492 nm and is directly proportional to the concen-tration of lactate.
Supporting Information
Table S1.Master Table of All DIGE Profiling and MS Database Search Results
Found at DOI: 10.1371/journal.ppat.0020087.st001 (671 KB XLS).
Acknowledgments
We would like to thank members of the Skaar lab for critical reading of the manuscript and the Vanderbilt Academic Venture Capitol fund for Proteomics. We would also like to thank Dr. Dominique Missiakas for providing the Phoenix library derivatives.
Author contributions.DBF, DLS, GP, VJT, and EPS conceived and designed the experiments. DBF, DLS, GP, CWW, VJT, and EPS performed the experiments. DBF, DLS, CWW, VJT, and EPS analyzed the data. DBF, DLS, and EPS wrote the paper.
Funding. This research was enabled by Vanderbilt University Medical Center Development funds and U.S. Public Health Service grant AI69233 from the National Institute of Allergy and Infectious Diseases. VJT was supported by Ruth L. Kirschstein NRSA AI071487, and DLS was supported by T32 HL069765–05, from the National Institute of Allergy and Infectious Diseases.
Competing interests.The authors have declared that no competing interests exist.
References
1. Bullen JJ, Griffiths E (1999) Iron and infection: Molecular, physiological and clinical aspects. New York: John Wiley and Sons. 526 p.
2. Escolar L, Perez-Martin J, de Lorenzo V (1999) Opening the iron box: Transcriptional metalloregulation by the Fur protein. J Bacteriol 181: 6223–6229.
3. Dryla A, Gelbmann D, Von Gabain A, Nagy E (2003) Identification of a novel iron regulated staphylococcal surface protein with haptoglobin-haemoglobin binding activity. Mol Microbiol 49: 37–53.
4. Mazmanian SK, Skaar EP, Gaspar AH, Humayun M, Gornicki P, et al. (2003) Passage of heme-iron across the envelope ofStaphylococcus aureus. Science 299: 906–909.
5. Xiong A, Singh VK, Cabrera G, Jayaswal RK (2000) Molecular character-ization of the ferric-uptake regulator, fur, from Staphylococcus aureus. Microbiology 146 (Pt 3):: 659–668.
6. Horsburgh MJ, Ingham E, Foster SJ (2001) InStaphylococcus aureus, Fur is an interactive regulator with PerR, contributes to virulence, and is necessary for oxidative stress resistance through positive regulation of catalase and iron homeostasis. J Bacteriol 183: 468–475.
7. Alkema WB, Lenhard B, Wasserman WW (2004) Regulog analysis: Detection of conserved regulatory networks across bacteria: Application to Staph-ylococcus aureus. Genome Res 14: 1362–1373.
8. Skaar EP, Humayun M, Bae T, DeBord KL, Schneewind O (2004) Iron-source preference of Staphylococcus aureusinfections. Science 305: 1626– 1628.
9. Skaar EP, Schneewind O (2004) Iron-regulated surface determinants (Isd) ofStaphylococcus aureus: Stealing iron from heme. Microbes Infect 6: 390– 397.
10. Skaar EP, Gaspar AH, Schneewind O (2004) IsdG and IsdI, heme-degrading enzymes in the cytoplasm ofStaphylococcus aureus. J Biol Chem 279: 436–443. 11. Wu R, Skaar EP, Zhang R, Joachimiak G, Gornicki P, et al. (2005)
Staphylococcus aureusIsdG and IsdI, heme-degrading enzymes with structural similarity to monooxygenases. J Biol Chem 280: 2840–2846.
12. Gerbasi VR, Weaver CM, Hill S, Friedman DB, Link AJ (2004) Yeast Asc1p and mammalian RACK1 are functionally orthologous core 40S ribosomal proteins that repress gene expression. Mol Cell Biol 24: 8276–8287. 13. Alban A, David SO, Bjorkesten L, Andersson C, Sloge E, et al. (2003) A novel
experimental design for comparative two-dimensional gel analysis: Two-dimensional difference gel electrophoresis incorporating a pooled internal standard. Proteomics 3: 36–44.
14. Friedman DB, Hill S, Keller JW, Merchant NB, Levy SE, et al. (2004) Proteome analysis of human colon cancer by two-dimensional difference gel electrophoresis and mass spectrometry. Proteomics 4: 793–811. 15. Lilley KS, Friedman DB (2004) All about DIGE: Quantification technology
for differential-display 2D-gel proteomics. Exp Rev Proteomics 1: 401–409. 16. Dale SE, Doherty-Kirby A, Lajoie G, Heinrichs DE (2004) Role of siderophore biosynthesis in virulence ofStaphylococcus aureus: Identification and characterization of genes involved in production of a siderophore. Infect Immun 72: 29–37.
17. Sebulsky MT, Hohnstein D, Hunter MD, Heinrichs DE (2000) Identification and characterization of a membrane permease involved in iron-hydrox-amate transport inStaphylococcus aureus. J Bacteriol 182: 4394–4400. 18. Lee HW, Choe YH, Kim DK, Jung SY, Lee NG (2004) Proteomic analysis of a
ferric uptake regulator mutant of Helicobacter pylori: regulation of
Helicobacter pylori gene expression by ferric uptake regulator and iron. Proteomics 4: 2014–2027.
19. Mey AR, Wyckoff EE, Kanukurthy V, Fisher CR, Payne SM (2005) Iron and fur regulation inVibrio choleraeand the role of furin virulence. Infect Immun 73: 8167–8178.
20. Delany I, Rappuoli R, Scarlato V (2004) Fur functions as an activator and as a repressor of putative virulence genes in Neisseria meningitidis. Mol Microbiol 52: 1081–1090.
21. Masse E, Vanderpool CK, Gottesman S (2005) Effect of RyhB small RNA on global iron use inEscherichia coli. J Bacteriol 187: 6962–6971.
23. Baichoo N, Wang T, Ye R, Helmann JD (2002) Global analysis of theBacillus subtilisFur regulon and the iron starvation stimulon. Mol Microbiol 45: 1613–1629.
24. Somerville GA, Said-Salim B, Wickman JM, Raffel SJ, Kreiswirth BN, et al. (2003) Correlation of acetate catabolism and growth yield inStaphylococcus aureus: implications for host-pathogen interactions. Infect Immun 71: 4724–4732.
25. Fillinger S, Boschi-Muller S, Azza S, Dervyn E, Branlant G, et al. (2000) Two glyceraldehyde-3-phosphate dehydrogenases with opposite physiological roles in a nonphotosynthetic bacterium. J Biol Chem 275: 14031–14037. 26. Lindsay JA, Foster SJ (2001) zur: A Zn(2þ)-responsive regulatory element of
Staphylococcus aureus. Microbiology 147: 1259–1266.
27. Horsburgh MJ, Clements MO, Crossley H, Ingham E, Foster SJ (2001) PerR controls oxidative stress resistance and iron storage proteins and is required for virulence inStaphylococcus aureus. Infect Immun 69: 3744–3754. 28. Horsburgh MJ, Wharton SJ, Cox AG, Ingham E, Peacock S, et al. (2002) MntR modulates expression of the PerR regulon and superoxide resistance inStaphylococcus aureusthrough control of manganese uptake. Mol Micro-biol 44: 1269–1286.
29. Theodore TS, Schade AL (1965) Carbohydrate metabolism of iron-rich and iron-poorStaphylococcus aureus. J Gen Microbiol 40: 385–395.
30. Okada S, Rossmann MD, Brown EB (1978) The effect of acid pH and citrate on the release and exchange of iron on rat transferrin. Biochim Biophys Acta 543: 72–81.
31. Bibb LA, King ND, Kunkle CA, Schmitt MP (2005) Analysis of a heme-dependent signal transduction system in Corynebacterium diphtheriae: Deletion of thechrASgenes results in heme sensitivity and diminished heme-dependent activation of thehmuOpromoter. Infect Immun 73: 7406– 7412.
32. Kirby AE, Metzger DJ, Murphy ER, Connell TD (2001) Heme utilization in
Bordetella aviumis regulated by RhuI, a heme-responsive extracytoplasmic function sigma factor. Infect Immun 69: 6951–6961.
33. Vanderpool CK, Armstrong SK (2003) Heme-responsive transcriptional activation of Bordetellabhugenes. J Bacteriol 185: 909–917.
34. Giraudo AT, Cheung AL, Nagel R (1997) Thesae locus ofStaphylococcus aureus controls exoprotein synthesis at the transcriptional level. Arch Microbiol 168: 53–58.
35. Masse E, Gottesman S (2002) A small RNA regulates the expression of genes involved in iron metabolism inEscherichia coli. Proc Natl Acad Sci U S A 99: 4620–4625.
36. Wilderman PJ, Sowa NA, FitzGerald DJ, FitzGerald PC, Gottesman S, et al. (2004) Identification of tandem duplicate regulatory small RNAs in
Pseudomonas aeruginosainvolved in iron homeostasis. Proc Natl Acad Sci U S A 101: 9792–9797.
37. Davis BM, Quinones M, Pratt J, Ding Y, Waldor MK (2005) Characterization of the small untranslated RNA RyhB and its regulon inVibrio cholerae. J Bacteriol 187: 4005–4014.
38. Oglesby AG, Murphy ER, Iyer VR, Payne SM (2005) Fur regulates acid resistance inShigella flexneri viaRyhB and ydeP. Mol Microbiol 58: 1354– 1367.
39. Pichon C, Felden B (2005) Small RNA genes expressed fromStaphylococcus aureusgenomic and pathogenicity islands with specific expression among pathogenic strains. Proc Natl Acad Sci U S A 102: 14249–14254. 40. Somerville GA, Chaussee MS, Morgan CI, Fitzgerald JR, Dorward DW, et al.
(2002) Staphylococcus aureus aconitase inactivation unexpectedly inhibits post-exponential-phase growth and enhances stationary-phase survival. Infect Immun 70: 6373–6382.
41. Somerville GA, Cockayne A, Durr M, Peschel A, Otto M, et al. (2003) Synthesis and deformylation ofStaphylococcus aureusdelta-toxin are linked to tricarboxylic acid cycle activity. J Bacteriol 185: 6686–6694.
42. Cohen S, Sweeney HM, Leitner F (1967) Relation between iron uptake, pH of growth medium, and penicillinase formation inStaphylococcus aureus. J Bacteriol 93: 1227–1235.
43. Mazmanian SK, Ton-That H, Su K, Schneewind O (2002) An iron-regulated sortase anchors a class of surface protein during Staphylococcus aureus
pathogenesis. Proc Natl Acad Sci USA 99: 2293–2298.
44. Bae T, Banger AK, Wallace A, Glass EM, Aslund F, et al. (2004)Staphylococcus aureus virulence genes identified by bursa aurealis mutagenesis and nematode killing. Proc Natl Acad Sci U S A 101: 12312–12317.
45. Wessel D, Flugge UI (1984) A method for the quantitative recovery of protein in dilute solution in the presence of detergents and lipids. Anal Biochem 138: 141–143.
46. Friedman DB (2006) Quantitative proteomics for two-dimensional gels using difference gel electrophoresis (DIGE). In: Matthiesen R, editor. Mass spectrometry data analysis in proteomics. Totowa (New Jersey): Humana Press.