No 575 ISSN 0104-8910
The EU–Mercosul free trade agreement:
Quantifying mutual gains
German Calfat, Renato Galv ˜ao Fl ˆores Junior
Os artigos publicados são de inteira responsabilidade de seus autores. As opiniões
neles emitidas não exprimem, necessariamente, o ponto de vista da Fundação
THE EU-MERCOSUL FREE TRADE AGREEMENT: QUANTIFYING MUTUAL GAINS#
GERMAN CALFAT * RENATO G. FLÔRES JR.**
* Institute for Development Studies and Management (IOB), University of
Antwerp, Belgium.
** Graduate School of Economics (EPGE), Fundação Getulio Vargas, Rio de
Janeiro, Brazil.
Abstract
We identify trade in goods opportunities in a EU-Mercosul free trade area. Gains for Mercosul are
rather concentrated, being mostly associated to a few agricultural commodities nowadays facing high
protection barriers. EU gains are evenly spread, comprising a variety of market penetration
possibilities. Trade deviation by the EU products is never higher than trade creation, confirming their international competitiveness and signalling that a great distortion of Mercosul’s imports won’t take
place. Balanced gains exist for both sides; for Mercosul, the agreement can act as a first serious trial for
future liberalisations with other developed partners, and as a warning on needed competitiveness
improvements.
# The authors thank Ariel Barraud and Ramiro de Elejalde for invaluable research
THE EU-MERCOSUL FREE TRADE AGREEMENT: QUANTIFYING MUTUAL GAINS
Introduction
In the very year of its historical enlargement to the East, the European
Union (EU) sat, for the third time, at the negotiating table with Latin American
(LA) leaders, in the city of Guadalajara, Mexico. If it is undeniable that, after
each of the two past Cumbres – Rio, June 25-26; 1999 and Madrid, May 17-18;
2002 -, some progress has always been achieved, diplomats and agents from
both sides are still at odds in deepening a supposedly strategic partnership that
often reveals itself unable to move beyond sheer rhetoric.
Reasons for the impasses and disappointments are numerous, but surely
the diversity, in all aspects, of both regions and their different sets of priorities
can account for a large part of the relatively modest results achieved until now.
Economic motives, more than any others, have sometimes made the two parties
act faster, and close deals as the EU-Mexico Free Trade Agreement (Lisbon,
March 23; 2000) and the EU-Chile Association Agreement (Brussels,
November 26; 2002). It is no wonder that these treaties were the result of
negotiations with a single Latin American country, what considerably
simplified the agenda.
Another agreement has seen its proceedings linger on at least since
November 1999, when the EU-Mercosul Co-operation Council met in Brussels.
Truly, the stakes are higher in this case. The partner is a common market
initiative, actually – under a variety of aspects - the regional integration that
bears more affinities with the European project, and represents a rather sizeable
part of South America. Two big economies and large countries, Argentina and
systems in the continent: the Rio de la Plata basin, the Pantanal and (the largest
part of) the Amazon forest.
Fixing the EU-Mercosul Agreement would mark a turn in the EU-LA
relations, signalling that the two sides want and can deepen their relationship.
The economic and strategic importance of Mercosul and the historical times the
EU is now living add an extra international impact to this decision. But can
negotiators in both sides perceive this, and go beyond their minor
disagreements and limited concessions ?
The present study unveils potential gains, as relates to trade in goods
flows, supposing full liberalisation takes place. Instead of resorting to (the
always necessary) global evaluations, that produce aggregate figures useful at
certain, well-defined stages of the negotiations, we opted for a detailed
analysis, at the product level, in which the gains for specific agents become
clearer. As the next sections show, gains lie waiting, in both sides, for the
signing of the Agreement. They ran from reasonable to extremely attractive
and, especially for the EU, don’t look at all disruptive. The inability to realise
them will put businesses in a situation similar to the one at the time of the
Europe 92 Initiative, turning benefits into costs for not signing the Agreement.
The paper is organised as follows: in section 1 we discuss the
methodology and its limits, while section 2 offers a detailed view of the results.
A more encompassing perspective is adopted in section 3, while section 4
concludes.
1. The Limits of the Study.
We concentrate on the trade in goods aspect of the liberalisations
envisaged. Negotiations in course comprise also other areas, notably services
and government procurement. However, goods make for the basic flows in
international trade and act as a catalyst for other exchanges, specially services.
Moreover, those two additional issues are where more conflict exists, basically
Mercosul shows a rather defensive attitude. As a consequence, it is more
difficult to outline feasible liberalisation scenarios, not to say quantify them.
We worked with products at the six-digit level of the Harmonised System
(HS). Though the official offers from both sides are systematically made at the
eight-digit level, this was thought to produce an excessive level of detail,
blurring the impact of our main goal: to identify market access opportunities for
specific agents/firms in the two blocs. The six-digit level already conveys this
information to the local producers concerned.
Though we use standard trade-analytic tools, the way they are combined
makes for a somewhat novel methodology. The Annex explains in more detail,
with all main equations, the analytic tools and the steps required for arriving at
the final results. For interpreting the findings, it suffices to understand the
following:
Based on statistics for the recent trade flows we select, for each side,
products for which prospective gains lie with the agreement. Such possibility is
attributed to a product if it satisfies three requirements:
i) complementarity between one bloc as exporter and the other as importer;
ii) world comparative advantage (for the exporting bloc);
iii) the tariff equivalent the product faces at the importing bloc is equal or
superior to 10 per cent.
Informally, if the product “scores high” in the three dimensions above, it
qualifies for prospective gains with the agreement. Trade indexes are used for
assessing the first two requirements; as for the last one, we computed, in an
as-best-as-possible way, tariff equivalents to the barriers faced by the exports.
Ideally, these equivalent values include tariff and non-tariff barriers actually
practised by the two partners.
For each identified product, we produce a US dollar value that portrays the
market access gains. This “total value” results from adding up two effects, trade
creation and trade diversion, related, though not exactly, to the well-known
The first is, in the classical view, a positive thing: the lower barriers open
further the market for the (efficient) imported good. The second, still in the
classical view, is “less positive”: the product from the partner in the agreement,
though not the most efficient one, in world terms, becomes cheaper than the
alternatives and, due to this, increases its market share.
In our case, trade creation is obtained by the direct final-price-of-imports
effect, supposing an infinite elasticity of supply and that the only change in
imports is due to those from the partner. Trade diversion is computed assuming
that total imports remain constant, the preference, thanks to a substitution
effect, then causing some deviation in imports from outside the partner in
favour of it. An import price elasticity is needed to compute the former, and a
substitution elasticity for the latter. At the six-digit level, the two effects may
co-exist and this explains why both enter in the market gains. Though not
exactly reflecting the corresponding classical concepts, a very large trade
deviation relative to the creation may signal – if the elasticities used are correct
– that a true deviation will take place.
In order to check the robustness of our conclusions, we worked with two
base periods for the trade flows, 1997-1998 (the “golden years”) and
2000-2001 (the “crises years”)1. Simple averages of imports for the two periods were
the basis for the simulations. As regards product selection, there wasn’t much
difference between the two. We shall mainly discuss results for the 2000-2001
period, the corresponding calculations being thus allowed to be taken as
conservative.
Two scenarios were considered: i) a reduction of 50 per cent in the
ad-valorem tariff equivalent; ii) a reduction of 100 per cent in the ad-ad-valorem tariff
equivalent. Using these extreme, uniform concessions, gives a full grasp of
what the Agreement may bring forth, avoiding particular computations subject
to the vagaries of the successive offers.
Three different levels were used for the needed elasticities. A central value
taken from the “Tariff & Trade” Data Base, OECD (2003); and an upper and a
lower bound equal, respectively, to the central value multiplied and divided by
1.5.
The tariff equivalents were extracted with the help of the
UNCTAD/TRAINS database, several other sources, notably the previously
mentioned OECD (2003), having been of extreme usefulness.
The final dollar figures must not be taken at their precise, face value; their
main utility is in providing a ranking of the opportunities, pointing out the main
products to benefit from the agreement. Even so, they may be used as a first
guess on the actual revenues, if the reader keeps in mind the limitations of the
study.
The first limitation is that the whole work is, in technical terms, a partial
equilibrium evaluation. This means that, while analysing one product, all other
markets “are frozen”, the computation of the effects completely disregarding
any interaction the given product might have with the other segments of the
economy. In practice, preferential agreements trigger multiple interactions, with
different timings, and the partial equilibrium assumption is a (more or less)
crude approximation of the reality, Baldwin and Venables (1995), Flôres
(1996). However, the methodological alternative, computable general
equilibrium models, provides results at a rather aggregate level, and wouldn’t
be compatible with the purpose of this study.
There is no clear indication whether consideration of all relevant
interactions would produce higher or lower values than those under partial
equilibrium. A rough guess can be made from an informal evaluation of the
linkages the specific product bears in the bloc under examination. If it is tied to
“winning or neutral” products, actual gains may be even higher. In the opposite
case, gains may be inferior. In the absence of a minimally reliable informal
evaluation of this kind, the values here presented should be taken as an
(hopefully unbiased) average of positive and negative interactions.
The fact that each gain results from a partial equilibrium calculation
few words on both aggregate totals; numbers which consist in a rough, second
best estimate of a total trade in goods gain.
Another limitation is parameter values. Elasticities are needed for
computing the trade creation and diversion effects. As said, results were
obtained for three possible elasticity values: a lower, a central and an upper
figure. This also allowed us to check the sensibility of our findings 2.
Computation of tariff equivalents is always debatable; our experience
being that the final numbers usually underestimate the ultimate (tariff) effect of
all barriers. Many key products for the powerful Mercosul agribusiness face
either TRQ’s 3– making the equivalent a function of the particular year used –
or prohibitive escalating tariffs which, by highly restraining trade, place one at
the borderline of validity of the methodology adopted. In this regard, it
wouldn’t perhaps be unfair to say that our dollar totals are lower bounds to the
revenues due to liberalisation.
The third limitation is a warning that must be made. As explained,
products are identified with the help of indexes computed on the actual trade
flows. It might be that, for a specific sector, sure to gain with the agreement, no
results appear. Though we think that our final lists are pretty close, in product
content, to the key “winners”, this is possible. The reason would be that, for
some motive, the product, though competitive, has its flow (to the partner and
maybe to the world) strongly constrained. One of the most frequent motives for
this is, again, the existence of extremely high barriers – as happens in the EU
side –, making the actual flows negligible. In such case, the complementarity
and comparative advantage indexes will produce values not high enough for the
product to be selected.
2. Detailed Results.
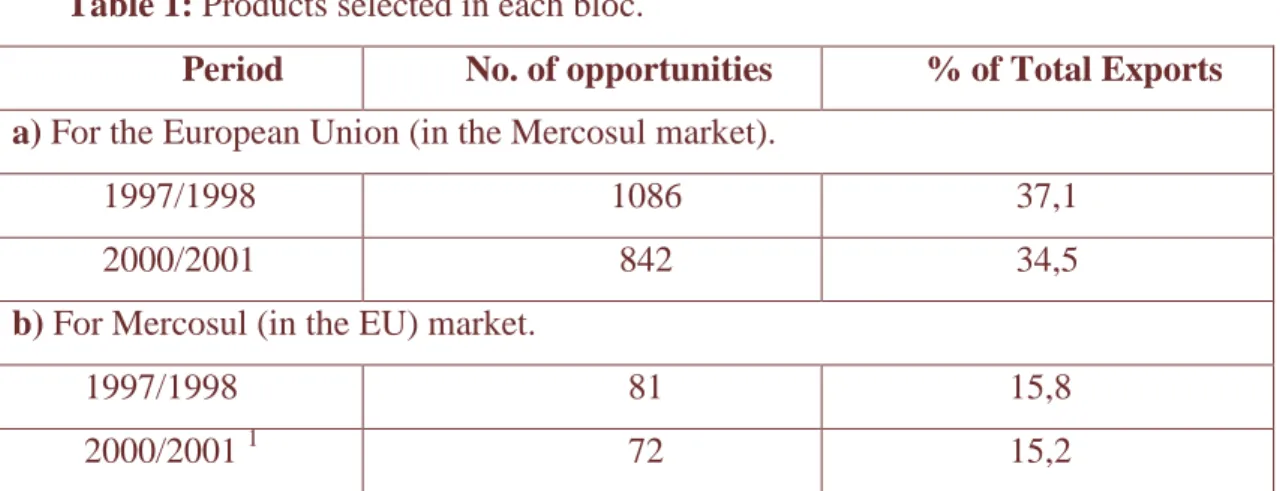
Table 1 summarises the total number of selected products for each bloc.
2 See Table 10, in section 3.
3 Tariff-rate Quotas are a device created by the EU to comply – at a minimal change – with requirements
---
Insert Table 1 by here
---
Market access simulations were performed for a subset of the products
exhibiting trade opportunities. In the case of the EU, out of the 842 selected in
2000-2001, a total of 100 products with potential trade expansion were used,
representing a share of 18,42 per cent of total EU exports to Mercosul. These
100 products were chosen as the most representative ones in terms of
opportunities, based on their generated total trade effects (trade creation and
trade diversion). All the 72 opportunities identified for Mercosul were
examined.
2.1. The EU gains.
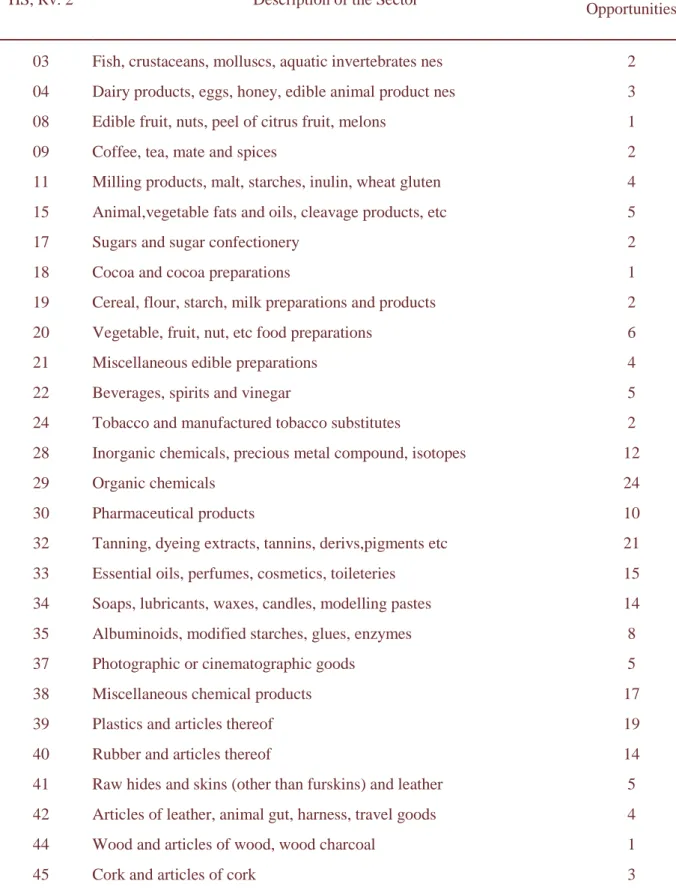
Table 2 details, at the two-digits level of the HS, the opportunities for the
EU, considering the 2000-2001 period. Their number is quite high and, if 239
out of the 842 products are in sector 84 (nuclear reactors, boilers, machinery,
etc), significant frequencies are found in sectors 85 (electrical, electronic
equipment), 90 (optical, photo, technical, medical, etc, apparatus), 48 (paper
and paperboard, articles of pulp, paper and board), 29 (organic chemicals), 73
(articles of iron or steel), 32 (tanning, dyeing extracts, tannins, derivs.,
pigments, etc), 39 (plastics and articles thereof) and 82 (tools, implements,
cutlery, etc, of base metal). Actually, in sixty-four out of the ninety-six sectors
in the HS, at least one product was selected. In the case of the golden years
period, though more opportunities were identified, 1 086, their frequency
distribution along the sectors is quite close to the previous one.
---
Insert Table 2 by here
The core of our results is a set of lists, ranked by total market access gains
(under full liberalisation of trade barriers), of all the indexes and computations
corresponding to the top 100 selected products. We shall discuss the values
obtained as the arithmetic average of the results with the three different
elasticities used 4.
Market access gains for this subset, now distributed along 24 two-digits
sectors, decrease very slowly in all cases. The top product (medicaments n.e.s.,
in dosage) presents, in 2000-2001 values, a 93,0 mi US$ gain; the one in the
hundredth position (mountings, fittings & similar articles of base metal for
furnitures) still displays a total gain of 4,8 mi US$, a value slightly superior to
1/20 of the top one. As a percentage of each product exports, the gains range
from 13 to 62 per cent; even the lowest bound is not a negligible figure. All this
calls attention to the variety of significant market penetration possibilities that
the Agreement may open to European exporters.
The added gains – under total liberalisation – amount to 1,20 bn US$.
Keeping in mind the remarks on the meaning of this sum, it turns out to be
around 6 per cent of current annual EU exports to Mercosul; something
attractive and not usually obtained in a standard preferential agreement5.
Moving to a fifty per cent reduction in the barriers, still produces a figure of
0,61 bn US$.
For all opportunities, the trade deviation figure is never higher than the
trade creation one. This is good news for both sides. For EU businesses, it
confirms their competitiveness in the international arena; for Mercosul, it
signals that the Agreement won’t imply a great distortion in its import flows.
Moreover, for quite many products, the deviation is much lower than the
creation – for eight of them, it is even around or smaller than 15 per cent of the
4 All the lists/figures produced (the average values, those related to the lower and upper bounds
for the elasticities, as well as those under a 50 per cent reduction in the trade barriers and the whole corresponding set for the 1997-1998 base period) are available from the authors.
5 It is maybe worth reminding that general equilibrium evaluations, even under imperfect
creation6. This means that, for many Mercosul markets, very likely the
Agreement does create trade, in the best classical sense of the concept.
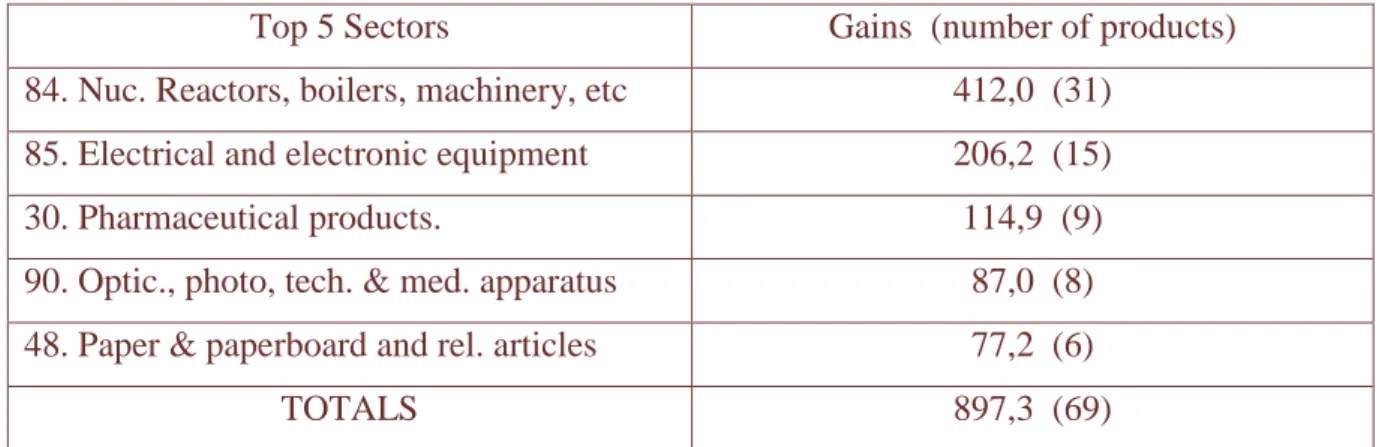
As mentioned above, two-digit sectors where more products were
identified aren’t necessarily those where the highest gains are found. Table 3,
another partial synthesis of the top 100 results, shows the five two-digit sectors
where the highest (aggregate) gains occur.
---
Insert Table 3 by here
---
At the aggregation level of the table, concentration is more evident. The
five sectors comprise 69 out of the 100 products, accounting for nearly 75 per
cent of the total gains. It is also worth noticing that the gains in the “machinery
and electrical & electronic equipment sectors” (84 and 85) amount to more than
half of the total gains.
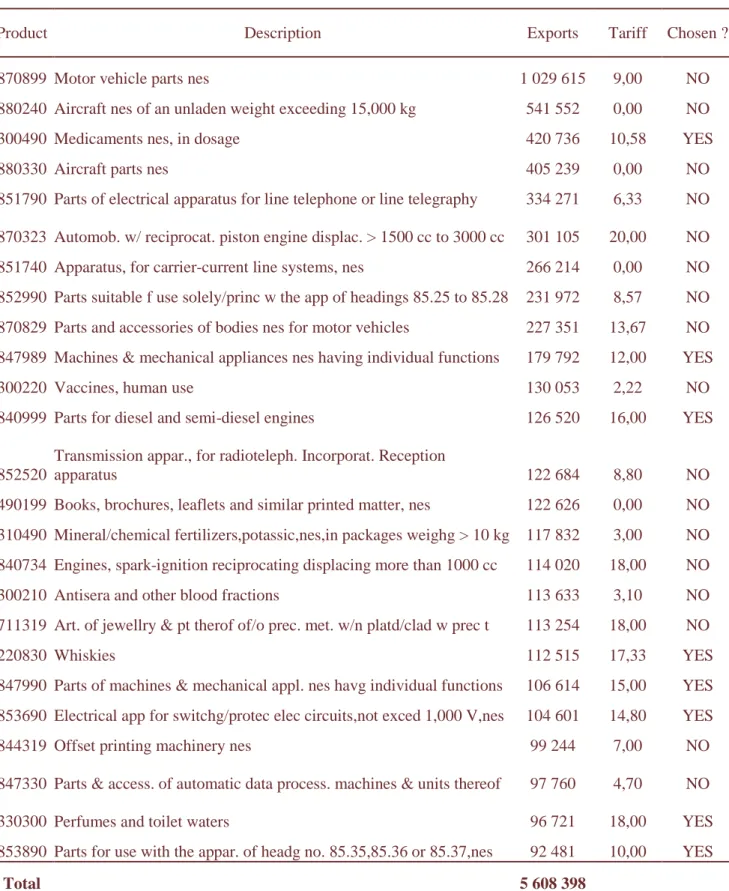
Table 4 provides a consistency check to the previous findings. Most
products in it – precisely 17 out of the 25 top EU exports - are already fully (or
close to) exploiting their possibilities. However, for 8 products, combination of
the tariff values with the European competitiveness still opens further
opportunities for them. Of these, 6 belong to sectors in Table 3 (three to 84, two
to 85 and one to 30), the “newcomers” being whiskies and perfume & toilet
waters. For these two, estimated gains are of 17,1 and 17,3 mi US$,
respectively, both higher than 15 per cent of the present flows.
---
Insert Table 4 by here
---
2.2. The Mercosul gains.
Table 5 shows, at the two-digits level of the HS, the frequency of
opportunities selected for Mercosur, considering the 2000-2001 period. The
number of sectors is much inferior than the one in Table 2; only 28, comprising
72 products. The highest frequencies are in sectors 02 (meat and edible meat
offal), 03 (fish, crustaceans, molluscs, aquatic invertebrates n.e.s.) and 20
(vegetable, fruit, nut, etc food preparations). Again, there isn’t much difference
from the 1997-1998 pattern, though the latter is a little more positive. The
predominance of the food and agriculture sectors is remarkable, followed by
traditional manufactures, notably textiles. In the more modern sectors, 7
products were identified, 5 being in chemical-related ones – 28 (inorganic
chemicals, precious metal compounds, isotopes), 29 (organic chemicals) and 35
(albuminoids, modified starches, glues, enzymes) – and two in the electrical,
electronic equipment sector 85.
As in the corresponding EU case, we shall mainly discuss the results
concerning the 72 opportunities identified for 2000-2001, under total
liberalisation, and obtained as the arithmetic average of those obtained with the
three different elasticity values 7.
Given the more limited scope of Mercosul flows, for the last 11 of the 72
products, the gain was negligible (smaller than 1000 US$). It is worth noticing
that, for only 17 of the 61 products with non-zero gains, trade creation is higher
than trade deviation, signalling that, as regards the Mercosul penetration, it is
likely to be more trade distorting than the EU one.
---
Insert Table 5 by here
---
The distribution of the gains for the winning products is quite
concentrated, the first three top goods – orange juice, bovine cuts boneless,
fresh or chilled and frozen - accounting for a little more than 50 per cent of the
which trade creation amounts to 16,7 mi US$, and the deviation is 0,4 mi US$.
total. If market access gains are extremely high for these products – 275,9 ;
234,8 and 219,6 mi US$ -, they are lower than 100 000 US$ from the fifty-fifth
product onwards. At this position, in the similar EU ranking, the corresponding
value is 7,4 mi US$. On the other hand, the sum of all gains under total
liberalisation amounts to 1,45 bn US$, a figure more than 10 per cent higher
than the one obtained for the top 100 EU opportunities. Actually, it represents
around 8 per cent of current annual exports; again something extremely
attractive for a standard preferential agreement. A fifty per cent reduction in the
barriers produces a figure of 0,74 bn US$.
In the Mercosul case, two-digit sectors where more products were
identified correspond somewhat better to those where the highest gains are
found. Table 6 shows the aggregate gain for the five top two-digit sectors
related to the 72 products. For the first two sectors, significant trade creation
takes place, confirming the well-known Mercosur competitiveness in these
areas. However, for the other three, evidence of distortions is present, the only
exception being anchovies (030563).
---
Insert Table 6 by here
---
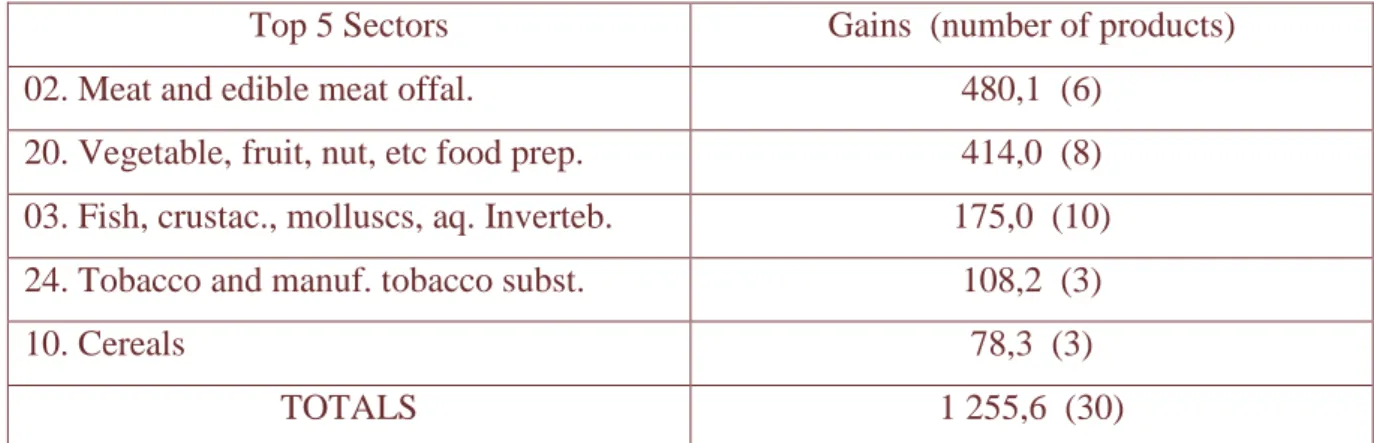
If one adds to the five sectors in Table 6 the next two ones – comprising
then, 37 out of the 72 products identified -, the total gain related to these seven
sectors is 1,38 mi US$, i.e., 95,2 per cent of the figure for the 72 products. No
wonder, the focus for Mercosur negotiators is quite clear and restricted.
Though modest, a global gain of 7,6 mi US$ in the four more advanced
sectors previously mentioned (28, 29, 35 and 85) raises hopes for their
development.
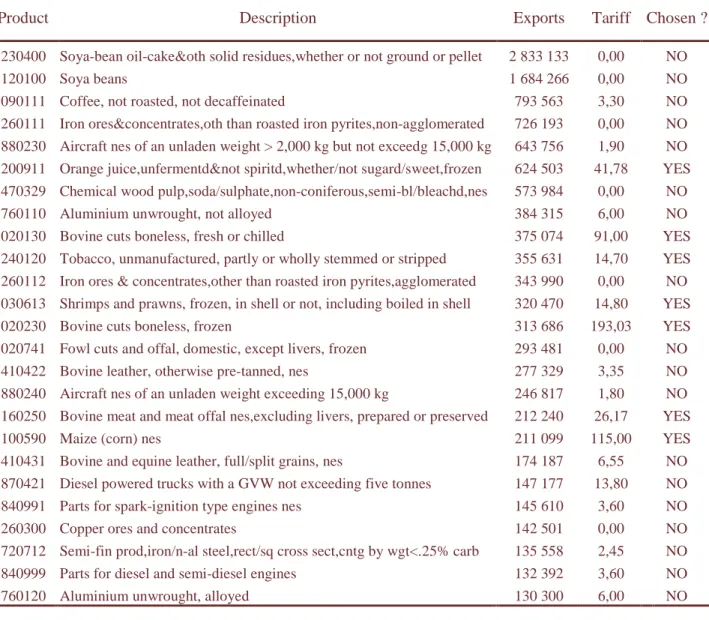
Table 7 provides additional consistency to the findings above. In a way
similar to the EU case (Table 4), 18 products seem to be already exploiting
However, in a dramatic demonstration of how key Mercosul interests are
concentrated in few markets, already penetrated by its goods, the seven
identified products are exactly the seven top ones in the total gains ranking.
---
Insert Table 7 by here
---
3. Results: A More General View.
Trade between the EU and Mercosul is more important for the latter, the
former accounting for around ¼ of either Mercosul imports or exports. Until
1994, the balance of trade was favourable to the Southern Cone, but since
1995 the situation has been reversed. Indeed, exports to the EU, after having
reached a peak in 1997-98, present a declining trend, while imports have been
less sensitive to the crises Mercosul experienced around 2000. Table 8 shows
the trade flows for the last half of the nineties, adding numerical support to
these considerations. The preferential agreement stands as an important way
to bring exchanges back to at least 1998 levels, boosting the flows from these
values up.
---
Insert Table 8 by here
---
A closer look at the structure of the trade flows reveals that Mercosul
exports are, much more than the EU ones, concentrated in a well-defined group
of products. Taking the 2000-2001 period, at the six-digit level, the 25 most
important Mercosul exports to the EU accounted for a little more than 60 per
produces 25 goods accounting for less than 27 per cent of total EU exports to
Mercosul8.
Mercosul barriers to EU goods give way to a higher (simple) average
equivalent tariff, with practically no peaks, but the opposite is true for the EU
barriers, where a significant number of peaks (high to very high tariff
equivalents) is present in a set for which the average tariff is reasonably low9.
The two points above are fundamental in explaining, in a global way, our
results. Mercosul gains should, consequently, be much more concentrated, with
their larger values associated to a few products which face the present peaks.
Most of these are, as expected, in the agricultural commodities and food
sectors. EU gains resulted more evenly spread, comprising a large portfolio of
diversified exports.
Table 9 and Figure 1 add further evidence to the above, confirming
remarks already made in section 3. The table shows the quartiles of the two
distributions of gains. Taking the third quartile (Q3), which is roughly the same
in both cases, the drastic fall below it and the steep rise after it, for Mercosul,
contrast with the much smoother European progression. The same statistics for
the sub-samples related to the upper quarter of gains complements the view on
Mercosul’s concentration.
---
Insert Table 9 by here
---
Figure 1 displays scatter diagrams of the trade diversion versus trade
creation values for both cases. While for the EU (Figure 1.b.) all points are
above the 45 degrees line, the opposite is most of the times true for Mercosul.
---
8See also Tables 5 and 7 in section 2. 9
Insert Figure 1by here
---
Finally, Table 10 gives an idea of the sensitivity of results. Elasticities do
matter, the intervals being quite large. In a rough approximation, their sizes are
around the order of magnitude of the lower bound; as the values discussed in
the text are close to the midpoints, this means that actual gains can be either 1/3
lower or higher.
---
Insert Table 10 by here
---
According to the last offers presented by both sides, concessions have a
timing and, of course, encompass – though perhaps not as much as the EU
desired – liberalisation or transparency measures in services and government
procurement, as well as stronger enforcement of selected intellectual property
rights issues. From the evidences produced in this paper, a crude estimate of a
lower bound for all the (long run) gains each community could then reap would
be around 1,5 bn US$ - something more or less, depending on the global
dynamics of the liberalisation.
4. Conclusions.
The European Union has continually stressed the theme of social cohesion
in its relations with Latin America. Mercosul, for obvious reasons, is entirely in
favour of this approach as a threading line for all its exchanges with the EU.
Notwithstanding, economic forces are the engine that sets integration in motion
and, eventually, makes societies come closer and share, in a consistent and
very European experience, since the Treaty of Rome till the May 1; 2004
Enlargement, is a telling illustration of this argument.
The economic motor is the combination of thousands, if not millions of
interactions, that progressively create the ties and set the bounds related to
different activities, ever designing a mesh of exchanges that unavoidably links
the economies involved.
In this vein, the EU-Mercosul Agreement, beyond a source of profits for
both partners, can be a concrete way of strengthening the EU-Mercosul
partnership. Great imbalances, in terms of the global gains it will open for the
case of trade in goods don’t seem to exist.
Signing of the Agreement will open a wide spectrum of opportunities for
the EU businesses. Many of these will ease the path for deeper services trade.
In the Mercosul side, its internationally competitive exporters will gain a
substantial and well-deserved market access in sectors where, though
constrained nowadays, they already are reasonably positioned.
For Mercosul, it is evident why its negotiators stick so toughly to
concessions in agriculture: most of its gains will come from there. But the
Agreement can also act as a first serious trial for future liberalisations with
other internationally competitive partners. It raises a warning on needed
competitiveness improvements in the industrial sectors, in a forthcoming freer
multilateral trading environment.
Annex: Methodological Aspects.
A.1. The Trade Complementarity and Related Indexes.
At the product level, opportunities are identified with the help of the following
indexes.
The Trade Complementarity Index (TCI) for product/good k, exported from
W k W j k j W k W i k i k ij M M M M M M X X
TCI = ⋅ , (1)
where,
k i
X = country i‘s exports of good k,
i
X = total exports of country i,
k j
M = country j ‘s imports of good k,
j
M = total imports from country j,
k W
M = world imports of good k,
W
M = total world imports.
The TCI measures the level of complementarity between the export supply and the
import demand structures of the two countries or regions; the greater this similarity,
the more likely trade between them is. Values greater (less) than 1 imply a strong
(weak) complementarity between the export specialisation of a country and the import
specialisation of its partner.
The TCI can be decomposed as the product of two well-known indexes: the
Revealed Comparative Advantage or Export Specialisation Index (RCA) of the
exporting country i and the Revealed Comparative Disadvantage or Import
Specialisation Index (RCD) of the importing country j, which, from (1), can be
expressed as: W k W i k i k i M M X X
RCA = , (2)
W k W j k j k j M M M M
RCD = . (3)
The RCA equals the ratio between the share of a product in a country’s total
exports and that of the same product in world trade; it roughly shows the export
export oriented in that particular good than the “world average” and, therefore, it
displays a revealed comparative advantage in that particular good.
Analogously, the RCD equals the ratio between the share of the product in a
country’s total imports and the corresponding share in world trade. When the import
specialisation index is greater than 1, the country reveals a comparative disadvantage
in that good.
Letting A stand for either Mercosul or the EU, and B for the other bloc, once A is
chosen, the three requirements for identifying opportunities for bloc A, stated in
section 2, can be rephrased as:
i) their TCI (as exports from A to B) is higher than 1;
ii) their RCA (as exports from A ) is higher than 1;
iii) the tariff equivalent they face in B is equal or superior to 10 per cent.
A2. The Simulation Model
Once the products are identified, a ranking of trade opportunities is produced. In
order to achieve this, we estimate the trade effects resulting from a reduction in the
tariff and non-tariff barriers – the ad valorem tariff equivalent – present in both
sides. The simulations are based in a model originally developed by Cline et. al.
(1978) and used, among others, by Laird and Yeats (1990) and Vaillant and Ons
(2002), to analyse the effects of either changes in trade preferences or unilateral
trade liberalisations.
The model assumes that the import demand function of country j for a good (k)
produced in country i may be expressed as10:
) , , ( j ji ij
ji F Y P P
M = , (4)
where Pji is the price of the good in the importing country j, or the final domestic
price of the good, Pij is the price of the good in the exporting country i (or the
export/world price of the good), and Yj is the national income in country j.
Country i ’s export supply function to country j may be written as:
) ( ij
ij F P
X = , (5)
ij
ji X
M = . (6)
The domestic price of the good in the importing market j can be expressed as the
product of the export price by the ad valorem equivalent tariff tji :
) 1 ( ji
ij
ji P t
P = + . (7)
The Trade-Creation Effect
is the increased demand in country j for the good exported by country i, resulting
from the price decrease associated to the reduction or elimination (in country j) of
the tariff equivalent tji, all imports from other destinations being frozen.
Using discrete rates of change (represented by∆) for the variables, from
equation (7) we can write:
ij ji ji
ij
ji P t t P
P = ∆ + + ∆
∆ 0 (1 1) (8)
where t1jiis the tariff applied after trade liberalisation, the superscripts accounting
for the periods before (0) and after liberalisation (1).
The formula for the elasticity of import demand with respect to the domestic
price, Em, can be rearranged as follows:
0 0 ji ji ji ji P P Em M M ∆ = ∆
. (9)
Obtaining, from (7) and (8), an expression for 0
ji ji
P P ∆
, and substituting it in (9),
gives, ∆ + + + + ∆ = ∆ 0 0 1 0 0 ) 1 ( ) 1 ( ) 1 ( ij ij ji ji ji ji ji ji P P t t t t Em M M
. (10)
From the expression for the elasticity of export supply, it follows that:
0 0 1 ij ij ij ij X X Ex P P ∆ = ∆
. (11)
Replacing this in (10) and remembering the equality 0 0 ij ij ji ji X X M M ∆ = ∆
, the
increase in imports becomes:
10
0 0 1 0 /(1 ) (1 ) 1 (1 ) ji ji ji ji ji ji t t
M M Em
t Em Ex t ∆ + ∆ = + − +
. (12)
Assuming that the elasticity of export supply with respect to the world price is
infinite, the value of trade creation can finally be expressed as:
0 0
0 (1 )
ji
ji ji ji ji
ji
t
TC M P V Em
t ∆
= ∆ =
+ , (13)
where Vij0 is the value of imports, and the only parameter needed to compute (13) is
the import demand elasticity Em .
The Trade Diversion Effect
refers to the tendency of importers to substitute trade flows from one source for
another, in response to a change in the import price of supplies from the latter.
Different options have been used to estimate trade diversion effects (see, for
instance, Baldwin and Murray (1977)); our method follows the proposal by Cline
et. al. (1978), which supposes that explicit values for the elasticities of substitution
between goods from different sources are available.
To generalise the trade diversion results, we assume that the importing country
offers preferential treatment to a group of countries (subscript B) and as a result of
this policy, imports from non-preference-receiving countries (subscript NB) are
being affected.
It is possible to define the elasticity of substitution between imports from B and
NB in the following manner:
) / ( ) / ( ) / ( ) / ( 0 0 0 0 jNB jB jNB jB jNB jB jNB jB P P P P M M M M Es ∆ ∆
= , (14)
whereMjB (MjNB) are defined as imports from the preference-receiving countries
country j of the good imported from the countries belonging to the preferential
agreement (non-preference receiving countries).
We define the share of bloc-countries (no bloc-countries) in total imports of
country j by φjB (φjNB) :
jW jB jB M M = φ , jW jNB jNB M M =
φ (15)
so that φjNB +φjB =1 .
The trade diversion effect can be written in the following way,
jW jB jB
jB M
TD =(φ1 −φ0 )
∆ . (16)
As total imports remain constant, i.e., MjW0 =M1jW =MjW , after some tedious
algebra, it is possible to obtain the following expression,
0 0 0 0 0 0 0 0 ) / ( ) / ( 1 ) / ( ) / ( jW jNB jB jNB jB jB jNB jB jNB jB jNB jB jB M P P P P Es P P P P Es TD ∆ + ∆ = ∆ φ φ
φ . (17)
Replacing the shares as defined in (15), we obtain,
0 0
0 0
0
0
0 0 0
( / )
( )
( / )
( / )
1 (1 )
( / )
jB jNB jB jB
jB jNB jB jB
jB jB jNB
jNB jB jNB
P P M P Es
P P TD P
M P P
Es
M P P
∆
∆ =
∆
+ +
. (18)
An estimate of the ratio between the two volumes of imports is then needed.
Moreover, the relative price (finite) difference appearing in (18) – known as the
price effect – is also needed. We then assume that the export supply elasticity of the
non-preference receiving countries is infinite; this means that the world price of the
products exported by the extra-bloc countries is kept fixed. Given that the tariff
levied on these extra-bloc countries by country j remains fixed, the domestic price of
domestic relative price B-NB is equal to the proportional change in the domestic
price PjB.
Taking the above into account, using the definitions for the import demand and
export supply elasticities, the market clearing condition, and a little algebra, it
follows that the price effect is,
) 1 ( 0 0 jB jB jB jB t t P P + ∆ = ∆
. (19)
By way of (19), and supposing that PjB0 =PjNB0 , (18) finally becomes:
0 0 0 0 0 0 (1 )
1 (1 )
(1 ) jB jB jB jB jB jB jB jNB jB t V Es t TD P V t Es V t ∆ + ∆ = ∆ + + +
, (20)
where the V’s stand for the volume of imports (in money values) and, as in (13), the
only needed parameter is an elasticity, now the substitution elasticity Es.
.
References
Abbott, P. C. (2002) ‘Tariff-rate Quotas: Failed Market Access Instruments ?’.
European Journal of Agricultural Economics, Vol. 29 (1), pp. 109-30.
Baldwin, R. and Venables, A. J. (1995) ‘Regional Economic Integration’. In
Grossman, G. and Rogoff, K. (eds.) Handbook of International
Economics, vol. III (Amsterdam: North Holland).
Baldwin, R. E. and Murray, T. (1977) ‘MFN Tariff Reduction and Developing
Countries Trade Benefits under the GSP’. Economic Journal, Vol. 87, pp.
Cline, W., Kawanabe, N., Kronsjo, T.O.M. and Williams, T. (1978) Trade
Negotiations in the Tokyo Round: A Quantitative Assessment
(Washington: The Brookings Institution).
Flôres, R. G., Jr. (1996) ‘A Avaliação do Impacto das Integrações Regionais’.
Temas de Integração, Vol. 1, pp. 51-61.
Laird, S. and Yeats, A. (1990) Quantitative Methods for Trade Barrier Analysis
(London: Macmillan Press).
OECD (2003). CD ROM Tariffs and Trade: OECD Query and Simulation
Package (Paris: Organisation for Economic Co-operation and Development).
Vaillant, M, and Ons, A. (2001) ‘Preferential Trading Arrangements Between
the European Union and South America: The Political Economy of Free
Table 1: Products selected in each bloc.
Period No. of opportunities % of Total Exports a) For the European Union (in the Mercosul market).
1997/1998 1086 37,1
2000/2001 842 34,5
b) For Mercosul (in the EU) market.
1997/1998 81 15,8
2000/2001 1 72 15,2
1
Table 2 : EU - MERCOSUL Agreement; Frequency of Opportunities for the EU, by (two-digits) sectors of the Harmonised System. Period 2000-2001.
HS, Rv. 2 Description of the Sector Number of
Opportunities
03 Fish, crustaceans, molluscs, aquatic invertebrates nes 2
04 Dairy products, eggs, honey, edible animal product nes 3
08 Edible fruit, nuts, peel of citrus fruit, melons 1
09 Coffee, tea, mate and spices 2
11 Milling products, malt, starches, inulin, wheat gluten 4
15 Animal,vegetable fats and oils, cleavage products, etc 5
17 Sugars and sugar confectionery 2
18 Cocoa and cocoa preparations 1
19 Cereal, flour, starch, milk preparations and products 2
20 Vegetable, fruit, nut, etc food preparations 6
21 Miscellaneous edible preparations 4
22 Beverages, spirits and vinegar 5
24 Tobacco and manufactured tobacco substitutes 2
28 Inorganic chemicals, precious metal compound, isotopes 12
29 Organic chemicals 24
30 Pharmaceutical products 10
32 Tanning, dyeing extracts, tannins, derivs,pigments etc 21
33 Essential oils, perfumes, cosmetics, toileteries 15
34 Soaps, lubricants, waxes, candles, modelling pastes 14
35 Albuminoids, modified starches, glues, enzymes 8
37 Photographic or cinematographic goods 5
38 Miscellaneous chemical products 17
39 Plastics and articles thereof 19
40 Rubber and articles thereof 14
41 Raw hides and skins (other than furskins) and leather 5
42 Articles of leather, animal gut, harness, travel goods 4
44 Wood and articles of wood, wood charcoal 1
48 Paper & paperboard, articles of pulp, paper and board 26
49 Printed books, newspapers, pictures etc 1
51 Wool, animal hair, horsehair yarn and fabric thereof 1
52 Cotton 14
54 Manmade filaments 11
55 Manmade staple fibres 12
56 Wadding, felt, nonwovens, yarns, twine, cordage, etc 7
57 Carpets and other textile floor coverings 2
58 Special woven or tufted fabric, lace, tapestry etc 7
59 Impregnated, coated or laminated textile fabric 12
60 Knitted or crocheted fabric 1
61 Articles of apparel, accessories, knit or crochet 8
62 Articles of apparel, accessories, not knit or crochet 10
63 Other made textile articles, sets, worn clothing etc 5
64 Footwear, gaiters and the like, parts thereof 2
68 Stone, plaster, cement, asbestos, mica, etc articles 3
69 Ceramic products 5
70 Glass and glassware 12
71 Pearls, precious stones, metals, coins, etc 6
72 Iron and steel 11
73 Articles of iron or steel 23
74 Copper and articles thereof 5
75 Nickel and articles thereof 5
76 Aluminium and articles thereof 2
82 Tools, implements, cutlery, etc of base metal 19
83 Miscellaneous articles of base metal 9
84 Nuclear reactors, boilers, machinery, etc 239
85 Electrical, electronic equipment 69
86 Railway, tramway locomotives, rolling stock, equipment 9
87 Vehicles other than railway, tramway 12
89 Ships, boats and other floating structures 8
90 Optical, photo, technical, medical, etc apparatus 47
91 Clocks and watches and parts thereof 3
93 Arms and ammunition, parts and accessories thereof 7
94 Furniture, lighting, signs, prefabricated buildings 4
96 Miscellaneous manufactured articles 9
TOTAL 842
Table 3: EU gains* (in million, 2000-2001, US$) in the top two-digits sectors related to the 100 most important products, under total trade liberalisation.
Top 5 Sectors Gains (number of products)
84. Nuc. Reactors, boilers, machinery, etc 412,0 (31)
85. Electrical and electronic equipment 206,2 (15)
30. Pharmaceutical products. 114,9 (9)
90. Optic., photo, tech. & med. apparatus 87,0 (8)
48. Paper & paperboard and rel. articles 77,2 (6)
TOTALS 897,3 (69)
Table 4: Selected Characteristics and Opportunities Among the 25 Top EU Exports to Mercosul. Period 2000-2001; Exports in 1000 US$.
Product Description Exports Tariff Chosen ?
870899 Motor vehicle parts nes 1 029 615 9,00 NO
880240 Aircraft nes of an unladen weight exceeding 15,000 kg 541 552 0,00 NO
300490 Medicaments nes, in dosage 420 736 10,58 YES
880330 Aircraft parts nes 405 239 0,00 NO
851790 Parts of electrical apparatus for line telephone or line telegraphy 334 271 6,33 NO
870323 Automob. w/ reciprocat. piston engine displac. > 1500 cc to 3000 cc 301 105 20,00 NO
851740 Apparatus, for carrier-current line systems, nes 266 214 0,00 NO
852990 Parts suitable f use solely/princ w the app of headings 85.25 to 85.28 231 972 8,57 NO
870829 Parts and accessories of bodies nes for motor vehicles 227 351 13,67 NO
847989 Machines & mechanical appliances nes having individual functions 179 792 12,00 YES
300220 Vaccines, human use 130 053 2,22 NO
840999 Parts for diesel and semi-diesel engines 126 520 16,00 YES
852520
Transmission appar., for radioteleph. Incorporat. Reception
apparatus 122 684 8,80 NO
490199 Books, brochures, leaflets and similar printed matter, nes 122 626 0,00 NO
310490 Mineral/chemical fertilizers,potassic,nes,in packages weighg > 10 kg 117 832 3,00 NO
840734 Engines, spark-ignition reciprocating displacing more than 1000 cc 114 020 18,00 NO
300210 Antisera and other blood fractions 113 633 3,10 NO
711319 Art. of jewellry & pt therof of/o prec. met. w/n platd/clad w prec t 113 254 18,00 NO
220830 Whiskies 112 515 17,33 YES
847990 Parts of machines & mechanical appl. nes havg individual functions 106 614 15,00 YES
853690 Electrical app for switchg/protec elec circuits,not exced 1,000 V,nes 104 601 14,80 YES
844319 Offset printing machinery nes 99 244 7,00 NO
847330 Parts & access. of automatic data process. machines & units thereof 97 760 4,70 NO
330300 Perfumes and toilet waters 96 721 18,00 YES
853890 Parts for use with the appar. of headg no. 85.35,85.36 or 85.37,nes 92 481 10,00 YES
Table 5: EU - MERCOSUL Agreement; Frequency of Opportunities for Mercosur, by (two-digits) sectors of the Harmonised System. Period 2000-2001.
HS, Rev 2 Description of the Sector Number of
Opportunities
02 Meat and edible meat offal 6
03 Fish, crustaceans, molluscs, aquatic invertebrates nes 10
04 Dairy products, eggs, honey, edible animal product nes 1
07 Edible vegetables and certain roots and tubers 1
08 Edible fruit, nuts, peel of citrus fruit, melons 5
09 Coffee, tea, mate and spices 1
10 Cereals 3
11 Milling products, malt, starches, inulin, wheat gluten 2
16 Meat, fish and seafood food preparations nes 2
17 Sugars and sugar confectionery 2
18 Cocoa and cocoa preparations 2
19 Cereal, flour, starch, milk preparations and products 1
20 Vegetable, fruit, nut, etc food preparations 8
21 Miscellaneous edible preparations 1
22 Beverages, spirits and vinegar 1
24 Tobacco and manufactured tobacco substitutes 3
28 Inorganic chemicals, precious metal compound, isotopes 1
29 Organic chemicals 3
35 Albuminoids, modified starches, glues, enzymes 1
56 Wadding, felt, nonwovens, yarns, twine, cordage, etc 3
60 Knitted or crocheted fabric 1
61 Articles of apparel, accessories, knit or crochet 1
62 Articles of apparel, accessories, not knit or crochet 2
63 Other made textile articles, sets, worn clothing etc 4
64 Footwear, gaiters and the like, parts thereof 2
70 Glass and glassware 1
82 Tools, implements, cutlery, etc of base metal 2
85 Electrical, electronic equipment 2
Table 6: Mercosul gains* (in million, 2000-2001, US$) in the top two-digits sectors related to the 72 products, under total trade liberalisation.
Top 5 Sectors Gains (number of products)
02. Meat and edible meat offal. 480,1 (6)
20. Vegetable, fruit, nut, etc food prep. 414,0 (8)
03. Fish, crustac., molluscs, aq. Inverteb. 175,0 (10)
24. Tobacco and manuf. tobacco subst. 108,2 (3)
10. Cereals 78,3 (3)
TOTALS 1 255,6 (30)
Table 7: Selected Characteristics and Opportunities Among the 25 Top Mercosul Exports to the EU. Period 2000-2001; Exports in US$.
Product Description Exports Tariff Chosen ?
230400 Soya-bean oil-cake&oth solid residues,whether or not ground or pellet 2 833 133 0,00 NO
120100 Soya beans 1 684 266 0,00 NO
090111 Coffee, not roasted, not decaffeinated 793 563 3,30 NO
260111 Iron ores&concentrates,oth than roasted iron pyrites,non-agglomerated 726 193 0,00 NO
880230 Aircraft nes of an unladen weight > 2,000 kg but not exceedg 15,000 kg 643 756 1,90 NO
200911 Orange juice,unfermentd¬ spiritd,whether/not sugard/sweet,frozen 624 503 41,78 YES
470329 Chemical wood pulp,soda/sulphate,non-coniferous,semi-bl/bleachd,nes 573 984 0,00 NO
760110 Aluminium unwrought, not alloyed 384 315 6,00 NO
020130 Bovine cuts boneless, fresh or chilled 375 074 91,00 YES
240120 Tobacco, unmanufactured, partly or wholly stemmed or stripped 355 631 14,70 YES
260112 Iron ores & concentrates,other than roasted iron pyrites,agglomerated 343 990 0,00 NO
030613 Shrimps and prawns, frozen, in shell or not, including boiled in shell 320 470 14,80 YES
020230 Bovine cuts boneless, frozen 313 686 193,03 YES
020741 Fowl cuts and offal, domestic, except livers, frozen 293 481 0,00 NO
410422 Bovine leather, otherwise pre-tanned, nes 277 329 3,35 NO
880240 Aircraft nes of an unladen weight exceeding 15,000 kg 246 817 1,80 NO
160250 Bovine meat and meat offal nes,excluding livers, prepared or preserved 212 240 26,17 YES
100590 Maize (corn) nes 211 099 115,00 YES
410431 Bovine and equine leather, full/split grains, nes 174 187 6,55 NO
870421 Diesel powered trucks with a GVW not exceeding five tonnes 147 177 13,80 NO
840991 Parts for spark-ignition type engines nes 145 610 3,60 NO
260300 Copper ores and concentrates 142 501 0,00 NO
720712 Semi-fin prod,iron/n-al steel,rect/sq cross sect,cntg by wgt<.25% carb 135 558 2,45 NO
840999 Parts for diesel and semi-diesel engines 132 392 3,60 NO
760120 Aluminium unwrought, alloyed 130 300 6,00 NO
Total 12 221 249
Table 8: Mercosul trade flows (in billion US$) with the EU, 1996-2000.
1996 1997 1998 1999 2000
Exports 18,3 19,5 20,1 19,2 17,3
Imports 21,9 25,7 26,5 22,9 18,9
Total trade 40,2 45,2 46,6 42,1 36,2
Table 9: Quartiles of the distribution of gains, EU and Mercosul.
Quartiles Mercosul1 EU2 a) For all computed gains.
Min 0 4 809
Q1 233 6 042
Median 1 614 7 774
Q3 11 512 12 270
Max 275 877 92 975
b) For the higher quarter.
Min 13 007 12 307
Q1 16 516 13 963
Median 23 055 21 596
Q3 101 812 25 267
Max 275 877 92 975
1
72 observations/products; 2 100 observations/products.
Table 10: Lower and upper bounds1 for the five top gains, EU and Mercosul.
Order of the gains Mercosul EU
Top 178 198 ; 386 608 59 274 ; 131 304
2nd top 152 148 ; 328 447 32 718 ; 71 757
3rd top 140 811 ; 309 428 29 905 ; 65 980
4th top 77 371 ; 170 639 25 266 ; 55 726
5th top 71 457 ; 148 241 22 507 ; 49 704
1
Figure 1: Trade Creation x Trade Deviation 1.a: Mercosul.
0,00 10000,00 20000,00 30000,00 40000,00 50000,00 60000,00 70000,00 80000,00
0,00 10000,00 20000,00 30000,00 40000,00 50000,00 60000,00 70000,00 80000,00
creation
d
e
v
ia
ti
o
1.b: EU
0 5000 10000 15000 20000 25000 30000 35000
0 10000 20000 30000 40000 50000 60000 70000
creation
d
e
v
ia
ti
o
´
Ultimos Ensaios Econˆomicos da EPGE
[548] Samuel de Abreu Pessˆoa, Pedro Cavalcanti Gomes Ferreira, e Fernando A. Ve-loso. The evolution of international output differences (1960–2000): From fac-tors to productivity. Ensaios Econˆomicos da EPGE 548, EPGE–FGV, Jun 2004.
[549] M´arcio Antˆonio Salvato, F´abio Augusto Reis Gomes, e Jo˜ao Victor Issler. Prin-cipais caracter´ısticas do consumo de dur´aveis no Brasil testes de separabilidade entre dur´aveis e n˜ao–dur´aveis. Ensaios Econˆomicos da EPGE 549, EPGE–FGV, Jun 2004.
[550] Jo˜ao Victor Issler e Rachel Couto Ferreira. Avaliando pesquisadores e depar-tamentos de economia no Brasil a partir de citac¸˜oes internacionais. Ensaios Econˆomicos da EPGE 550, EPGE–FGV, Jun 2004.
[551] Humberto Luiz Ataide Moreira e David Martimort.Common agency with infor-med principals. Ensaios Econˆomicos da EPGE 551, EPGE–FGV, Jun 2004.
[552] Luiz Renato Regis de Oliveira Lima e Zhijie Xiao. Purchasing power parity and the unit root tests: A robust analysis. Ensaios Econˆomicos da EPGE 552, EPGE–FGV, Jul 2004.
[553] Daniel Gottlieb, Aloisio Pessoa de Ara´ujo, e Humberto Luiz Ataide Moreira.
A model of mixed signals with applications to countersignaling an the GED. Ensaios Econˆomicos da EPGE 553, EPGE–FGV, Jul 2004.
[554] Lucas J´over Maestri e Carlos Eugˆenio Ellery Lustosa da Costa. The risk– properties of human capital and the design of government policies. Ensaios Econˆomicos da EPGE 554, EPGE–FGV, Jul 2004.
[555] Daniel Gottlieb e Lucas J´over Maestri. Banning information as a redistributive device. Ensaios Econˆomicos da EPGE 555, EPGE–FGV, Jul 2004.
[556] Leonardo Pio Perez e Pedro Cavalcanti Gomes Ferreira. Efeitos macroe-conˆomicos e custos sociais de uma transic¸˜ao entre regimes de previdˆencia no Brasil. Ensaios Econˆomicos da EPGE 556, EPGE–FGV, Jul 2004.
[557] Rubens Penha Cysne. Inflation and income inequality: A link through the job– search process. Ensaios Econˆomicos da EPGE 557, EPGE–FGV, Ago 2004.
[558] Rubens Penha Cysne. A search–theoretic explanation for the negative correla-tion between labor income and impatience. Ensaios Econˆomicos da EPGE 558, EPGE–FGV, Ago 2004.
[560] Rubens Penha Cysne. Towards a measure of income inequality freed from the volatility caused by variations in the rate of unemployment. Ensaios Econˆomicos da EPGE 560, EPGE–FGV, Ago 2004.
[561] Rubens Penha Cysne.On the positive correlation between income inequality and unemployment. Ensaios Econˆomicos da EPGE 561, EPGE–FGV, Ago 2004.
[562] Rubens Penha Cysne. A general–equilibrium closed–form solution to the wel-fare costs of inflation (Forthcoming, Revista Brasileira de Economia). Ensaios Econˆomicos da EPGE 562, EPGE–FGV, Ago 2004.
[563] Marcelo Cˆortes Neri e Marcelo Casal Xerez.Aspectos dinˆamicos de um sistema de metas sociais. Ensaios Econˆomicos da EPGE 563, EPGE–FGV, Ago 2004.
[565] Marcelo Cˆortes Neri e Marcelo Casal Xerez. Desenho de um sistema de metas sociais. Ensaios Econˆomicos da EPGE 565, EPGE–FGV, Set 2004.
[566] Paulo Klinger Monteiro, Rubens Penha Cysne, e Wilfredo Maldonado.Inflation and Income Inequality: A Shopping–Time Aproach (Forthcoming, Journal of Development Economics). Ensaios Econˆomicos da EPGE 566, EPGE–FGV, Set 2004.
[567] Rubens Penha Cysne. Solving the Non–Convexity Problem in Some Shopping– Time and Human–Capital Models. Ensaios Econˆomicos da EPGE 567, EPGE– FGV, Set 2004.
[568] Paulo Klinger Monteiro.First–Price auction symmetric equlibria with a general distribution. Ensaios Econˆomicos da EPGE 568, EPGE–FGV, Set 2004.
[569] Samuel de Abreu Pessˆoa, Fernando A. Veloso, e Pedro Cavalcanti Ferreira. On The Tyranny of Numbers: East Asian Miracles in World Perspective. Ensaios Econˆomicos da EPGE 569, EPGE–FGV, Out 2004.
[570] Rubens Penha Cysne. On the Statistical Estimation of Diffusion Processes – A Partial Survey (Revised Version, Forthcoming Brazilian Review of Econome-trics). Ensaios Econˆomicos da EPGE 570, EPGE–FGV, Out 2004.
[571] Aloisio Pessoa de Ara´ujo, Humberto Luiz Ataide Moreira, e Luciano I. de Cas-tro Filho.Pure strategy equilibria of multidimensional and Non–monotonic auc-tions. Ensaios Econˆomicos da EPGE 571, EPGE–FGV, Nov 2004.
[572] Paulo C´esar Coimbra Lisbˆoa e Rubens Penha Cysne. Imposto Inflacion´ario e Transferˆencias Inflacion´arias no Mercosul e nos Estados Unidos. Ensaios Econˆomicos da EPGE 572, EPGE–FGV, Nov 2004.