Establishing a Wild, Ex Situ Population of a
Critically Endangered Shade-Tolerant
Rainforest Conifer: A Translocation
Experiment
Heidi C. Zimmer1*, Catherine A. Offord2, Tony D. Auld3,4, Patrick J. Baker1
1School of Ecosystem and Forest Sciences, University of Melbourne, Richmond, Victoria, Australia,2The Australian PlantBank, Royal Botanic Gardens and Domain Trust, The Australian Botanic Garden, Mount Annan, New South Wales, Australia,3Office of Environment and Heritage NSW, Hurstville, New South Wales, Australia,4Centre for Ecosystem Science, University of New South Wales, Sydney, Australia
Abstract
Translocation can reduce extinction risk by increasing population size and geographic range, and is increasingly being used in the management of rare and threatened plant species. A critical determinant of successful plant establishment is light environment. Wol-lemia nobilis(Wollemi pine) is a critically endangered conifer, with a wild population of 83 mature trees and a highly restricted distribution of less than 10 km2. We used under-plant-ing to establish a population ofW.nobilisin a new rainforest site. Because its optimal establishment conditions were unknown, we conducted an experimental translocation, planting in a range of different light conditions from deeply shaded to high light gaps. Two years after the experimental translocation, 85% of plants had survived. There were two distinct responses: very high survival (94%) but very low growth, and lower survival (69%) and higher growth, associated with initial plant condition. Overall survival of translocated
W.nobiliswas strongly increased in planting sites with higher light, in contrast to previous studies demonstrating long-term survival of wildW.nobilisjuveniles in deep shade. Trans-location by under-planting may be useful in establishing new populations of shade-toler-ant plshade-toler-ant species, not least by utilizing the range of light conditions that occur in forest understories.
Introduction
Extinction risk for a species is determined by two key traits: population size and geographic range [1]. Translocation, the intentional movement of an organism from one place to another [2], can reduce the risk of extinction in the wild by increasing a species geographic range and
population size [3–5]. Translocation is increasingly being used to reduce extinction risk in
rare and threatened plants [6,7], with the long-term aim that translocated individuals become a11111
OPEN ACCESS
Citation:Zimmer HC, Offord CA, Auld TD, Baker PJ (2016) Establishing a Wild, Ex Situ Population of a Critically Endangered Shade-Tolerant Rainforest Conifer: A Translocation Experiment. PLoS ONE 11(7): e0157559. doi:10.1371/journal.pone.0157559
Editor:Sylvain Delzon, INRA - University of Bordeaux, FRANCE
Received:January 29, 2016
Accepted:June 1, 2016
Published:July 12, 2016
Copyright:© 2016 Zimmer et al. This is an open access article distributed under the terms of the
Creative Commons Attribution License, which permits
unrestricted use, distribution, and reproduction in any medium, provided the original author and source are credited.
Data Availability Statement:All relevant data are within the paper and its Supporting Information files.
Funding:PJB was supported by an Australian Research Council Future Fellowship (FT120100715). HCZ’s doctoral research is funded by an Australian Postgraduate Award and the Wollemi Pine Recovery Team. The funders had no role in study design, data collection and analysis, decision to publish, or preparation of the manuscript.
established and produce seedlings of their own [6]. However, optimal conditions for establish-ment of rare and threatened plants are often poorly known [8].
For forest trees, a critical determinant of successful establishment is light environment [9]. The life history strategies of forest trees range from species with seedlings that require high light to survive and grow, and have high maximum growth rates (shade-intolerant species), to species with seedlings that can recruit in deep shade and have slower maximum growth rates (shade-tolerant species) [9,10]. Protection from direct sunlight, as well as the milder tempera-ture and moistempera-ture conditions afforded by the understory, is crucial for the successful
establish-ment of shade-tolerant species [11–14]. Under-planting has been primarily developed as a
strategy for promoting regeneration of shade-tolerant species that are valued for their timber, such as oak in temperate deciduous forests USA [15,16], spruce in boreal regions in Canada [17] and Sweden [18], shade-tolerant conifer species in coastal temperate rainforest in Canada and the USA [19,20], and for reintroduction of high-value commercial species into degraded forests tropical Americas and Asia [21,22]. The silvicultural theory associated with under-planting for timber production can be applied in species translocation.
Here we report on an experimental translocation (with the aim of informing future
translo-cations,sensu[23–25]) ofWollemia nobilis(Araucariaceae), a critically endangered,
shade-tol-erant rainforest conifer [26]. Fewer than 100 mature and 100–200 juveniles ofW.nobilisexist
in the wild, in a warm temperate rainforest community in the sandstone canyon landscape of Wollemi National Park in southeastern Australia [27]. Location information for the wild
popu-lation ofW.nobilisis confidential and protected by law [28]. No genetic variation has been
detected inW.nobilis; genetic analysis revealed no polymorphism at 13 allozyme loci, more
than 800 amplified fragment length polymorphism loci or 20 simple sequence repeat loci [29].
Trees 2–20 m tall are scarce, suggesting a serious bottleneck in recruitment from the seedling
to mature stage [30]. The viability ofW.nobilisseed is low (~10%; [31]) and seed dispersal is
limited—no seedlings have been found>50 m from mature trees. Of those seeds that do
germi-nate, subsequent establishment is also limited, although once established, juveniles can survive
in the deep shade for 16 years (and potentially longer) growing very slowly (<2 cm/yr in
height) [30]. The optimal conditions forW.nobilisestablishment are unknown [30]. The small
wild population and highly restricted distribution ofW.nobilishave contributed to its
classifi-cation as critically endangered, with the high risk of extinction due to a single event. For this
reason, translocation ofW.nobilishas been identified as highly desirable [28]. The understorey
ofW.nobilishabitat is characterized by ~3% light, and greenhouse experiments have shown
that stem growth of small (<0.7 m tall)W.nobilisincreases with light (up to 50% light; [32]).
In particular, we asked:
1. How does growth (stem length, branch number) and survival of translocatedW.nobilis
vary along a light gradient?
2. How does the effect of light onW.nobilisgrowth and survival vary with plant size?
The terminology used to describe plantings of rare and threatened species for conservation
outcomes is often confusing [33–35]. Such plantings have been variously called reintroduction,
reinforcement, ecological replacement, assisted colonisation/migration and community con-struction [33]. Often the distinction between these terms depends on the past distribution of
the species. ForW.nobilis, which is only known as living individuals from a single site, but is
present in the region (and elsewhere) in the fossil record for hundreds of millions of years [36,37], these definitions are often ill-suited. Throughout this paper, we simply use the
rela-tively broad term“translocation”, which is defined as the intentional movement of an organism
Methods
Study area
This study was carried out in warm temperate rainforest on land owned and managed by Blue
Mountains Botanic Garden Mount Tomah (BMBGMT; -33°32’S, 150°25’E). BMBGMT gave
permission for the study to be carried out on their land.
Study design
Site assessment for experimental translocation. Potential sites for the experimental translocation were formally assessed nine months before planting. We assessed the suitability of potential sites based on two criteria: (i) habitat characteristics and (ii) logistics, implementa-tion and management [8]. A simplified ranking table was completed for each potential site (S1 Table,sensu[8]). The site that we selected for the experimental translocation was in a native warm temperate rainforest community located on land managed by the BMBGMT. The trans-location site is in a deeply incised canyon and has environmental conditions that are similar to
those of the naturalW.nobilissites. Mean annual rainfall at the experimental translocation site
(1376 mm) was higher than at the wild site (952 mm). We tested soil for N, P, K, micronutri-ents and pH, to assess similarity to the wild site. In addition, we sampled for the presence of
Phytophthora cinnamomi, a root fungus that causes dieback in juveniles and adults of many
plant species [38] includingW.nobilis[28,39]. Key soil variables at the experimental
transloca-tion site were similar to those of the wild site (S2 Table).
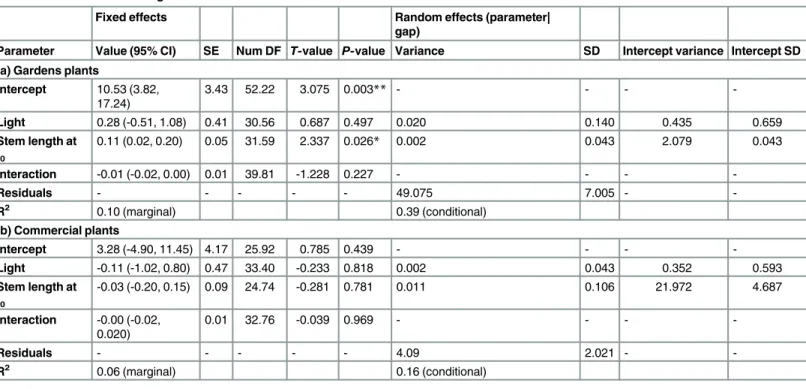
Light measurements and determination of planting sites (gaps). We identified 30 potential planting locations in rainforest canopy gaps. We selected the 30 gaps to span the full range of canopy openness at the site. Light was measured from the heavily shaded rainforest (near the creek line) to beneath large canopy gaps at the rainforest-woodland boundary. Light, as a proportion of total available light, at each gap was estimated from hemispherical photogra-phy. Hemispherical photography is widely used in studies of canopy structure and transmis-sion of light forest [40]. A camera (Canon 60D camera with a Sigma 4.5 mm hemispherical lens) was mounted on a tripod, levelled and placed so that the top of the photo was facing mag-netic north. Three photos were taken for each gap using automatic exposure bracketing (F 14 and ISO 100). Additional photos, one for each plant, were taken at 12 months to capture within-gap light variability, using the same methods. Hemispherical photos were analysed first using the automatic thresholding algorithm in Sidelook [41]. In several instances where the automatic thresholding algorithm did not result in adequate partitioning of canopy and sky, the automatic threshold was noted, and the Gap Light Analysis (GLA 2.0, [40]) software was used to fix problem areas (e.g., sun flare and reflections from rock face). GLA was then used to calculate proportion of canopy and sky and light variables. All analyses were done using the blue channel.
Transmitted total light at the experimental translocation site ranged from 0 to 24%,
com-pared to the wild site (0–6%,Fig 1;S3 Table). The experimental translocation site therefore
provided a greater range of light availabilities.
Source material. A total of 191 plants were included in our experiment. One hundred and one plants were obtained from the Australian Botanic Garden Mount Annan (ABGMA),
which maintains ex situ populations ofW.nobilis. The plants were 2–3 years old, grown from
cuttings from 20 individual wild parents, and were raised in a hygienic environment free from
pathogens (e.g.,Phytophthora cinnamomi). Plants from the ABGMA varied in size. There were
1042 (±73) mm. Due to the limited availability of plants from botanic gardens, an additional 90
cutting-grownW.nobiliswere sourced from a commercial supplier. These were in 100 mm
pots and had a mean stem length of 456 (±6) mm. Seedlings (rather than plants grown from cuttings) are typically preferred in restoration because of their genetic diversity, and the poten-tial long-term implications for populations [42,43]. However, it should be noted that
translo-catedW.nobilispopulations will have low genetic diversity because the small wild population
ofW.nobilishas extremely low genetic diversity [29]. We used plants grown from cuttings
rather than seeds or seedlings because of the inadequate availability of seed.
Planting. Planting occurred over four days in August 2012 (late winter). Planting was
timed to occur before theW.nobilisgrowing season (i.e., spring). A quarantine station was
established outside of the site, and all equipment was sterilised with a methylated spirits
solu-tion to minimize potentialP.cinnamomispread. Individual plants were manually transported
from the road end and placed at planting sites within the warm temperate rainforest. Plants were removed from pots and their roots were gently teased out immediately before planting. In each gap we planted six or seven plants, this included three plants from the commercial supplier (3 × 100 mm pots) and three or four plants from the ABGMA (1 × 165 mm pot,
2–3 × 250–265 mm pots). The experimental translocation site was approximately 120 m long,
following a creek, and extending 60 m upslope from the creek (i.e., a total area of 120 m × 60
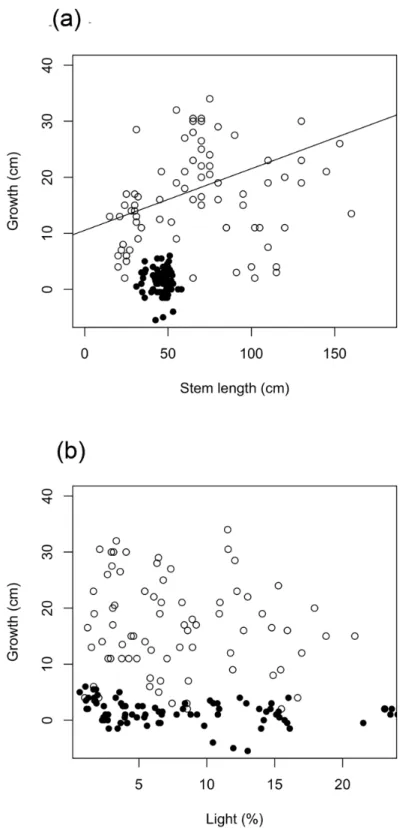
Fig 1. Total transmitted light in the experimental translocation site and the wildWollemia nobilissite.
m). Gaps were spread along the site. Planting was undertaken in an area of approximately 4 m × 4 m within each gap, with at least 1 m between plants. Plant placement was dependent on ability to dig a planting hole (i.e., not impeded by rocks). Each plant was watered (~ five litres), its stem length was measured, and wallaby (and lyrebird) guards were erected. Clearing of ground-level vegetation was sometimes required. In these cases a consistent area (1 m in diam-eter) was cleared around each plant. Each plant was again given approximately five litres of
water one month after planting (September 2012). A total of 191W.nobiliswere outplanted.
Photographs of the plants and experimental translocation site can be found inS1 Fig.
Monitoring. Monitoring was undertaken at 1 month (September 2012; survival only), 2 months (October 2012), 5 months (January 2013; survival only), 6 months (February 2013), 11 months (July 2013), 16 months (December 2013), 18 months (February 2014; survival only) and 25 months (September 2014) after planting. Stem length was measured and number of
branches counted.Wollemia nobilisonly produces first-order plagiotrophic shoots (or
branches);W.nobilisbranches do not branch [44]. Branches are therefore limited in the size to
which they can grow and, in mature trees, they are typically shed after 5–15 years [45]. Signs of
insects and pathogens were recorded. The wallaby guards were removed in June 2013 as there were no signs of herbivory on exposed branches and the cages had the potential to restrict branch development as the trees grew.
Statistical analysis
Preliminary examination of the data showed that plants from the two suppliers had very differ-ent trends in growth and survival. Moreover, during planting we observed that all plants from the commercial supplier were root bound and chlorotic relative to the plants from the botanic garden. For this reason, we subset the data by supplier for analysis, and refer to plant origin as
either“commercial”or“gardens”.
Stem growth and branch number. Total stem growth and number of branches at 25
months was calculated for live plants (n= 157; not including those that had died back and then
resprouted). We were interested in how growth varied with light availability, and if there were
any interactions between light and stem length at t0. Stem growth was analyzed according to
light, initial stem length (stem length at t0) and gap. The same analysis was completed for
change in number of branches. We used linear mixed-effects models (lmer in thelme4package;
[46]) so that a random effect for gap could be included. We fitted a full model: light and stem
length at t0, their interaction, and the random effect of gap on each, with the form:
Stem growthij¼ ðb0þb0jÞ þ ðb1þb1jÞLightiþ ðb2þb3jÞLengthiþ ðb3þb3jÞLightiLengthiþεij bnj Nð0;s
2
njÞ
εij Nð0; s2Þ
where light, length, and their interaction arefixed effects and gap is a random effect. Theβnare thefixed-effects coefficients, which are identical for each gap, andbnjare the random-effects
coef-ficients, which vary for each gapj.
P-values were estimated using the Satterthwaite approximation for degrees of freedom in
thelmerTestpackage. Models were fit with REML to give unbiased parameter estimates. Effect
sizes were estimated using both marginal and conditional R2[47,48] to differentiate between
the proportions of variance explained by fixed effects, and the combination of fixed and ran-dom effects, respectively.
Survival. Plants were classified as alive (n= 162) or dead (n= 29) at 25 months. Live plants
included those that had died back and resprouted (n= 6), and dead plants included two plants
varied with light conditions, and if there were interactions between light and plant size in
deter-mining survival, hence survival was analyzed as a function of stem length at t0, light, and gap.
We used a generalized linear mixed-effects model (GLMM; glmer in thelme4package;[46]), as
follows:
Survivalij¼ ðb0þb0jÞ þ ðb1þb1jÞLightiþ ðb2þb3jÞLengthiþ ðb3þb3jÞLightiLengthiþεij
bnj Nð0; s2njÞ
εij Nð0; s2Þ
where light, length, and their interaction arefixed effects and gap is a random effect. Theβnare
thefixed-effects coefficients, which are identical for each gap, andbnjare the random-effects
coefficients, which vary for each gapj. To accommodate the binomial structure of the survival
data (i.e., dead or alive), a logit link function was used.
Predictor data were centered (mean subtracted) and scaled (divided by two times the stan-dard deviation;[49]). We fit full model as above, although this model, with random intercepts and slopes for both initial stem length and light, was affected by over-specification. For this rea-son, we present two models, one with a random intercept and slope for stem length, the other with a random intercept and slope for light. Effect sizes were estimated using marginal and
conditional R2[47,48]. Predictions for mortality as a function of light were made without the
gap random effect (i.e., as GLM), to give an overall picture of the relationship between mortal-ity and light, regardless of gap.
Survival (time to event) analysis was performed using survfit in thesurvivalpackage [50] to
investigate patterns in timing of mortality throughout the experiment. The advantage of sur-vival analysis is that it can handle censored observations, where the event of interest (i.e., mor-tality) did not occur, and incorporate information from both censored and non-censored observations. Commercial and gardens plant data were grouped together in a single analysis. The data were treated as interval censored, as we did not have exact dates of plant mortality. All analyses were undertaken in R [51].
The individual in this manuscript has given written informed consent (as outlined in PLOS consent form) to publish these case details.
Results
Stem growth
The commercial plants grew much less than the gardens plants (Fig 2). Growth over the study period (25 months) was a mean of 14 (±22, 1 standard deviation [SD]) mm for the commercial plants and 160 (±84) mm for the gardens plants, equivalent to annual growth of 7 mm and 77 mm, respectively.
The full model for growth in stem length of gardens plants explained 39% of the variation in
the data, 10% of which was explained by fixed effects (marginal R2= 0.10, conditional R2=
0.39;Table 1a). The only significant fixed effect was initial stem length (t-value = 2.337,
P= 0.026;Table 1a), indicating higher growth in larger plants. The effect of light was not
signif-icant. The majority of variation was explained by random effects. The most important random effect was the random intercept for initial stem length, with variance of 2.079 (Table 1a), indi-cating the effect of initial stem length varied among gaps. However, this was much less than the variance of the residuals of 49.075 (Table 1a).
In contrast, the model for stem growth of the commercial plants explained only 16% of the
variation in the data (marginal R2= 0.06, conditional R2= 0.16;Table 1b). No fixed effects
Fig 2. Stem growth as a function of stem length at t0and total light.Commercial plant data are black points. Gardens plant data are white points and solid line. Line represents model estimates (fixed effects) for growth as a function of stem length at t0.
with variance of 21.972 and a standard deviation of 4.687 (Table 1b). This indicates the effect of initial stem length on stem growth varied among gaps.
Branch number
Gardens plants underwent greater change in branch number, with values ranging from -41 to 25, compared with commercially grown plants, which ranged from -16 to 1.
The model of change in branch number for gardens plants explained 67% of the variation in
the data (conditional R2= 0.67;Table 2a), with only 23% explained by fixed effects (marginal
R2= 0.23;Table 2a). No fixed effects were significant, although light had aP-value of 0.072
(Table 2a). The most important random effect was the random intercept for initial stem length, with variance of 9.712 (Table 2a). However, the residuals had a much larger variance of 62.65 (Table 2a).
The full model for change in branch number in commercial plants explained only 10% of
the data (marginal R2= 0.10;Table 2b). None of the fixed effects were significant, and the
vari-ance within the random effect residuals (varivari-ance = 17.42;Table 2b) was greater than any
cap-tured by the random slopes or intercepts.
Survival
The majority of mortality occurred in gardens plants. Ninety-four percent of commercial plants survived, while survival of gardens plants was only 69%. Twenty-nine plants died in
total. The native pathogenBotryosphaeriainfected 17 of the 19 plants that died in<3% light,
and 4 of the 10 plants that died in>3% light.Botryosphaeriaspecies are opportunistic fungi
that predominately affect trees that are injured or stressed [52,53].Botryosphaeriaspecies can
Table 1. Full models of stem growth.
Fixed effects Random effects (parameter|
gap)
Parameter Value (95% CI) SE Num DF T-value P-value Variance SD Intercept variance Intercept SD
(a) Gardens plants
Intercept 10.53 (3.82, 17.24)
3.43 52.22 3.075 0.003** - - -
-Light 0.28 (-0.51, 1.08) 0.41 30.56 0.687 0.497 0.020 0.140 0.435 0.659
Stem length at t0
0.11 (0.02, 0.20) 0.05 31.59 2.337 0.026* 0.002 0.043 2.079 0.043
Interaction -0.01 (-0.02, 0.00) 0.01 39.81 -1.228 0.227 - - -
-Residuals - - - 49.075 7.005 -
-R2 0.10 (marginal) 0.39 (conditional)
(b) Commercial plants
Intercept 3.28 (-4.90, 11.45) 4.17 25.92 0.785 0.439 - - -
-Light -0.11 (-1.02, 0.80) 0.47 33.40 -0.233 0.818 0.002 0.043 0.352 0.593
Stem length at t0
-0.03 (-0.20, 0.15) 0.09 24.74 -0.281 0.781 0.011 0.106 21.972 4.687
Interaction -0.00 (-0.02, 0.020)
0.01 32.76 -0.039 0.969 - - -
-Residuals - - - 4.09 2.021 -
-R2 0.06 (marginal) 0.16 (conditional)
*=P>0.05, **=P>0.01.
be pathogenic toW.nobilisseedlings [39], but can also exist as non-pathogenic endophytes [54].
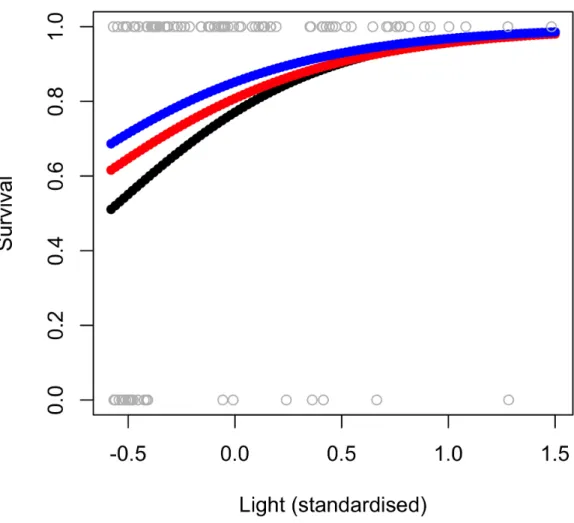
The full model of survival of the gardens plants, with a random intercept and slope for light,
explained 92% of variation in the data (conditional R2= 0.92;Table 3a). Fixed effects explained
31% of variation (marginal R2= 0.31;Table 3a) and there was a significant positive correlation
with light (P= 0.037,Table 3a;Fig 3). In terms of random effects, the random slope for light
Table 3. Full models of survival for garden plants.
Fixed effects Random effects (parameter| gap)
Parameter Value SE Z value PrZ Variance SD Intercept variance Intercept SD
(a) Random slope and intercept for light
Intercept 4.37 (1.21, 7.53) 1.61 2.713 0.007** - - -
-Stem length at t0 1.79 (-0.14, 3.73) 0.98 1.817 0.069 - - -
-Light 7.19 (0.45, 13.94) 3.44 2.091 0.037* 84.433 9.189 5.196 2.279
Interaction 3.20 (-1.59, 7.99) 2.44 1.307 0.191 - - -
-R2 0.31 (marginal) 0.92 (conditional)
(b) Random slope and intercept for initial stem length
Intercept 1.90 (0.63, 3.16) 0.64 2.925 0.003**
Stem length at t0 -0.34 (-2.28, 1.62) 0.99 -0.336 0.736 1.687 1.299 2.890 1.700 Light 1.34 (-0.51, 3.18) 0.94 1.420 0.156
Interaction -0.79 (-4.04, 2.45) 1.65 -0.478 0.633
R2 0.07 (marginal) 0.54 (conditional)
*=P>0.05, **=P>0.01.
doi:10.1371/journal.pone.0157559.t003
Table 2. Full models of change in branch number.
Fixed effects Random effects (parameter|
gap)
Parameter Value (95% CI) SE Num DF t-value P-value Variance SD Intercept variance
Intercept SD
(a) Gardens plants
Intercept 10.34 (2.30, 18.38) 4.10 54.45 2.522 0.015* - - -
-Light 0.88 (-0.06, 1.82) 0.48 60.00 1.829 0.072 <0.001 <0.001 <0.001 <0.001 Stem length at
t0
-0.11 (-0.26, 0.03) 0.07 36.45 -1.570 0.125 0.024 0.154 9.712 3.116
Interaction -0.01 (-0.02, 0.01) 0.01 54.81 -1.033 0.306 - - -
-Residuals - - - 62.65 7.915 -
-R2 0.23 (marginal) 0.67 (conditional)
(b) Commercial plants Intercept -4.51 (-19.19,
10.17)
7.49 76.00 -0.602 0.549 -
-Light 0.93 (-0.75, 2.60) 0.85 76.00 1.087 0.281 <0.001 <0.001 <0.001 <0.001 Stem length at
t0
-0.03 (-0.35, 0.28) 0.16 76.00 -0.210 0.831 <0.001 <0.001 <0.001 <0.001
Interaction -0.02 (-0.06, 0.01) 0.02 76.00 -1.242 0.218 - - -
-Residuals - - - 17.42 4.17 -
-R2 0.10 (marginal) 0.10 (conditional)
*=P>0.05.
encapsulated more variance (84.433;Table 3a) than did the random intercept for light (5.196; Table 3a). This indicates that the survival response to light varied with gap. The alternative model, with random effects for initial stem length explained only 54% of the data (conditional
R2= 0.54;Table 3b). In contrast, for the commercial plants the full model explained only 1% of
variation in survival (marginal R2= 0.01, conditional R2= 0.01;Table 4,S2 Fig), indicating that
Fig 3. Predicted survival, as a function of light, for plants of a range of stem lengths.1 = live plant, 0 = dead plant. Predictions based on gardens-supplied plants of a range of sizes: 40 cm (black), 80 cm (red) and 120 cm (blue). Parameter estimates used vary from those in the full model of gardens plant survival (Table 3) as the gap random effect was removed, and the model re-run as a glm to make predictions for all plants, regardless of gap (S4 Table).
doi:10.1371/journal.pone.0157559.g003
Table 4. Full model of survival for commercial plants.
Fixed effects Random effects (parameter| gap)
Parameter Value SE Z value PrZ Variance SD Intercept variance Intercept SD
Intercept 2.84 (1.93, 3.75) 0.47 6.104 <0.0001*** - - -
-Stem length at t0 0.37 (-1.38, 2.12) 0.90 0.126 0.679 <0.001 <0.001 <0.001 <0.001 Light 0.12 (-1.76, 2.00) 0.96 0.414 0.900 <0.001 <0.001 <0.001 <0.001
Interaction -0.22 (-4.48, 4.05) 2.18 -0.099 0.921 - - -
-R2 0.012 (marginal) 0.012 (conditional)
***=P>0.001.
variation in survival of commercial plants was not strongly associated with gap, light or plant size.
Survival analysis (time to event) revealed most of the mortality occurred between the first and second summer, although new mortality occurred at each survey (S1 File).
Discussion
Translocation is a key strategy to reduce extinction risk forW.nobilis[28], but the
establish-ment requireestablish-ments forW.nobiliswere poorly known. While shade tolerance ofW.nobilishad
been demonstrated in the wild [30], vigorous growth in high light conditions had been shown
in greenhouse studies [32]. We characterised the growth and survival of plantedW.nobilisin a
range of light conditions within a new warm temperate rainforest site through experimental translocation. Although it was not our intention, initial plant condition had a strong influence on growth and survival, so our results are considered for each group of plants separately. The commercially grown plants had high survival rates (94%), but also low growth (mean = 14 mm), whereas the plants supplied by the botanic gardens had higher growth (mean = 160 mm) and lower survival (69%).
Survival
Increased light was associated with increased survival in the gardens-suppliedW.nobilis.
Posi-tive relationships between survival and light have been demonstrated in under-planting studies of shade-tolerant species in boreal, temperate and tropical forest types. In Ontario, in
east-cen-tral Canada, survival of under-planted, shade-tolerantPicea glauca, was lowest in uncut (low
light) sites, compared to all sites with some level of thinning [55]. Likewise, in the Oregon
Coast Range in north-western US, planting seedlings of several conifer species (Abies grandis,
Picea sitchensis Tsuga heterophylla) underneath un-thinnedPsudeostuga menzeiesiistands was
lethal, with all seedlings dead after two years [19]. Alternatively, survival rates increased in thinned stands with higher light [19]. Further, in guidelines for enrichment planting in mixed dipterocarp forest in Sri Lanka, Ashton [56] suggests the optimal conditions for establishment of the majority of species, shade-tolerant and intolerant, are within gaps.
Moving a plant to a new location (i.e., translocation) is likely to influence growth and sur-vival. In our study, the change in light conditions from nursery to experimental translocation site, was likely an important driver of growth and survival responses. Plants alter their photo-synthetic apparatus in response to the irradiance that they experience as new leaves form
[57,58]. Most of the leaf area of the gardens-suppliedW.nobiliswas established in greenhouse
conditions of 50% full sunlight. As such, we suspect that higher mortality of gardens plants in darker sites was likely due to insufficient acclimatisation to lower light conditions prior to out-planting. Had the gardens plants been nursery grown in deeper shade, or placed in larger can-opy gaps, survival may have been greater. Likewise, survival was enhanced at higher light sites. The ability of shade-tolerant species to respond to increased light availability is well known [59]. Indeed, few tree species recruit well in deep shade and nearly all species increase recruit-ment and growth with increasing light availability (e.g., [60,61]). For this reason we suggest
that future growth and survival will be higher for theW.nobilisin higher light sites. The
rela-tionship between survival and light (in gardens plants) was influenced by gap. We are unsure of what drove this variation, although potential influences include soil variations across the site
and, or spatial variation inBotryosphaeriainfection. Notably neither initial plant size, light nor
gap explained variation in mortality of commercially-grown plants.
MostW.nobilismortality was associated with infection with aBotryosphaeriaspecies (74%,
conditions are favourable forBotryosphaeriagrowth [62–64]. Fungal diseases are a common problem for threatened conifers globally. In the US and Canada, a key threat to the endangered
coniferPinus albicaulisis White pine blister rust (Cronartium ribicola).Cronartium ribicolais
found across the entire distribution ofPinus albicaulisand can result in mortality of>50% of
infected trees, with mortality more likely in older trees [65,66].Torreya taxifolia, also in North
America, is listed as critically endangered because of widespread mortality of adult trees (but
not juveniles) caused by infection withFusarium torreya[67,68]. While we had been vigilant
about thePhytophthora cinnamomithreat toW.nobilis, the impact ofBotreyosphaeriawas not
expected.
Other factors commonly implicated in the survival of translocated plants are herbivory and water availability [69]. There was no evidence of herbivory at the experimental translocation site, and herbivore cages were removed after nine months to allow unimpeded growth. Water-ing was stopped one month after plantWater-ing and there was no subsequent observed decline in survival, despite increasing temperatures into summer. The high overall survival of these
trans-locatedW.nobilisindicates that habitat rarity is unlikely to be the cause of the current limited
distribution ofW.nobilis(sensu[8]), instead disturbance history, or dispersal and
establish-ment limitation (sensu[70]) are likely to be more important.
Growth
Growth of translocatedW.nobiliswas not correlated with light, a result that contrasts with
greenhouse studies ofW.nobilis[32]. Increasing growth with increasing light is the most
typi-cal result reported in under-planting studies from around the world. In temperate US forests,
under-planted conifer seedlings,Thuja plicata,Abies grandisandTsuga heterophylla, had
higher growth rates where overstorey retention was lowest [20]. There was also a positive
rela-tionship between growth of under-planted (and naturally established)Pinus strobusseedlings
in the understorey and light in the mesic hemlock hardwood forests of US mid-west [71]. In that study light levels measured at seedlings were not strongly related to gap size, and this was attributed to light interception within the understorey [71]. In a tropical lowland rainforest in Borneo, growth of planted non-pioneer dipterocarp seedlings was higher in gaps relative to seedlings planted in the untreated controls [72]. Similarly, in the Amazon, growth of six under-planted timber species was higher in gaps that were larger, and had higher light (both gap size and light were measured, [73]). Based on these studies we predict that future growth rates of
W.nobiliswill be higher in larger gaps. We found that stem growth of gardens plants was
sig-nificantly correlated with initial plant size—larger plants grew more. The relationship between
stem growth and initial plant size was varied with gap, as did the relationship between branch
count and initial plant size. Despite early growth of translocatedW.nobiliswas not being
corre-lated with light, mean stem growth of the translocated gardens-grownW.nobiliswas much
greater than stem growth observed in wild seedlings (77 cf.<10 mm/year; [30]).
The commercially grown plants were in poor condition compared with the garden-supplied plants, showing signs of chlorosis and root binding. Chlorosis can be a response to irradiance [74,75] and/or nutrient status (high or low; [76,77]). Root binding occurs when development of lateral- and/or tap-roots is impeded [78,79]. Restriction of rooting space, regardless of water and nutrient availability, can lead to reduced root growth [80] and whole plant growth after
planting [81,82]. While the commercialW.nobilishad low mortality (i.e., 6% versus 31% in
gardens plants), they also grew very little. Variation in the quality of nursery stock can have long-term effects on tree growth and stability [83,84]. In the north-western US, early losses of
under-planted conifers (Thuja plicata)were attributed to the freezing conditions the seedlings
planting stock quality on the survival of under-plantedPseudotsuga menziesiiandTsuga
het-erophylla. Other studies have been established specifically to assess nursery conditions and
treatments on outcomes (e.g.,Quercus rubra, [86]). The chlorosis and root binding observed in
commercially grown plants at time of planting may have limited plant growth, but also led to
resource conservation and therefore higher survival. Notably, of the 37W.nobilisthat died
back, eight (21%)W.nobilissubsequently resprouted (although two of these individuals then
died). Interestingly, all except one of these resprouting plants were commercially grown.
Conclusion
Translocation offers the potential to buffer rare and threatened species from extinction by
establishing new populations (sensu[87,88]). Translocation by under-planting is an approach
that utilizes the range of environmental conditions that occur within forest understories, which may be particularly useful in establishing new populations of shade-tolerant plant species.
Management recommendations
To maximise survival of transplants, future translocations ofW.nobilisshould be undertaken
within sites with light availabilities at the higher end of the range we tested (>20%), and further
work should consider the suitability of even higher light levels. Practitioners may also consider using larger plants to maximize growth.
In this study we used cutting-grown plants because no seed-grown plants were available.
Future translocations ofW.nobilisshould include seedlings when they become available, to
account for the possibility that previously undetected genetic variation may emerge from seeds. A companion study describing the microbial responses associated with Wollemi pine trans-location is described by Rigg et al. [89].
Supporting Information
S1 Fig. Photographs of translocatedWollemia nobilisand experimental translocation site.
(a) Translocation site showingWollemia nobilisand warm temperate rainforest (Gap 11) (b
and c) TranslocatedWollemia nobilisnew growth.
(TIF)
S2 Fig. Survival of commercially grownWollemia nobilis, according to height and light. (DOCX)
S1 File. Survival analysis. Fig A.Survival of translocatedW.nobilisthrough time.Table A.
Numerical results of survival analysis showing survival of translocatedW.nobilisthrough time.
(DOCX)
S1 Table. Simplified ranking tablesensuMaschinski and Haskins 2012. (DOCX)
S2 Table. Comparison of soil characteristics at the translocation and wild sites. (DOCX)
S3 Table. Gap characteristics.Light conditions and relative elevation of the gaps where
Wolle-mia nobiliswere planted, and summary survival and growth ofW.nobilisaccording to supplier
S4 Table. Parameter estimates for the glm that was used to generate predictions for Wolle-mia nobilissurvival according to stem length and light (Fig 3).
(DOCX)
S5 Table. Wollemi pine translocation data.Includes plant origin, planting site light, survival and growth data.
(XLSX)
Acknowledgments
We would like to thank the Wollemi Pine Recovery Team, especially Steve Clarke, David
Crust, Ed Liew and Patricia Meagher for their work towards a translocation ofWollemia nobilis
over many years. The Australian Botanic Garden, Mount Annan, provided theWollemia
nobi-lisplants for the translocation experiment, and we thank Amanda Rollason for care and
preparation of the plants. The Blue Mountains Botanic Garden Mount Tomah hosted the experiment. We thank the many staff, particularly Ross Ingram and Greg Bourke, who pro-vided assistance in the planting and monitoring. We thank Jess Rigg and Jeff Powell (Univer-sity of Western Sydney) for their partnership in this project and assistance in the field. Comments from the Editor, David Forsyth and five anonymous reviewers greatly improved the manuscript.
Author Contributions
Conceived and designed the experiments: HZ CO TA PB. Performed the experiments: HZ CO TA PB. Analyzed the data: HZ PB. Contributed reagents/materials/analysis tools: CO TA. Wrote the paper: HZ CO TA PB.
References
1. Mace GM, Collar NJ, Gaston KJ, Hilton-Taylor C, Akcakaya HR, Leader-Williams N, et al. (2008) Quan-tification of extinction risk: IUCN's system for classifying threatened species. Conservation Biology 22: 1424–1442. doi:10.1111/j.1523-1739.2008.01044.xPMID:18847444
2. World Conservation Union I (1987) IUCN position statement on the translocation of living organisms: introductions, re-introductions, and re- stocking. IUCN, Gland, Switzerland. Available:http://intranet. iucn.org/webfiles/doc/SSC/SSCwebsite/Policy_statements/IUCN_Position_Statement_on_ Translocation_of_Living_Organisms.pdf.
3. Webber BL, Scott JK, Didham RK (2011) Translocation or bust! A new acclimatization agenda for the 21st century. Trends in Ecology & Evolution 26: 493–494.
4. Rout TM, Hauser CE, Possingham HP (2007) Minimise long-term loss or maximise short-term gain? Ecological Modelling 201: 67–74.
5. Müller H, Eriksson O (2013) A pragmatic and utilitarian view of species translocation as a tool in conser-vation biology. Biodiversity and Conserconser-vation 22: 1837–1841.
6. Vallee L, Hogbin T, Monks L, Makinson B, Matthes M, Rosetto M (2004) Guidelines for the translocation of threatened plants in Australia. Australian Network for Plant Conservation, Canberra, Australia. 7. Maschinski J, Haskins KE (2012) Plant Reintroduction in a Changing Climate. Island Press. 432 pp. 8. Maschinski J, Falk DS, Wright SJ, Possley J, Roncal J, Wendelberger KS (2012) Optimal locations for
plant reintroductions in a changing world. In: Maschinski J, Haskins KE, editors. Plant reintroduction in a changing climate. Island Press. pp. 109–129.
9. Whitmore T (1989) Canopy gaps and the two major groups of forest trees. Ecology 70: 536–538. 10. Hubbell SP, Forster RB, O'Brien ST, Harms KE, Condit R, Wechsler B, et al. (1999) Light-gap
distur-bances, recruitment limitation, and tree diversity in a neotropical forest. Science 283: 554–557. PMID:
9915706
12. Paquette A, Bouchard A, Cogliastro A (2006) Survival and growth of under-planted trees: a meta-analy-sis across four biomes. Ecological Applications 16: 1575–1589. PMID:16937819
13. Ashton P, Gamage S, Gunatilleke I, Gunatilleke C (1997) Restoration of a Sri Lankan rainforest: using Caribbean pinePinus caribaeaas a nurse for establishing late-successional tree species. Journal of Applied Ecology 34: 915–925.
14. Kobe RK (1999) Light gradient partitioning among tropical tree species through differential seedling mortality and growth. Ecology 80: 187–201.
15. Johnson PS (1984) Responses of planted northern red oak to three overstory treatments. Canadian Journal of Forest Research 14: 536–542.
16. Dey DC, Gardiner ES, Schweitzer CJ, Kabrick JM, Jacobs DF (2012) Underplanting to sustain future stocking of oak (Quercus) in temperate deciduous forests. New Forests 43: 955–978.
17. Stewart JD, Landhäusser SM, Stadt KJ, Lieffers VJ (2000) Regeneration of White Spruce under Aspen canopies: seeding, planting and site preparation. Western Journal of Applied Forestry 15: 177–182. 18. Erefur C, Bergsten U, Lundmark T, de Chantal M (2010) Establishment of planted Norway spruce and
Scots pine seedlings: effects of light environment, fertilisation, and orientation and distance with respect to shelter trees. New Forests 41: 263–276.
19. Maas-Hebner KG, Emmingham WH, Larson DJ, Chan SS (2005) Establishment and growth of native hardwood and conifer seedlings underplanted in thinned Douglas-fir stands. Forest Ecology and Man-agement 208: 331–345.
20. Brandeis TJ, Newton M, Cole EC (2001) Underplanted conifer seedling survival and growth in thinned Douglas-fir stands. Canadian Journal of Forest Research 31: 302–312.
21. Khurana E, Singh JS (2001) Ecology of seed and seedling growth for conservation and restoration of tropical dry forest: a review. Environmental Conservation 28: 39–52.
22. Navarro-Cerrillo RM, Griffith DM, Ramírez-Soria MJ, Pariona W, Golicher D, Palacios G (2011) Enrich-ment of big-leaf mahogany (Swietenia macrophyllaKing) in logging gaps in Bolivia: The effects of plant-ing method and silvicultural treatments on long-term seedlplant-ing survival and growth. Forest Ecology and Management 262: 2271–2280.
23. Drayton B, Primack RB (2012) Success rates for reintroductions of eight perennial plant species after 15 years. Restoration Ecology 20: 299–303.
24. Murcia C, Aronson J (2014) Intelligent tinkering in ecological restoration. Restoration Ecology 22: 279–
283.
25. Young TP, Petersen DA, Clary JJ (2005) The ecology of restoration: historical links, emerging issues and unexplored realms. Ecology Letters 8: 662–673.
26. Jones W, Hill K, Allen J (1995)Wollemia nobilis, a new living Australian genus and species in the Arau-cariaceae. Telopea 6: 173–176.
27. Benson J, Allen C (2007) Vegetation associated withWollemia nobilis(Araucariaceae). Cunninghamia 10: 255–262.
28. New South Wales Government DOC (2006) Wollemi Pine Recovery Plan: 1–37. Available:http://www. environment.gov.au/system/files/resources/245df899-5818-44c1-a1f0-76fb70bb9fc6/files/wollemia-nobilis.pdf.
29. Peakall R, Ebert D, Scott LJ, Meagher PF, Offord CA (2003) Comparative genetic study confirms exceptionally low genetic variation in the ancient and endangered relictual conifer,Wollemia nobilis
(Araucariaceae). Molecular Ecology 12: 2331–2343. PMID:12919472
30. Zimmer HC, Auld TD, Benson J, Baker PJ (2014) Recruitment bottlenecks in the rare Australian conifer
Wollemia nobilis. Biodiversity and Conservation 23: 203–215.
31. Offord C, Porter C, Meagher P, Errington G (1999) Sexual reproduction and early plant growth of the Wollemi pine (Wollemia nobilis), a rare and threatened Australian conifer. Annals of Botany 84: 1–9. 32. Offord CA, Meagher PF, Zimmer H (2014) Growing up or growing out? How soil pH and light affect
seedling growth of a relictual rainforest tree. Annals of Botany: Plants: 1–25.
33. Seddon PJ (2010) From reintroduction to assisted colonization: moving along the conservation translo-cation spectrum. Restoration Ecology 18: 796–802.
34. Jørgensen D (2011) What“s history got to do with it? A response to Seddon”s definition of reintroduc-tion. Restoration Ecology 19: 705–708.
35. Dalrymple SE, Moehrenschlager A (2013)“Words matter.”A response to Jørgensen's treatment of his-toric range and definitions of reintroduction. Restoration Ecology 21: 156–158.
37. Macphail M, Hill K, Partridge A, Truswell E, Foster C (1995) Wollemi Pine-Old pollen records for a newly discovered genus of gymnosperm. Geology Today 11: 48–50.
38. Hardham AR (2005) Phytophthora cinnamomi. Molecular Plant Pathology 6: 589–604. doi:10.1111/j. 1364-3703.2005.00308.xPMID:20565682
39. Bullock S, Summerell B, Gunn L (2000) Pathogens of the Wollemi pine,Wollemia nobilis. Australasian Plant Pathology 29: 211–214.
40. Frazer GW, Canham CD, Lertzman KP (1999) Gap Light Analyzer (GLA). Available:http://www. caryinstitute.org/science-program/our-scientists/dr-charles-d-canham/gap-light-analyzer-gla. 41. Nobis M, Hunziker U (2005) Automatic thresholding for hemispherical canopy-photographs based on
edge detection. Agricultural and Forest Meteorology 128: 243–250.
42. Crutsinger GM, Collins MD, Fordyce JA, Gompert Z, Nice CC, Sanders NJ (2006) Plant genotypic diversity predicts community structure and governs an ecosystem process. Science 313: 966–968. PMID:16917062
43. Reusch TBH, Ehlers A, Hämmerli A, Worm B (2005) Ecosystem recovery after climatic extremes enhanced by genotypic diversity. Proceedings of the National Academy of Sciences 102: 2826–2831. 44. Hill KD (1997) Architecture of the Wollemi Pine (Wollemia nobilis, Araucariaceae), a unique
combina-tion of model and reiteracombina-tion. Australian Journal of Botany 45: 817–826.
45. Burrows GE, Meagher PF, Heady RD (2007) An anatomical assessment of branch abscission and branch-base hydraulic architecture in the endangeredWollemia nobilis. Annals of Botany 99: 609–
623. PMID:17272303
46. Bates D, Maechler M, Bolker B, Walker S, editors (2014) lme4: Linear mixed-effects models using Eigen and S4. Available: onlinehttp://CRAN.R-project.org/package=lme4. Accessed 6 April 2015. 47. Lefcheck J, editor (n.d.) R-squared for generalized linear mixed-effects models. Available:https://
github.com/jslefche/rsquared.glmer. Accessed 6 April 2014.
48. Nakagawa S, Schielzeth H (2012) A general and simple method for obtaining R2from generalized lin-ear mixed-effects models. Methods in Ecology and Evolution 4: 133–142.
49. Gelman A (2008) Scaling regression inputs by dividing by two standard deviations. Statistics in Medi-cine 27: 2865–2873. PMID:17960576
50. Therneau T, editor (n.d.) A package for survival analysis in S. R package version 2.37–4. Available:
http://CRAN.R-project.org/package=survival. Accessed 7 April 2013.
51. R: A language and environment for statistical computing. (n.d.) R: A language and environment for sta-tistical computing. Available:http://www.R-project.org/.
52. Dreistadt SH (2008) Pests of landscape trees and shrubs: An integrated pest management guide. Uni-versity of California Agriculture and Natural Resources, Davis, California.
53. Sinclair W, Lyon H (2005) Diseases of trees and shrubs. Comstock Publishing Associates, New York. 54. Slippers B, Summerel BA, Crous PW, Coutinho TA, Wingfield BD, Wingfield MJ (2005) Preliminary
studies onBotryosphaeriaspecies from Southern Hemisphere conifers in Australasia and South Africa. Australasian Plant Pathology 34: 213–220.
55. Man R, Rice JA, MacDonald GB (2009) Long-term response of planted conifers, natural regeneration, and vegetation to harvesting, scalping, and weeding on a boreal mixedwood site. Forest Ecology and Management 258: 1225–1234.
56. Ashton MS, Gunatilleke C, Singhakumara B, Gunatilleke I (2001) Restoration pathways for rain forest in southwest Sri Lanka: a review of concepts and models. Forest Ecology and Management 154: 409–
430.
57. Coopman RE, Reyes-Díaz M, Briceño VF, Corcuera LJ, Cabrera HM, Bravo LA (2008) Changes during early development in photosynthetic light acclimation capacity explain the shade to sun transition in
Nothofagus nitida. Tree Physiology 28: 1561–1571. PMID:18708338
58. Krause GH, Koroleva OY, Dalling JW, Winter K (2001) Acclimation of tropical tree seedlings to exces-sive light in simulated tree-fall gaps. Plant, Cell & Environment 24: 1345–1352.
59. Canham CD (1988) Growth and canopy architecture of shade-tolerant trees: response to canopy gaps. Ecology 69: 786–795.
60. Delcamp M, Gourlet-Fleury S, Flores O, Gamier E (2009) Can functional classification of tropical trees predict population dynamics after disturbance? Journal of Vegetation Science 19: 209–220. 61. Rüger N, Huth A, Hubbell SP, Condit R (2009) Response of recruitment to light availability across a
62. Amponsah NT, Jones EE, Ridgway HJ, Jaspers MV (2010) Effects of solar radiation and relative humidity on germination of Botryosphaeriaceae species conidia. New Zealand Plant Protection 63: 28–32.
63. Arauz LF, Sutton TB (1989) Temperature and wetness duration requirements for apple infection by
Botryosphaeria obtusa. Phytopathology 79: 440–444.
64. Michailides TJ, Morgan DP (1992) Effects of temperature and wetness duration on infection of pistachio byBotryosphaeria dothideaand management of disease by reducing duration of irrigation. Phytopa-thology 82: 1399–1406.
65. Smith JP, Hoffmann JT (2000) Status of the White Pine Blister Rust in the Intermountain West. Western North American Naturalist 60: 165–179.
66. Smith CM, Shepherd B, Gillies C, Stuart-Smith J (2013) Changes in blister rust infection and mortality in whitebark pine over time. Canadian Journal of Forest Research 43: 90–96.
67. Aoki T, Smith JA, Mount LL, Geiser DM, O'Donnell K (2013)Fusarium torreyaesp. nov., a pathogen causing canker disease of Florida torreya (Torreya taxifolia), a critically endangered conifer restricted to northern Florida and southwestern Georgia. Mycologia 105: 312–319. doi:10.3852/12-262PMID:
23099517
68. Smith JA, O'Donnell K, Mount LL, Shin K, Peacock K, Spector T, et al. (2011) A novel Fusarium species causes a canker disease of the critically endangered conifer,Torreya taxifolia. Plant Disease 95: 633–
670.
69. Guerrant EO Jr., Kaye TN (2007) Reintroduction of rare and endangered plants: common factors, ques-tions and approaches. Australian Journal of Botany 55: 362–370.
70. Jackson ST, Overpeck JT (2000) Responses of plant populations and communities to environmental changes of the late Quaternary. Paleobiology 26: 194–220.
71. Fahey RT, Lorimer CG (2013) Restoring a midtolerant pine species as a component of late-succes-sional forests: Results of gap-based planting trials. Forest Ecology and Management 292: 139–149. 72. Romell E, Hallsby G, Karlsson A, Garcia C (2008) Artificial canopy gaps in aMacarangaspp.
domi-nated secondary tropical rain forest—Effects on survival and above ground increment of four under-planted dipterocarp species. Forest Ecology and Management 255: 1452–1460.
73. Schulze M (2008) Technical and financial analysis of enrichment planting in logging gaps as a potential component of forest management in the eastern Amazon. Forest Ecology and Management 255: 866–
879.
74. Mano J (2000) Early events in environmental stresses in plants. In: Inze D, van Montagu M, editors. Oxidative stress in plants. CRC Press, Boca Raton, Florida. pp. 217–245.
75. Muller P, Li X-P, Niyogi KK (2001) Non-photochemical quenching. A response to excess light energy. Plant Physiology 125: 1558–1566. PMID:11299337
76. Mengel K (1995) Iron availability in plant tissues—iron chlorosis on calcareous soils. Plant and Soil 165: 275–283.
77. Baryla A, Carrier P, Franck F, Coulomb C, Sahut C, Havaux M (2001) Leaf chlorosis in oilseed rape plants (Brassica napus) grown on cadmium-polluted soil: causes and consequences for photosynthesis and growth. Planta 212: 696–709. PMID:11346943
78. Ruehle JL (1985) The effect of cupric carbonate on root morphology of containerized mycorrhizal pine seedlings. Canadian Journal of Forest Research 15: 586–592.
79. Dumroese RK, Sung S-JS, Pinto JR, Ross-Davis A, Scott DA (2013) Morphology, gas exchange, and chlorophyll content of longleaf pine seedlings in response to rooting volume, copper root pruning, and nitrogen supply in a container nursery. New Forests 44: 881–897.
80. South DB, Harris SW, Barnett JP, Hainds MJ, Gjerstad DH (2005) Effect of container type and seedling size on survival and early height growth ofPinus palustrisseedlings in Alabama, U.S.A. Forest Ecology and Management 204: 385–398.
81. Davis AS, Jacobs DF (2005) Quantifying root system quality of nursery seedlings and relationship to outplanting performance. New Forests 30: 295–311.
82. McConnaughay K, Bazzaz FA (1991) Is physical space a soil resource? Ecology 72: 94–103. 83. Halter MR, Chanway CP, Harper GJ (1993) Growth reduction and root deformation of containerized
lodgepole pine saplings 11 years after planting. Forest Ecology and Management 56: 131–146. 84. Lindström A, Rune G (1999) Root deformation in plantations of container-grown Scots pine trees:
effects on root growth, tree stability and stem straightness. Plant and Soil 217: 29–37.
86. Zaczek JJ, Steiner KC, Bowersox TW (1996) Northern red oak planting stock: 6-year results. New For-ests 13: 175–189.
87. Maunder M (1992) Plant reintroduction: an overview. Biodiversity and Conservation 1: 51–61. 88. Maschinski J, Duquesnel J (2007) Successful reintroductions of the endangered long-lived Sargent’s
cherry palm,Pseudophoenix sargentii, in the Florida Keys. Biological Conservation 134: 122–129. 89. Rigg JL, Offord CA, Zimmer H, Anderson IC, Singh BK, Powell JR. Conservation by translocation: