American Journal of Engineering Research (AJER)
2015
American Journal of Engineering Research (AJER)
e-ISSN: 2320-0847 p-ISSN : 2320-0936
Volume-4, Issue-9, pp-139-147
www.ajer.org
Research Paper Open Access
w w w . a j e r . o r g
Page 139
OKUMURA-HATA: A PERFECT MODEL FOR DRIVING
ROUTE UHF INVESTIGATION
Omohimire P. Omolaye
#1, Gabriel A. Igwue
#2, Godfrey A. Akpakwu
#3#1
Dept. of Electrical and Electronics Engineering, University of Agriculture, Makurdi, Nigeria
#2
Dept. of Electrical and Electronics Engineering, University of Agriculture, Makurdi, Nigeria
#3
Dept. of Electrical and Electronics Engineering, University of Agriculture, Makurdi, Nigeria
ABSTRACT: In today’s competitive world, a successful utility must take maximum advantage of its resources, from people to equipment to information. Using GIS on RF to integrate geographic with other corporate data has become absolutely vital to this task. The truthfulness and understandability of information is dependent upon the way it is presented. Urban planner, biologist, geologist, hydrological engineer and RF engineer tend to discuss some common factor of interest by having a better understanding of their environment (the geographic space of their study area). All these professionals work with data that relates to space. Most precisely, they deal with questions related to geographic space, which might informally be characterized as having positioned data to the earth’s surface. In this paper, we investigate and predict best model suitable for driving route of UHF wave propagation in Ondo state, Nigeria by comparing measured values using GIS equipment with the empirical results.
Keywords: GIS, Urban planner, Biologist, Geologist, Hydrological Engineer, RF engineer, UHF, Wave propagation
I.
INTRODUCTION
The telecommunication industry is experiencing exponential growth, resulting in tough competition and an ever-increasing scope of services offered to suscribers. Solving the many business problems of a telecommunications company requires a good understanding of where your clients and facilities exist and information about those locations. GIS as a tool in partner with the field of remote sensing has become an important component for modelling radio wave prediction [1]. Urban planner, biologist, geologist, hydrological engineer and RF engineer tend to discuss some common factor of interest by having a better understanding of their environment (the geographic space of their study area). For instance, urban planner might like to find out about urban fringe growth in the city; a biologist might be interested in the impact of slash-and-burn practices on the population of an amphibian species in the forests; a geologist might identify the best localities for construction of building in an area with regular earthquakes occurrence by looking at rock formation characterstic; a geoinformatic engineer might be hired by a telecom giant to determine the best sites for the base stations, taking various accounts of cost factors such as land prices, undulation of the terrain, et cetera; an RF engineer might be interested in the signal strength evaluation and prediction of a particular sub-station. All these professionals work with data that relate to space. Most precisely, they deal with questions related to geographic space, which might informally be characterized as having
positioned data to the earth’s surface.
II.
LITERATURE REVIEW
w w w . a j e r . o r g
Page 140
which it is travelling, but for simplicity is usually considered with respect to a vacuum. The frequency of a wave is defined in terms of the number of cycles per second or hertz (Hz) and is related to the wavelength (λ) by the expression, =
λ. The Ultra High Frequency (UHF) band lies between 300 MHz and 3GHZ which is the ideal
choice for ground to air communication with wide band-width that propagate principally on line of sight (LOS) from the transmitter to the receiver. The effects of local area topography and conditions in the lower atmosphere mostly govern UHF propagation. For communication to take place, the transmitting and receiving antennas must have a fairly unobstructed path between them, hence the term line-of-sight [2]. Radio wave is a function of frequency of propagation, lower radio frequencies, such as AM/FM radio, have lower wavelengths which allow them to penetrate geographic features such as vegetation, building wall and others. As the wavelength decreases, the frequency increases which makes more influence by geographic feature in the environment [3] and thus [1] the quality of signal strength is extensively blocked or degraded by nature and man to the relatively short wavelength propagation.
In this vein, the prime importance of attenuation investigation and prediction for radio waves propagation can never be over emphasized by the communication researchers when dealing with planning, budgeting and design of high performance communication systems [4],[5],[6],[7]. From the transmitter, radio propagation takes different propagation path to the receiver which depends on the interaction with interfering objects along the path of propagation [8]. Therefore, the path that the radio wave will take depends on many factors such as frequency, antenna type and height, atmospheric conditions and terrain. So, it is important to discuss, understand and appreciate other propagation losses due to complex obstructions such as buildings, tunnels, forests, rainfall, ice, and other atmospheric conditions. Geographic features hinder the propagation of wave which can be easily modeled in visibility theory i.e line of sight theory [9].
The classification done by [10] grouped propagation models into three: deterministic, statistical and empirical models. Deterministic models accuracy is usually very high but at the expense of high computation complexity. This is because, it requires 3D data of the propagation environment and makes use of the physical laws which determine radio wave propagation mechanisms for a particular location. Stochastic models, on the other hand, require the least information about the environment, model the environment as a series of random variables but provide the least accuracy. Empirical models are based on extensive measurements and mainly give prediction of path loss which is more often used in practice than statistical and deterministic propagation models, because of low cost and model simplicity with acceptable accuracy. There are several radio frequency propagation models in which each is useful for specific environment and the accuracy of any of the model depends on the parameter required by the model and the environment. There is no universal model for all kinds of propagation situation. All propagation models are based on the terrain parameters (rural, urban and suburban area) and system parameters like antenna height, frequency [10]. Example of these models are Okumura-Hata model, Walfisch-Bertoni model, Eglic model, Erecg Model, COST 231-Hata model, 2D and 3D ray tracing, SUI model, COST -231-Walfisch-Ikegami, Cluster Factor, etc.
Until recently, empirical propagation prediction models seemed sufficient. However, more efficient prediction models are required in transmitting data (voice and non voice) from the antenna to the receiver. These propagation models are usually based on the computation of the physical interaction of radio waves and the environment. Thus, more detailed geo-databases of the environment are required, especially in urban environments where most users are located [17]. In broadcast frequency planning, GIS is relevant in base station programming, base station position selection, field strength prediction, coverage analysis, interference analysis, frequency distribution, and so on. For accurate prediction of radio wave, interference analysis and coverage calculation demand detailed location spatial database of the required area. As the wireless technology grows, the industry development trend uses geographic information system to strengthen TV broadcasting coverage network management and construction [12]. The inability of radio wave to penetrate or bend around geographic features which result in non line of sight can be easily modeled in geographical information system. GIS has ability to model the communication sheds (commshed) which is also known as the viewshed. Having the LOS properties of the wave length, the viewshed shows the zone where there will be signal [13].
w w w . a j e r . o r g
Page 141
terrain [14]. [15] used GIS to predict model radio wave coverage in Peru Mountain District using 16 Tx antenna locations with 100 meter height above the ground. The size of the study area was 343,820 square kilometers having a minimum elevation values of 136 meters above sea level and maximum values of 6,687 meters above sea level. Landuse in the mountains consists mostly of shrublands, 32%, grasslands, 32%, and tundra, 17%. Environmental
Systems Research Institute’s (ESRI) ArcGIS 9.1 was used for prediction. The Okumura-Hata model path loss results were assessed based on the free space curve. The free space propagation formula was applied in a GIS environment to generate free-space path loss over distance for a Tx antenna. The Okumura-Hata model path loss curve was similar to the GIS generated free space model with the use of raster calculator. Values were tested at various locations and compared with values on the Okumura-Hata model curve which are similar.
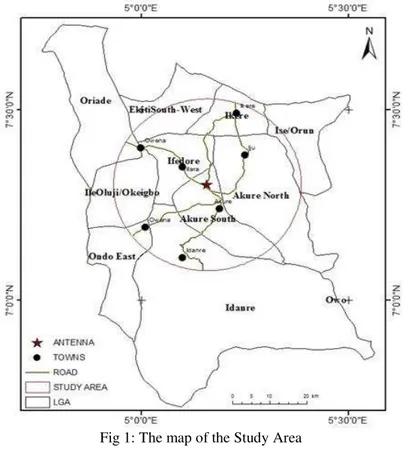
Features of The Study Area: As shown below, the study area covers 25km from Ondo State Radiovision
Corporation (OSRC) Antenna which lies within latitudes 6° 30’ 00” and 8° 00’ 00” and longitudes 4° 30’ 00” and 5° 30′ 00'' with minimum elevation value of 204m above the mean sea level and maximum elevation value of 1065m above the mean sea level.
Fig 1: The map of the Study Area
III. METHODOLOGY
Table 1: Data and their sources Data Year Source Relevance Google
image
2007 Google earth
For route design and navigation
ASTER 2011 USGS For digital elevation
model and spot height Field
measurement
2014 Self For signal strength measurement
Antenna description
2013 OSRC For path loss
calculation
Landsat 2014 USGS For landuse /cover
w w w . a j e r . o r g
Page 142
A. Driving Route Test Design
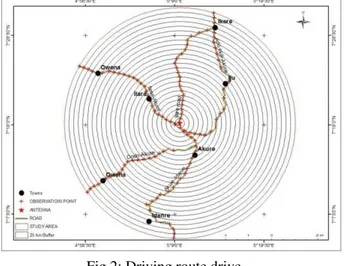
The GPS coordinate of the transmitting antenna was obtained. This was plotted in ArcGIS environment and 25km ring buffering around the transmitting antenna was carried out at 1km interval. Points where the buffer crosses the route were recorded. These coordinates were traced to the ground for signal observation. This was carried out based on terrain variation, land cover and distance from the antenna which served as a guide and to provide necessary navigation information. Five driving routes were followed which cut across the study area as shown below
Fig 2: Driving route drive
Fig 3: Work Flow Diagram
B. Signal Strength Measurement
w w w . a j e r . o r g
Page 143
C. Signal Strength Measurement with Expected Signal Strength Value:
The signal strength measurement was carried out based on the above route design. Measurements were carried out in different defined route land use type and terrain classification in order to predict signal strength. Distance and line of sight (LOS) from the transmitter to the receiver were considered. Field signal strength data were acquired within ten days. This was carried out in late January with little or no atmospheric interference. The measured signal was compared to theoretical value. Equation 1 was used to calculate theoretical values.
� �� = 30 ���
(� ) (1)
where Pt is the transmitted power in (W),
Gt is the gain of the transmitter,
d is the LOS distance in (m).
D. Signal Strength Measurement with Existing Models
The field measurements were carried out in the study area and compared with empirical models that were developed to predict signal strength. The empirical model used in this study are Okumura Hata, Egli and COST 123 model which were compared with field measurements in the study area in order to develop a base model for the study area. Equations 2, 3 and 4 were used to determine the corresponding path loss for each measurement taken.
�ℎ = 88 ℎ�ℎ� ℎ
−2
� 2 (2)
� = ������ (3)
� = �����ℎ�
2ℎ � 2
4 (4)
WherePr is in watts, hr, ht is in metre, dh, d are in Km and f is the frequency in MHz, [11].
IV.
RADIO WAVE PROPAGATION MODELS
All radio wave models are mathematical models to predict radio wave attenuation. Communication researchers make use of these models for planning, budgeting, design and managing of high performance communication systems. Measurements are mostly carried out for verification of the existing model and the measured observation [16]. There are several existing models for radio wave prediction reviewed in this research but the paper is limited to three models namely; Okumura-Hata, COST 123 and Egli model.
A. Okumura-Hata Model
One of the most common propagation models for predicting signal attenuation in a macro cell environment. The model developed by Y. Okumura and M. Hata and is based on measurements in urban and suburban areas. Validity range of the model is frequency fcbetween 150MHz and 1500 MHz, TX height hbbetween 3 and 200 m, RX height
hmbetween 1 and 10m and TX-RX distance r between 1 and 10 km [9]. Okumura-Hata's equations are classified
into three models. They are:
Rural area: Open space, no tall trees or building in path.
Suburban area: Village high-way scattered with trees and houses with some obstacles near the mobile station but not very congested.
Urban area: Built up city or large town with large buildings and houses. The Path loss for Okumura-Hata model is defined as below:
Urban area path loss (dB)
w w w . a j e r . o r g
Page 144
Suburban areas path loss (dB)
L(db)=69.55+26.16log10 -13.82 log10ℎ� +(44.9 -6.55 [(log10 /28)2+5.4] (6)
Rural path loss (dB)
L(dB)=69.55+26.16 log10 -13.82log10ℎ� +(44.9 - 6.55 log10ℎ� ) log10 −4.78
(log10 )2+18.33log10 + 40.94. (7)
where
hm: mobile station antenna height above local terrain height [m]
dm: distance between the mobile and the building
h0: typical height of a building above local terrain height [m]
hte: base station antenna height above local terrain height [m]
r: great circle distance between base station and mobile [m]
R = r *10-3 great circle distance between base station and mobile [km] f: carrier frequency [Hz]
fc: f * 10-6 carrier frequency [MHz] λ: free space wavelength [m]
B. Egli Model
The Egli model’s ease of implementation and agreement with empirical data make it a popular choice, particularly for a first analysis. The Egli model for median path loss over irregular terrain is given as
(8) where Gbis the gain of the base antenna,
Gm is the gain of the mobile antenna, hbis the height of the base antenna,
hmis the height of the mobile antenna,
d is the propagation distance,
β = (40/f )2, where f is in MHz
C. COST 231 (Walfisch and Ikegami) Model
This model is a combination of the models from J. Walfisch and F. Ikegami. It was further developed by the COST 231 project. The frequency ranges from 800 MHz to 2000 MHz. This model is used primarily in Europe for the GSM1900 system [9].
Path Loss,
L50 (dB) = Lf+ Lrts+ Lms (11)
where, Lf= free-space loss,
Lrts= rooftop to street diffraction and scatter loss,
Lms= multiscreen loss
Free space loss is given as
Lf = 32:4 + 20 log d + 20 log fcdB (12)
V.
RESULT AND DISCUSSION
With the disparity shown between the measured values along the five chosen routes, it could be deduced that the propagation here suffered attenuation caused by physical environment, atmospheric refraction, and the natural atmosphere induced propagation delays. In the natural atmosphere, delays are induced by refractivity of gases, hydrometers, and other particulates, depending on their permittivity and concentration, and forward scattering from hydrometers and other particulates. Changes in temperature, moisture, and pressure in the atmospheric column cause a change in atmospheric density, which in turn causes variations in the intensity of waves in both the vertical and horizontal. Reflection and diffraction caused by obstruction (buildings, mountains with different elevations among others) and the effect of tree density with foliages along the paths chosen.
w w w . a j e r . o r g
Page 145
acceptability and are currently in use for mobile radio propagation. Their specifications and conditions were met by the parameters of this research work. When compared with measured path loss, the mean deviation errors of the models used for the predictions were then generated. These prediction errors were calculated as the difference between the measurement and prediction.
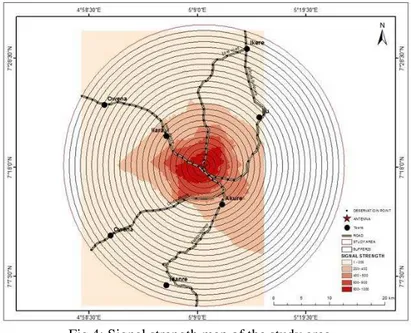
A. Signal strength of the study area
It was noticed and fully observed that there are direct line of s ight between the transmitter and the receiver but the signal strength reduces as reciever is moved away from the transmitter. The reduction in signal strength is not uniform which is as a result of attenuation caused by land cover/use, atmospheric refraction and other factors. The signal strength map was classified into five categories based on field strength observed. At 2km away from the transmitter, the signal strength is strong and stable but as the receiver moved further away from the transmitter, the signal reduce gradually because each route differed as elements within the propagation zone also differed.
Fig 4: Signal strength map of the study area
B. Various measured against the theoretical value
After determining the field measurements for each route, the observations were made in order to make a comparison between the measured and theoretical values and the results clearly show that the measured value is less than the theoretical value due to geographical element and other factors along the path of propagation.
w w w . a j e r . o r g
Page 146
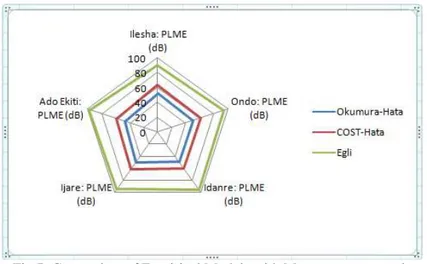
C. Path Loss Prediction
From the above diagram, Path loss for each model was calculated at each LOS. The result show that Egli model assumes that there is obstruction such as buildings and hilly area that is why the path loss is low which is not true while Okumura-Hata and COST 231 shows better prediction of signal strength. The overlap that occurs between the two models is that Okumura Hata model was modified to develop COST 231 model.
Fig 6: Path Loss Prediction radar graph
D. Comparism of Empirical Models with Measurements
The corresponding error statistics in terms of the mean prediction error is shown below. Note that PLME in the graph means Path loss mean error. It was observed from the analysis that out of the three models considered, Okumura-Hata model has minimum error of 52.08dB along Ilesa route, 50.02dB along Ondo route, 48.62dB along Idanre route, 50.05dB along Ijare route and 46.85dB along Ekiti route.
Fig 7: Comparism of Empirical Models with Measurements graph
VI.
CONCLUSIONS
w w w . a j e r . o r g
Page 147
The corresponding error statistics in terms of the mean prediction error and the prediction errors were calculated as the mean of the differences between the measurement and prediction. It could be observed clearly that all the three empirical models under-predicted the path loss with COST-Hata model and most especially Egli model grossly under predicted the path loss (i.e. Okumura-Hata model has minimum error in the prediction). Also shown is that all the three empirical models considered under-predicted the path loss with Okumura-Hata model and most especially
Egli’s model grossly under predicted the path loss (i.e. COST231-Hata model has minimum error in the prediction). Consequently, Okumura-Hata’s model is best suitable for prediction along the five routes
REFERENCES
[1] Rose, S. (2001.). The Effect of Digital Elevation Model Resolution on Wave Propagation Predictions at 24 GHz. Virginia Tech,: MS thesis in Geography.
[2] Harris. (2000). Radio Communications in the Digital Age (Vol. vol 2: VHF/UHF Technology). USA: Harris Corporation. [3] Weisman, C. J. (2000 ). The Essential Guide to RF and Wireless. New Jersey: Prentice Hall.
[4] Lee (1998). Mobile Communications Engineering: Theory and Applications. McGraw-Hill, USA.
[5] Rhodes (1999). Antenna Handbook. U.S. Marine Corps, Department of the navy Headquarters, Washington, D. C. 20380-1775, http.//www.doctrine.quantico.usmc.mil.
[6] Wesolowski. K (2002). Mobile communication System. ISBN: 0471 498378, John Wiley and Sons Ltd., New York.
[7] Prasad M. V. S. N, Rama Rao T, Ahmad Iqbal and Paul K. M (2006). Investigation of VHF signals in bands I AND II in southern India and model comparisons. Indian Journal of Radio and Space Physics. Vol. 35, 198 - 205.
[8] Fleury, B., and Lenthold, P. (1996). Radiowave Propagation in Mobile Communications. An Overview of European Research, IEEE Communication Magazine , 70-81.
[9] Mardeni, R., and Kwan, K. F. (2010). Optimization of Hata propagation prediction model in suburban in Malaysia. Progress In Electromagnetics Research C,, Vol. 13,
[10] Abhayawardhana V. S, I.J.Wassell, D.Crosby, M.P.Sellars, and M.G.Brown. (2005). Comparison of empirical propagation path models for fixed wireless access system. VTC 2005-Spring.IEEE 61st, vol. 1, pp.73-77.
[11] Omolaye, K.L., Omolaye P. O., and Akpakwu G. A (2014) A GIS Based UHF Radio Wave Propagation Model For Area Within 25km Radius From OSRC Transmitting Antenna. IJERT Publication Vol. 3 Issue 5, pp. 1784-1791, May – 2014.
[12] Bing, L., Chang, X., and Ruoyi, w. (nd). TV Broadcasting Frequency Programming based on GIS. Liaoning.
[13] Dodd, H. M. (2001). “The Validity of Using a Geographic Information System’s Viewshed Function as a Predictor for the Reception of
Line-of-Sight Radio Waves. Virginia Tech: MS thesis in Geography.
[14] Kirtner, J L., and Anderson, H. R. (1999). The Application of Land Use/Land Cover Data to Wireless Communication System Design.
eugene, Oregon, USA: EDX. Engineering,Inc.
[15] ReMartinez, C. (2009). A GIS Broadcast Coverage Prediction Model for Transmitted FM Radio Waves inPeru: Santon. [16] Balanis, C. (2005). Antenna Theory (3rd Edition ed.). USA: John Wiley and Sons Ltd.,.
[17] Jean-Frederic, W., and Rizk, K. (2003). Radiowave propagation, building databases, and GIS: anything in common? A radio engineer's viewpoint. Environment and Planning B, 30, 767-787.
Authors
Engr. Philip Omohimire Omolaye graduated from Electrical and Electronics Engineering Department at Federal University of Technology Akure, Ondo State of Nigeria and a Masters degree in Information Systems and Industrial Electronics. Presently, the author is pursing PhD in Telecommunication System Engineering. He is a registered member of Council of registered Engineers of Nigeria (COREN), Nigeria Society of Engineers (NSE), Nigeria Institute of Electrical and Electronic Engineers (NIEEE) and the Technical Secretary of both NSE and NIEEE at branch level. The author has written several books and many journal articles.
Engr. (Prof) Gabriel Agwu Igwue holds a B.Sc of the University of Lagos, an SM of the Massachusetts Institute of Technology, and a PhD of North Carolina State University, all in Electrical Engineering. He has carried out research work in industrial fabrication of some solid-state devices. The author has written several books and many journal articles in his field. He is a registered member of Council of registered Engineers of Nigeria (COREN) and Nigeria Society of Engineers (NSE).