Similarity and Clustering Analyses of 16S rRNA Gene
Sequence Data
Manal Helal1,2, Fanrong Kong2, Sharon C. A. Chen1,2, Michael Bain3, Richard Christen4, Vitali Sintchenko1,2*
1Sydney Medical School, The University of Sydney, Sydney, New South Wales, Australia,2Centre for Infectious Diseases and Microbiology, Westmead Hospital, Sydney West Area Health Service, Sydney, New South Wales, Australia,3School of Computer Science and Engineering, University of New South Wales, Sydney, New South Wales, Australia,4University of Nice Sophia-Antipolis, and CNRS UMR6543, Parc Valrose, Centre de Biochimie, Nice, France
Abstract
Background: The intra- and inter-species genetic diversity of bacteria and the absence of ‘reference’, or the most representative, sequences of individual species present a significant challenge for sequence-based identification. The aims of this study were to determine the utility, and compare the performance of several clustering and classification algorithms to identify the species of 364 sequences of 16S rRNA gene with a defined species in GenBank, and 110 sequences of 16S rRNA gene with no defined species, all within the genusNocardia.
Methods:A total of 364 16S rRNA gene sequences of Nocardiaspecies were studied. In addition, 110 16S rRNA gene sequences assigned only to theNocardiagenus level at the time of submission to GenBank were used for machine learning classification experiments. Different clustering algorithms were compared with a novel algorithm or the linear mapping (LM) of the distance matrix. Principal Components Analysis was used for the dimensionality reduction and visualization.
Results:The LM algorithm achieved the highest performance and classified the set of 364 16S rRNA sequences into 80 clusters, the majority of which (83.52%) corresponded with the original species. The most representative 16S rRNA sequences for individualNocardiaspecies have been identified as ‘centroids’ in respective clusters from which the distances to all other sequences were minimized; 110 16S rRNA gene sequences with identifications recorded only at the genus level were classified using machine learning methods. SimplekNN machine learning demonstrated the highest performance and classifiedNocardiaspecies sequences with an accuracy of 92.7% and a mean frequency of 0.578.
Conclusion:The identification of centroids of 16S rRNA gene sequence clusters using novel distance matrix clustering enables the identification of the most representative sequences for each individual species ofNocardiaand allows the quantitation of inter- and intra-species variability.
Citation:Helal M, Kong F, Chen SCA, Bain M, Christen R, et al. (2011) Defining Reference Sequences forNocardiaSpecies by Similarity and Clustering Analyses of 16S rRNA Gene Sequence Data. PLoS ONE 6(6): e19517. doi:10.1371/journal.pone.0019517
Editor:Leonardo A. Sechi, Universita di Sassari, Italy
ReceivedOctober 29, 2010;AcceptedApril 8, 2011;PublishedJune 8, 2011
Copyright:ß2011 Helal et al. This is an open-access article distributed under the terms of the Creative Commons Attribution License, which permits unrestricted use, distribution, and reproduction in any medium, provided the original author and source are credited.
Funding:This research was supported by the Australian National Health and Medical Research Council. The funders had no role in study design, data collection and analysis, decision to publish, or preparation of the manuscript.
Competing Interests:The authors have declared that no competing interests exist. * E-mail: vitali.sintchenko@swahs.health.nsw.gov.au
Introduction
Sequence-based identification of bacteria relies on the postulate that two strains with matching sequences of house-keeping genes, such as the 16S rRNA gene, are likely to belong to the same species of bacteria. However, if their sequences are different, then the interpretation depends on the magnitude of the difference: minor variations may still represent strains that are closely related taxonomically but more significant differences suggest that the strains might belong to evolutionary related but distinct species of bacteria. The quality of sequence-based identification depends on the representativeness of sequence libraries and the reliability of species definitions, both of which continue to pose challenges [1,2,3]. To improve sequence-based species identification, there
A large number of sequences from different microbial species have been accumulated in public databases. The task of their classification in a diagnostic laboratory has been complicated by the variability in sequences within a species and the absence of ‘reference sequences’ or the most representative sequences for that species [5,6]. To this end, significant advances have been made in gene annotation and similarity/dissimilarity assessments [7,8] and in the use of different distance metrics [8–10]. Multiple sequence alignment (MSA) methods [11–14] have been proposed as clustering methods, since they arrange sequences according to similarity.
Bacteria of the genus Nocardia cause a range of infectious diseases including localised lung and skin infections and dissem-inated disease [15]. The accurate identification of clinical isolates is critical for diagnosis, prediction of antimicrobial susceptibility and for epidemiological tracking of isolates. Since standard phenotypic identification methods are time-consuming and imprecise [16], nucleic acid-amplification tools targeting con-served gene regions have been developed to facilitate accurate species determination. Of these, 16S rDNA sequence analysis is the most frequently used method for the definitive species identification of Nocardiae [16,17]. These methods have led to substantial species re-assignment within the genus, especially among ‘‘Nocardia asteroides’’ and ‘‘Nocardia transvalensis’’ isolates. For example, two distinct new species, Nocardia wallacei and Nocardia blacklockiae, have recently been proposed to replace previous N. asteroides drug pattern IV and N. transvalensis new taxon 1, respectively [18]. Distinct species formerly classified within ‘‘N. asteroides’’ includeNocardia cyriacigeorgicaand Nocardia abscessus[16]. Over 80 species have now been described, (http://www.ncbi.nlm. nih.gov/Taxonomy/; http://www.bacterio.cict.fr/n/nocardia.html) [16]. Although numerousNocardia16S rDNA sequences have been deposited in public gene databases such as DDBJ/EMBL/GenBank consortium, a substantial proportion of bacterial 16S rRNA gene sequences represents inaccurate entries [19,20]. Further, sequence-based analyses are complicated by the lack of consensus regarding the degree of sequence similarity required for the species definition of
Nocardia[7,21].
The aim of this study was to numerically redefine the species memberships and to identify the most representative 16S rRNA gene sequences for each Nocardia species and to compare the performance of clustering algorithms in this classification task. We also aimed to assignNocardia16S rRNA gene sequences, deposited in the DDBJ/EMBL/GenBank consortium but not fully identified at the time of submission, to individual species using our classification algorithms.
Results
Interspecies sequence similarity among Nocardia Assuming that the assignment of sequences to species is correct and the successful numerical clustering needs to match the species identity as determined by GenBank-comparisons as much as possible, the accepted clustering results of the 364 sequences of 16S rRNA genes produced 80 clusters (for the full list of clusters, refer to Table S1). This was produced by the linear mapping of the alignment distance matrix (LM) algorithm. The majority of the clusters were relatively small in size: only 23 clusters contained five or more sequences of 16S rRNA genes and only two clusters (N. cyriacigeorgica and N. farcinica) had more than 20 sequences (Figure 1). The LM algorithm had two sensitivity parameters: the number of indices to map to, and the number of indices to include in each cluster. The accepted 80 clusters were achieved when the first parameter was 128 indices, with only one index per
cluster. Different sensitivity parameters produced a wide range of potential clusters (Table S2). Table 1 specifies the top twenty seven clusters at the accepted sensitivity level, their sizes and their reference sequence species and corresponding GenBank accession numbers assigned to those sequences. It also shows the proportion of the misclassified sequences, i.e. those whose identification (at the time of initial submission to GenBank) did not match the predominantNocardiaspecies in the cluster. Some of 16S rRNA gene sequences of seventeen Nocardia species were co-clustered with other species (Table 2). The high-level ‘heatmap’ of the distance matrix indicating rectangles around all of the clustering parameters is shown in the electronic supplements (Figure S1).
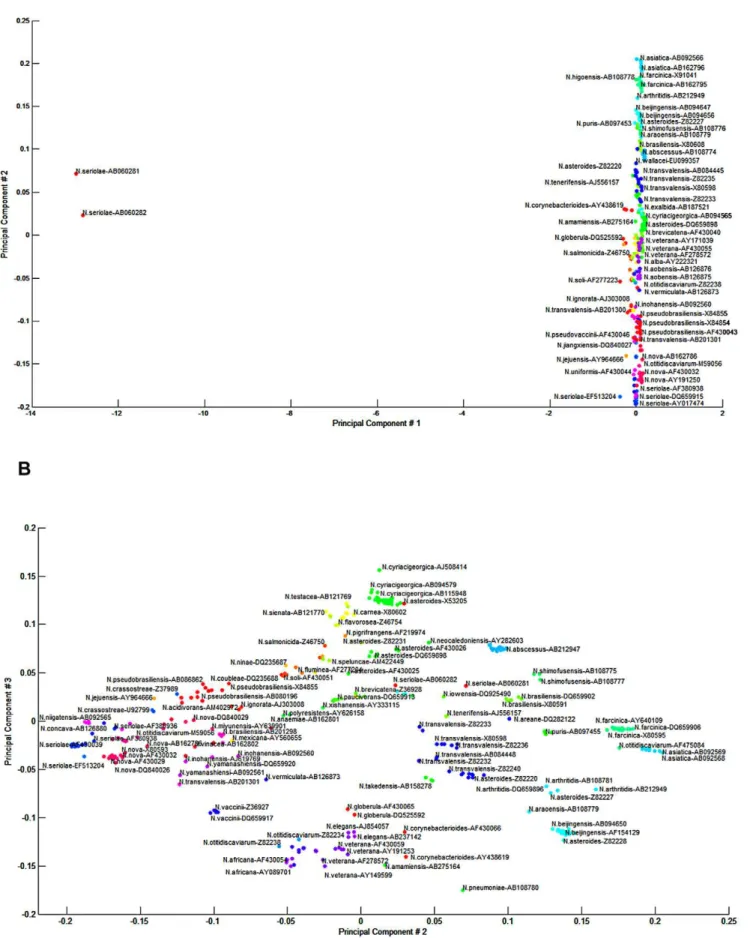
The alignment of 16S rRNA gene sequences identified hyper-variable regions surrounding V2, V4 and V6 that corresponded to the first 250 base pairs of the 16S rRNA gene, and about 500 and 650-bp, respectively (Figure 2). When principal component analysis (PCA) was applied to separate individual species by these discriminatory structures in the 16S rRNA gene, the first principal component represented 97.11% of the structure in the distance matrix. The second and the third components represented 1.61% and 0.44% of the data structure, respectively. The two-dimensional plot of the 1stand 2ndPCA (as shown in Figure 3-A to visually identify the clusters) was not informative. However, the combination of the 1st and 2ndPCA with the 2ndand 3rdPCA allowed the allocation of sequences into 80 clusters (Figure 3-B). When the 1st and 2ndPCA scores were used as the dataset for linear mapping clustering with a Euclidian distance measure, 67 clusters were identified. K-means method produced the highest accuracy when k was between 27–36 clusters, but we used 77 distinct clusters to match the known GenBank submitted species names.
The relationships between Nocardia species clusters were also visualised using a ‘‘mountain view’’ (Figure 4), where each cluster was represented as a peak in the three dimensional terrain. The Cluto algorithm identified ten ‘mountain peaks’ for the optimal 10 clusters. The clusters with the highest sequence similarity were ones consisting ofN. asteroidescomplex sequences (Figure 4; red peaks such as AF430025, AF430026, X84850, X80606, Z36934, AF430019, and DQ659898), and the other neighbouring clusters. Other Nocardia species were represented as less homogenous clusters with more diverse sequences of the 16S rRNA gene. Such representation illustrates the relative distance between species highlighting, for example, the uniqueness of two sequences ofN.
seriolae (Accession Numbers AB060281 and AB060282) which
appeared as outliers to the rest of the data set (the PCA plots in Figure 3 and the mountain view in Figure 4).
Performance of clustering algorithms
Figure 1. Clusters of differentNocardiaspecies determined by MSA comparisons.
doi:10.1371/journal.pone.0019517.g001
Table 1.Nocardiaspecies clusters and their reference sequences*.
Cluster name
Number of sequences in the cluster*
Reference Sequence Name
GenBank Accession Number
Proportion of otherNocardia
species assigned to the cluster, %
N. cyriacigeorgicaCluster 1 40 N. cyriacigeorgica AJ508414 5.00
N. farcinica 21 N. farcinica X80595 9.52
N. abscessus 18 N. abscessus AB212947 11.11
N. nova 18 N. nova X80593 0.0
N. beijingensis Cluster 1
17 N. beijingensis DQ659901 0.0
N. seriolae 17 N. seriolae X80592 0.0
N. asiatica 12 N. asiatica DQ659897 0.0
N. wallacei 9 N. wallacei Z82229 44.44
N. veterana 9 N. veterana AF278572 22.22
N. elegans 8 N. elegans DQ659905 50.0
N. otitidiscaviarum 8 N. otitidiscaviarum X80599 0.0
N. pseudobrasiliensis 8 N. pseudobrasiliensis DQ659914 0.0
N. brasiliensis 7 N. brasiliensis X80591 14.29
N. transvalensisCluster 1 7 N. transvalensis X80598 0.00
N. carnea 6 N. carnea AF430035 0.00
N. asteroides 6 N. asteroides DQ659898 16.67
N. beijingensis Cluster 2
6 N. asteroides*** Z82228 16.67
N. cyriacigeorgicaCluster 2 5 N. cyriacigeorgica Z82218 40.0
N. arthritidis 5 N. arthritidis DQ659896 40.0
N. vaccinii 5 N. vaccinii AF430045 0.0
N. aobensis 5 N. aobensis AB126876 0.0
N. niigatensis 5 N. niigatensis AB092563 0.00
N. transvalensisCluster 2 5 N. otitidiscaviarum** AB201303 60.0
N. brevicatena 4 N. brevicatena AF430040 0.0
N. paucivorans 4 N. paucivorans AF430041 0.0
N. puris 4 N. puris AB097455 0.0
N. vinacea 4 N. vinacea AB162802 25.0
Note: Rows ofNocardiaspecies assigned to more than 1 cluster are highlighted in grey.
*Only clusters with more than three 16S rRNA gene sequences are shown. For the full list refer to Table S3.
**OneN. otitidiscaviarum16S rRNA gene sequence in a cluster of five, suggestive of misclassification in the original submission.
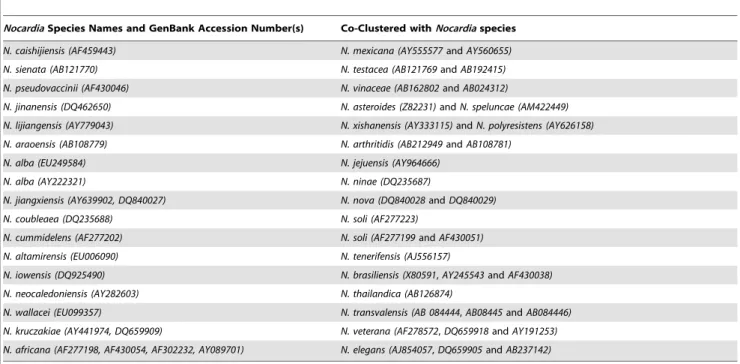
Table 2.Species names of 16S rRNA gene sequences that were co-clustered with other species.
NocardiaSpecies Names and GenBank Accession Number(s) Co-Clustered withNocardiaspecies
N. caishijiensis (AF459443) N. mexicana (AY555577andAY560655)
N. sienata (AB121770) N. testacea (AB121769andAB192415)
N. pseudovaccinii (AF430046) N. vinaceae (AB162802andAB024312)
N. jinanensis (DQ462650) N. asteroides (Z82231)andN. speluncae (AM422449)
N. lijiangensis (AY779043) N. xishanensis (AY333115)andN. polyresistens (AY626158)
N. araoensis (AB108779) N. arthritidis (AB212949andAB108781)
N. alba (EU249584) N. jejuensis (AY964666)
N. alba (AY222321) N. ninae (DQ235687)
N. jiangxiensis (AY639902, DQ840027) N. nova (DQ840028andDQ840029) N. coubleaea (DQ235688) N. soli (AF277223)
N. cummidelens (AF277202) N. soli (AF277199andAF430051)
N. altamirensis (EU006090) N. tenerifensis (AJ556157)
N. iowensis (DQ925490) N. brasiliensis (X80591,AY245543andAF430038)
N. neocaledoniensis (AY282603) N. thailandica (AB126874)
N. wallacei (EU099357) N. transvalensis (AB 084444,AB08445andAB084446)
N. kruczakiae (AY441974, DQ659909) N. veterana (AF278572,DQ659918andAY191253) N. africana (AF277198, AF430054, AF302232, AY089701) N. elegans (AJ854057,DQ659905andAB237142)
doi:10.1371/journal.pone.0019517.t002
Figure 2. Relative variability of different regions of the 16S rRNA gene sequence ofNocardiaspecies.Distance matrix generated with a sliding window of 200 nt. Peaks indicate highly variable regions of the gene.
Figure 3. Principal component analysis (PCA) clustering using the Linear Mapping algorithm over the Euclidian distance of the PCA 1 (x-axis) and PCA 2 (y-axis) scores.(A) and PCA 2 (x-axis) and PCA 3 (y-axis) scores (B).
silhouette values for sets of 27, 36 and 77 clusters were 0.509, 0.460, and 0.438, respectively.
The LM clustering identified three Nocardia asteroides clusters ranging from 9 sequences per cluster down to two sequences per cluster. The method produced five clusters forN. transvalensis, four clusters for N. seriolae, three clusters for N. cyriacigeorgica and N. otitidiscaviarum, and two clusters for theN. beijingensis,N. concava,N. farcinica,N. nova,N. pseudobrasiliensis,N. soli, andN. veteranaspecies. Results for clusters with three or more sequences are shown in Table 1, highlighting the clusters with species name of the reference sequence (or the cluster centroid). One cluster of N. beijingensis 16S rRNA gene sequences contained one, probably misclassified, sequence submitted to GenBank in 1996 under the name ofN. asteroides(Z82228) which was selected as the cluster’s centroid (N. beijingensisCluster 2 in Table 1).
A number of clusters contained multiple sequences derived from the same strain, usually a reference strain in a curated culture Figure 4. ‘Mountain’ view ofNocardiaspecies classification where clusters are represented as peaks on the 3D terrain, with the cluster number (starting from 0) pointing to the corresponding mountain peak.The shape of each peak is a Gaussian curve, which is a rough estimate of the distribution of the data within each cluster. The volume of a peak is proportional to the number of strains contained within the cluster. The height of each peak is proportional to the cluster’s internal similarity. The colour of a peak reflects the cluster’s internal deviation, where red indicates low deviation where as blue indicates high deviation. Only the colour at the tip of a peak is significant, whereas all other areas colour is determined by blending to create a smooth transition. The numbers indicate the number of a cluster in the experiment (See Supplemental material for details).
doi:10.1371/journal.pone.0019517.g004
Table 3.Comparative performance of clustering algorithms.
Clustering algorithm Exact match (%)* Partial match (%)**
Linear Mapping 304 (83.52) 339 (93.13)
Cluto 304 (83.52) 332 (91.21)
Hierarchical Clustering 294 (80.77) 320 (87.91)
k-means 258+/20.091 (70.88) 309 (84.89)
PCA 291 (79.95) 326 (89.56)
*Confidence Intervals can be calculated only fork-means.
**Partial match was defined as assignment of a sequence to a cluster which contains sequences ofNocardiaspecies that match this sequence along with other species.
collection. For example, in a cluster of six 16S rRNA gene sequences of N. asteroides only the sequences of three reference strains were represented. Specifically, sequences of different length (accession numbers Z36934, X84850 and DQ659898) were reportedly obtained from ATCC 19247T reference strain and submitted to the GenBank by research groups from the UK in 1994, France in 1995 and the USA in 2006, respectively. Similarly, within this cluster there were two sequences from N. asteroidesDSM 43757T (X80606 and AF430019) and one sequence fromN. asteroidesGTC 861. 16S rRNA gene sequences in one of theN. transvalensisclusters of seven sequences were obtained from four strains (X80609, AF430047 and Z36928 from the strain DSM43405T, X80598 and DQ659916 from ATCC6865T, and Z882232 and Z82249 from N1045 and N630, respectively).
Identification of reference sequences
The most representative 16S rRNA gene sequences for individualNocardiaspecies that have been identified as ‘centroids’ in respective clusters, are listed in Table 1. While most of the reference sequences appeared to be the type strains of those species (18 of 27, or 67%), a third (33%) of clusters were assigned with new reference sequences. Of note, certain Nocardiaspecies were classified into more than one cluster, and appeared to have more than one reference sequence - for example, for the three N. asteroides clusters, the LM clustering method identified the following reference sequences-centroids (Table 1): Z82229 for the largest nine-sequence cluster, and AF163818 and AF430025 for two remaining clusters of two sequences (specified in Supplementary Material).
Classification of unknown Nocardia 16S rRNA gene sequences
16S rRNA gene sequences with identifications only at the genus level were classified using machine learning algorithms. Two methods were employed from the MATLAB toolboxes (naı¨ve Bayes andk-Nearest Neighbour (kNN) classifiers) and six methods were used from Weka (naı¨ve Bayes,kNN, Boosted Decision Trees, Linear Support Vector Machine (SVM), Cubic SVM, and Quadratic SVM classifiers). Initially, 40 sequences were selected from the centroids of the highly populated clusters, as the validation sequences for the classification algorithms. All methods correctly identified all 40 sequences (see Table S3 for details of the validation). The classification algorithms were then applied to 110 16S rRNA gene sequences ofNocardiathat had been submitted to the public databases without speciation. The consensus of all classification algorithms was identified, and each method was given a performance score measuring its concordance with the consensus. These scores for the highest scoring methods are shown in Table 4, indicating that the in-house implementation of the k-nearest neighbour method, labelled as simple kNN, scored the highest, followed by the MATLAB implementations of naı¨ve Bayes and kNN classifiers. The expected frequency of species predicted by the classification algorithms for each of the 110 sequences is also shown in Table 4. This value obtained its maximum of 1.0 when allMalgorithms predicted the same species for each sequence, and its minimum of 1/Mwhen every algorithm predicted a different species. Simple kNN machine learning classified Nocardia species sequences with an accuracy of 92.7% and a mean frequency of 0.578 (Table 4). Simple kNN, the MATLAB naı¨ve Bayes and kNN classifiers demonstrated the highest frequency of prediction to be greater than 0.6, indicating that the species predicted by these methods will be predicted by almost two-thirds of all methods, averaged over all 110 sequences. In contrast, the lowest expected frequency was for WEKA NBayes
and kNN at 0.458 and 0.475, respectively, meaning that almost half of the methods agreed on the naming of individual species (Table 4). Even when the classification algorithms predicted different clusters for the same sequence, distances between the centroids of these clusters remained small. Only three sequences were classified to clusters with far-away centroids: AB243007, AF227864, and AJ971864. Unclassified sequences from the GenBank with the results of all classification algorithms and their consensus classification results are listed in Table S4.
Discussion
We have developed and tested a method for the identification of the most representative sequences from the sets of sequences submitted to public databases. Such sequences may be used as reference sequences to assist the rapid identification in a diagnostic laboratory [4]. This numeric method successfully classified 16S rRNA gene sequences into clusters and identified centroids of the clusters. The clustering of the 364 sequences of 16S rRNA genes of
Nocardia species revealed the highly homogenous sequence
structure of this almost certainly over-classified microbial genus. The high level of similarity of sequences in the Nocardia genus explains the relatively narrow range of expected frequencies reached by the majority of machine learning methods. These findings provide a quantitative view of theNocardiagenus space with intra- and inter-species variation being captured using similarity and clustering techniques, and confirm the suggestion that genome space is not uniformly filled by a seamless spectrum of intergrading types [22,23]. The recent changes in Nocardia
taxonomy have provided an indirect validation of our approach and have made our observations even more interesting. For example, a cluster of nine 16S rRNA gene sequences were submitted to the GenBank between 1996 and 2007 by microbi-ologists from Europe, the USA and Japan under different species names, such asN. asteroides(Z82220, Z82221, Z82229, AY191251, DQ659899), N. transvalensis (AB084445, AB084446, AB084444)
and N. wallacei (EU099357). Our algorithm has selected the
sequence DQ659899 at the ‘centroid’ of this cluster. Significantly, the GenBank submission from 2006 was recently changed fromN. asteroides into N. wallacei by its authors, as was the GenBank submission AY191251, making this cluster representative of N. wallacei16S rRNA sequences.
Table 4.Performance of classification algorithms against the consensus.
Method
Agreement with consensus, (%)
Expected frequency of predicted species
Simplek-Nearest Neighbour
92.73 0.669
Matlab NBayes 88.18 0.647
MatlabkNN 87.27 0.627
Alignment 77.27 0.592
WEKA NBayes 57.27 0.475
WEKAkNN 52.72 0.458
Note: The first column presents the accuracy of each method compared to the consensus of all methods used (i.e., the percentage of predictions made by each method that agree with the majority prediction by all methods). The second column shows the expected frequency of the classification made by each method (i.e., the mean frequency of the species predicted by each method, taken over all 110 sequences).
There has been a consensus that assignments to species should be made primarily on the basis of overall sequence similarity, although phenotypic difference should also play a role in fine-scale differentiation [23]. Assignment of a new sequence to a given species is usually done using the sequences of type strains (when available). However, type strains are often defined by the first isolate described for a new species. As a result, historical type strains (for a species) as well as type species (for a genus) may be defined from a clone which is somehow atypical within its clade (see for example the successive redescriptions necessary for many genera). We argue that automated classification process which is based on the sequence of centroids can be more efficient and relevant, even if the centroid sequence is not the sequence of the type strain or type species.
In this context, defining consensus reference sequences for target genes has become a priority for diagnostic laboratories [24]. The finding that most of the reference sequences (66%) appeared to be the type strains of those species reconfirms the validity of our approach. Importantly, a third (34%) of clusters was assigned with new reference sequences. Our study offers new insights into ways in which such reference sequences can be identified. Specifically, it suggests that the LM method might assist best with this task as it performed better than the alternative techniques studied and correctly identified the most representative or reference sequences for each cluster. The LM algorithm also suggested the optimal number of clusters based on given sensitivity parameters, while all other methods required a fixed number of clusters or a fixed distance between clusters to be identified as input. Interestingly, deterministic methods like the LM and Cluto outperformed techniques based on randomization (e.g.,k-means and hierarchical clustering). This is important as the deterministic methods are required for clustering sequences based on the distance measures produced from multiple sequence alignments.
This study contributes to the debate about the measurement of similarity between sequences [25]. The choice of the most optimal methods of alignment and distance measurement remains controversial [25]. Our experience indicates that progressive MSA based on pair-wise alignments is more suitable for large numbers of phylogenetically-related sequences [26] while long sequences from unrelated organisms could be better compared by more computationally expensive pair-wise alignments [27]. Therefore, this study employed Muscle, a progressive MSA method, for its speed and relative accuracy [25]. Muscle was considered the method of choice for our data sets, which consisted of 364 potentially closely related but not very long sequences.
Importantly, our classification algorithms have been able to assign species names to sequences ofNocardiaspecies submitted to the GenBank without proper speciation, and have also been able to identify 16S rRNA gene sequences that have been misclassified.
N. asteroidessequences were correctly clustered in three different clusters (with the majority of the sequences in the cluster to be identified in GenBank as N. asteroides). On the other hand, N.
asteroides (Z82228) appeared among a cluster of sequences
identified by GenBank to beN. beijingensis.
The recent advances in computational platforms for microbi-ologists [3,28–31] have encouraged the development of new tools for the comparative genomics of bacteria. The emergence of high-throughput molecular testing has enabled the potentially more discriminatory and informative ‘polyphasic’ identification and typing of pathogens that relies on several rather than on only one of target genes, some of which may significantly differ in their speed of evolution [32]. The simultaneous assessment of similarity between multiple genes or loci from sets of microbial genomes within the same or different species has become a new
requirement for bioinformatics analyses. For example, in a recent study [33] Nocardia speciation was achieved through multilocus sequence analysis (MLSA) of gyrase B the b-subunit of DNA topoisomerase (gyrB), 16S rRNA (16S), subunit A of SecA preprotein translocase (secA1), 65 kDa heat shock protein (hsp65), and RNA polymerase (rpoB). Interestingly, three-(gyrB+16S+secA1) locus MLSA was nearly as reliable as five loci MLSA [33]. While approaches developed in this study should be generalizable to other gene targets and indeed other bacterial species, the sampling bias may add artificial gaps that disrupt any perceived seamless spectrum of species and therefore should be acknowledged as a potential limitation of this study. It also remains to be confirmed whether techniques that have been successful on the clonal microorganism likeNocardiawould work equally well with other microorganisms, especially with bacteria that are more prone to the lateral gene transfer. Care should be also taken when analysing the diversity of gene sequences submitted to DDBJ/EMBL/GenBank prior to 1995, when automated sequencing technologies with higher fidelity first became available. The quality and length of sequences are important consideration since 16S rRNA based identification techniques may often suffer from a lack of phylogenetic information hitherto retrievable from the short 16S rRNA gene sequences [34]. We also tested other sequences clustering tools such as CD-hit [35] and CLANS (CLuster ANalysis of Sequences) [36], The first produced two clusters separating the unique N. seriolae (AB060281 & AB060282, represented by AB060281) from the rest of the sequences represented by N.
cyriacigeorgica AB094565. This occurred because the Cd-hit
employs a high sequence identity threshold. CLANS uses a version of the Fruchterman–Reingold graph layout algorithm to visualize pair-wise sequence similarities in either two-dimensional or three-dimensional space and couldn’t cluster the 364 sequences of average length 1442-bp due to the size of the dataset.
Our method requires neither the number of clusters nor the distances between clusters as input, as these would be difficult to derive for a set of unknown sequences. The method uses two sensitivity parameters: the number of hash codes to map to, and the number of codes to include in one cluster before starting the cut-off. Based on the sensitivity parameters, the number of clusters is produced, and after increasing the parameters to the saturation of the numeric differences in the distance matrix, a maximum number of clusters that can be numerically produced from any given dataset is reached. Similarly, the minimum number of clusters is defined. This feature is potentially very useful for the over- and under-classified datasets of highly clonal microorgan-isms. Another feature of the method is the identification of the sub-matrices of the distance matrix corresponding to the clusters produced. These sub-matrices can point to the sequence that is the closest to all other sequences in the same cluster to be selected as a centroid.
sequence length and potential quality, one would argue that our unsupervised clustering approach should be sufficiently robust to resist the data noise that multiple submissions from the same reference genomes might occasionally introduce. Our study has identified several sequences which were likely misclassified at the time of their submission or which classification had not kept up with changes inNocardiataxonomy. Our study is not a descriptive account on the changingNocardiataxonomy but a proof-of-concept experiment involving mathematically explicit study of sequence similarities with a machine learning component. While filtering for multiple sequences from the same original strains or potentially misclassified sequences has some appeal, this procedure can lead to considerable selection bias.
In conclusion, the identification of centroids of 16S rRNA gene sequence clusters using novel distance matrix clustering enables the identification of the most representative sequences for each individual species ofNocardiaand allows the quantitation of inter-and intra-species variability. The LM mapping algorithms based on multiple sequence alignments have demonstrated the important capacity to classify 16S rRNA gene sequences according to microbial species. Our findings have opened new opportunities in the optimisation of bacterial sequence-based species identification by applying sequence alignment and similarity assessments.
Materials and Methods
Datasets
The dataset was assembled containing 364 sequences of the 16S rRNA gene ofNocardiaspecies deposited in the GenBank [37,38]. The dataset represented 77 different Nocardia species whose identification was concordant with the List of Prokaryotic names with Standing in Nomenclature [39]. In addition, 110 16S rRNA gene sequences deposited in DDBJ/EMBL/GenBank but identi-fied only to theNocardiagenus level at the time of submission were used for machine learning experiments.
Clustering of sequences
The distance matrix was calculated for the dataset following the alignment of sequences using the Muscle algorithm [40]. The columns and the rows in this matrix were symmetric, and the distance on the main first diagonal was zero as it matched the same sequence to itself (Figure S1). The second diagonal (connecting the first column with the second row, the second column with the third row, and so forth) represented the distance between a sequence and the most similar sequence.
Four clustering methods were contrasted in the study. First, deterministic clustering was conducted using Cluto [44] with the partitional default functions, as deterministic methods are more relevant in the context of a dataset without missing values and allow the optimisation of clustering functions. The mountain view (Figure 4) produced by the Cluto [44] package was generated by applying Multidimensional Scaling to each of the cluster mid-points, preserving the distances between vertices as they were mapped from a high dimensional space down to a lower dimensional space. Second and third, commonly utilised non-deterministic hierarchical and k-means clustering methods [42] were implemented in MATLABH [43]. Last, a novel in-house algorithm [45] was compared with the above methods. The latter was based on the linear mapping of the distance matrix diagonal values. The similarity between sequences was represented as a ‘heat map’ with rectangular shapes. The shapes’ colours reflected the distance between sequences. The darkest blue shades were congregated along the diagonal as the boundaries around which the natural selection of a cluster
should be identified (Figure S1). The process of identifying these boundaries was based on the linear mapping of the second diagonal values to a normalized index value. These index values were then used to detect the break points that separated the clusters.
Clustering trees were constructed using distance measures from multiple sequence alignments [41]. Principal Components Anal-ysis (PCA) was used for the dimensionality reduction of the clustering structure [46]. Two-dimensional plots were constructed for the highest scoring principal components.
Identification of Reference Sequences
The most representative sequence for each cluster or reference sequence was defined as a ‘centroid’ of a cluster, from which the distances to all other points (sequences) were minimized. In other words, the reference sequences were ones that were the closest to all other sequences within the same cluster. This was done by identifying the sub-matrices that encapsulated each cluster sequence’s pair-wise distances, calculating the total distances from each sequence to all other sequences in the cluster, and identifying the sequence with the minimum total distance as the reference sequence.
Classification Methods
Naı¨ve Bayes classification and k-nearest neighbour (kNN) algorithms were implemented in MATLABH (www.mathworks. com). Methods from the Waikato Environment for Knowledge Analysis (WEKA) version 3.6.2 [46] were used to explore predictive models, including boosted decision trees (J48), support vector machines (SVM) with linear, quadratic and cubic kernels, naı¨ve Bayes (NB) classification andkNN. The NB) classifiers that assume Gaussian distributions and utilise the ‘diaglinear’ discriminant function (similar to the ‘‘linear’’ discriminant function, but with a diagonal covariance matrix estimate) were applied. kNN utilised a default Euclidean distance measure between the variables. The distance matrix was employed as a training dataset, considering each column (distances from the column corresponding sequence to all rows’ sequences in the dataset) as one variable (parameter). Then, all 16S rRNA sequences from fully identified isolates and the sequences from isolates identified only to a genus level were aligned in one dataset and another distance matrix was generated. This new distance matrix was reorganized so that only the unknown sequences remained in the rows, and only the known sequences remained in the columns. The new 3646110 matrix captured the distances
between the unknown sequences and the known sequences, and was used as the testing dataset.
Method validation and statistical analyses
The random sampling method was used in the K-means algorithm in MATLABH. The accuracy of the clustering was estimated by the mean value of the silhouette values for each cluster as follows:
Sð Þi~ðmin bð ði,:Þ,2Þ-að ÞiÞ:=max að ð Þ,min bi ð ði,:Þ,2ÞÞ,
Supporting Information
Figure S1 Heat map of the Nocardia distance matrix
based on the Muscle alignment, showing rectangles around potential clusters identified by the Linear Mapping with different sensitivity parameters.
(TIF)
Figure S2 Silhouette values for 77 clusters defined by k-means clustering.
(TIF)
Table S1 Total numbers of clusters generated by the linear mapping algorithms using different parameters.
(DOC)
Table S2 Linear mapping clustering using different colour map sizes and up to 4 colours per cluster for each map size.
(DOC)
Table S3 Nocardia clustering results for k-means,
hierarchical clustering algorithms, Cluto software, and PCA scores, clustered on the Euclidean distance for the first two principal components using the linear mapping clustering algorithm.
(DOC)
Table S4 Classification of Nocardia species using
different machine learning methods.
(DOC)
Author Contributions
Conceived and designed the experiments: MH FK SCAC VS. Performed the experiments: MH FK MB RC. Analyzed the data: MH FK SCAC MB RC VS. Contributed reagents/materials/analysis tools: MH FK MB RC. Wrote the paper: MH VS MB SCAC. Designed the software used in the analysis: MH.
References
1. Savolainen V, Cowan RS, Vogler AP, Roderick GK, Lane R (2005) Towards writing the encyclopedia of life: an introduction to DNA barcoding. Philos Trans R Soc Lond B Biol Sci 360: 1805–1811.
2. Hebert PD, Gregory TR (2005) The promise of DNA barcoding for taxonomy. Syst Biol 54: 852–859.
3. Conville PS, Murray PR, Zelazny AM (2010) Evaluation of the Integrated Database Network System (IDNS) SmartGene software for analysis of 16S rRNA gene sequences for identification ofNocardiaspecies. J Clin Microbiol 48(8): 2995–2998.
4. Nelson DM, Cann IKO, Altermann E, Mackie RI (2010) Phylogenetic evidence for lateral gene transfer in the intestine of marine iguanas. PLoS ONE 5(5): e10785.
5. Kong F, Chen SCA, Chen X, Sintchenko V, Halliday C, et al. (2009) Assignment of reference 59-end 16S rDNA sequences and species-specific sequence polymorphisms improves species identification of Nocardia. Open Microbiol J 3: 97–105.
6. Grenfell BT, Pybus OG, Gog JR, Wood JLN, Daly JM, et al. (2004) Unifying the epidemiological and evolutionary dynamics of pathogens. Science 303: 327–332.
7. Pybus OG, Rambaut A (2009) Evolutionary analysis of the dynamics of viral infectious disease. Nat Genetics Rev 10: 540–50.
8. Lancashire L, Schmid O, Shah H, Ball G (2005) Classification of bacterial species from proteomic data using combinatorial approaches incorporating artificial neural networks, cluster analysis and principal component analysis. Bioinform 21(10): 2191–2199.
9. Agius P, Kreiswirth BN, Naidich S, Bennett KP (2007) TypingStaphylococcus aureususing thespagene and novel distance measures. IEEE Trans Comput Biol Bioinform 4(4): 693–704.
10. Dutilh BE, He Y, Hekkelman ML, Huynen MA (2008) Signature, a web server for taxonomic characterization of sequence samples using signature genes. Nucl Acids Res 36: W470–474.
11. Sgourakis NG, Bagos PG, Papasaikas PK, Hamodrakas SJ (2005) A method for the prediction of GPCRs coupling specificity to G-proteins using refined profile hidden Markov models. BMC Bioinform 6: 104.
12. Karchin R, Karplus K, Haussler D (2002) Classifying g-protein coupled receptors with support vector machines. Bioinformatics 18: 147–159. 13. Baldi P, Chauvin Y, Hunkapiller T, McClure MA (1994) Hidden Markov
models of biological primary sequence information. Proc Natl Acad Sci USA 91: 1059–1063.
14. Krogh A, Brown M, Mian I, Sjo¨lander K, Haussler D (1994) Hidden Markov models in computational biology. J Mol Biol 235: 1501–1531.
15. Saubolle MA, Sussland D (2003) Nocardiosis: review of clinical and laboratory experience. J Clin Microbiol 41: 4497–501.
16. Brown-Elliott BA, Brown JM, Conville PS, Wallace RJ, Jr. (2006) Clinical and laboratory features of theNocardiaspp. based on current molecular taxonomy. Clin Microbiol Rev 19: 259–82.
17. Roth A, Andrees S, Kroppenstedt RM, Harmsen D, Mauch H (2003) Phylogeny of the genusNocardiabased on reassessed 16S rRNA gene sequences reveals underspeciation and division of strains classified asNocardia asteroidesinto three established species and two unnamed taxons. J Clin Microbiol 41: 851–856. 18. Conville PS, Brown JM, Steigerwalt AG, Brown-Elliott BA, Witebsky FG (2008)
Nocardia wallaceisp. nov. andNocardia blacklockiaesp. nov., human pathogens and members of the ‘‘Nocardia transvalensis Complex’’. J Clin Microbiol 46(4): 1178–1184.
19. Clarridge JE, III (2004) Impact of 16S rRNA gene sequence analysis for identification of bacteria on clinical microbiology and infectious diseases. Clin Microbiol Rev 17: 840–62.
20. Janda JM, Abbott SL (2007) 16S rRNA gene sequencing for bacterial identification in the diagnostic laboratory: pluses, perils, and pitfalls. J Clin Microbiol 45: 2761–2764.
21. Conville PS, Witebsky FG (2007) Analysis of multiple differing copies of the 16S rRNA gene in five clinical isolates and three type strains ofNocardiaspecies and implications for species assignment. J Clin Microbiol 45: 1146–1151. 22. Konstantinidis KT, Tiedje JM (2005) Genomics insights that advance the species
definition for prokaryotes. Proc Ntl Acad Sci USA 102(7): 2567–2572. 23. Doolittle WF, Zhaxybayeva O (2009) On the origin of prokaryotic species.
Genome Res 19(5): 744–756.
24. Sintchenko V, Iredell JR, Gilbert GL (2007) Genomic profiling of pathogens for disease management and surveillance. Nat Microbiol Rev 5: 464–470. 25. Edgar R (2010) Big alignments — do they make sense? Robert Edgar’s Blog
(Available: http://robertedgar.wordpress.com/2010/05/02/big-alignments-do-they-make-sense/).
26. Needleman SB, Wunsch CD (1970) A general method applicable to the search for similarities in the amino acid sequence of two proteins. Mol Biol 48(3): 443–53.
27. Helal M, El-Gindy H, Gaeta G, Sintchenko V (2008) High performance multiple sequence alignment algorithms for comparison of microbial genomes. Proc 19th Int Conf Genome Informatics (GIW 2008), Gold Coast, Australia, 2008.
28. Steinke D, Vences M, Salzburger W, Meyer A (2005) TaxI: a software tool for DNA barcoding using distance methods. Phil Trans Royal Soc B 360: 1975–1980.
29. Davidsen T, Beck E, Ganapathy A, Montgomery R, Zafar N, et al. (2010) The comprehensive microbial resource. Nucleic Acids Res 38: D340–345. 30. Dehal PS, Joachimiak MP, Price MN, Bates JT, Baumohl JK, et al. (2010)
MicrobesOnline: an integrated portal for comparative and functional genomics. Nucleic Acids Res 38: D396–400.
31. Markowitz VM, Chen I-MA, Palaniappan K, Chu K, Szeto E, et al. (2010) The integrated microbial genomes system: an expanding comparative anlysis resource. Nucleic Acids Res 38: D382–390.
32. Christen R (2008) Identifications of pathogens—a bioinformatic point of view. Current Opin Biotechnol 19: 266–273.
33. McTaggart LR, Richardson SE, Witkowska M, Zhang SX (2010) Phylogeny and identification ofNocardiaspecies based on multilocus sequence analysis. J Clin Microbiol 48(12): 4525–4533.
34. Ho¨fle MG, Flavier S, Christen R, Bo¨tel J, Labrenz M, et al. (2005) Retrieval of nearly complete 16S rRNA gene sequences from environmental DNA following 16S rRNA-based community fingerprinting. Environ Microbiol 2005; 7(5): 670–675.
35. Li W, Godzik A (2006) Cd-hit: a fast program for clustering and comparing large sets of protein or nucleotide sequences’’. Bioinformatics 22: 1658–1659. 36. Frickey T, Lupas A (2004) CLANS: a Java application for visualizing protein
families based on pairwise similarity. Bioinformatics 20(18): 3702–3704. 37. Benson DA, Karsch-Mizrachi I, Lipman DJ, Ostell J, Sayers EW (2010)
GenBank. Nucl Acids Res 38(Suppl1): D46–51.
38. Xiao M, Kong F, Sorrell TC, Cao Y, Lee OC, et al. (2010) Identification of pathogenicNocardiaspecies by reverse line blot hybridization targeting the 16S rDNA and 16S–23S rDNA spacer regions. J Clin Microbiol 48(2): 503–511. 39. Euzeby JP (1997) List of bacterial names with standing in nomenclature: a folder
available on the Internet (http://www.bacterio.cict.fr/). Int J Syst Bacteriol 47: 590–592.
41. Felsenstein J (1989) PHYLIP - Phylogeny Inference Package (Version 3.2). Cladistics 5: 164–166.
42. Fielding AH (2007) Cluster and Classification Techniques for the Biosciences,
Cambridge University Press.
43. Gilat A (2004) MATLAB: An introduction with applications. 2nd Edition John Wiley & Sons.
44. Zhao Y, Karypis G (2002) Evaluation of hierarchical clustering algorithms for document datasets. Conf Information & Knowledge Manag, Nov 4–9 2002, McLean, Virginia, USA.
45. Manal H, Kong F, Chen SCA, Zhou F, Dwyer DE, et al. (2011) Linear normalised hash function for clustering gene sequences and identifying reference sequences from multiple sequence alignments. (Submitted).
46. Witten IH, Frank E (2005) Data mining: Practical machine learning tools and techniques, 2nd Edition Morgan Kaufmann, San Francisco.