THE IMPACT OF LABOUR MARKET INSTITUTIONS ON PRODUCTIVITY IN A SECTORAL APPROACH
Máté Domicián
University of Debrecen, Faculty of Economics and Business Administration, Finance and Controlling Department, H-4028, Hungary, Debrecen, Kassai Str. 26.
Abstract: This research paper aims for an empirical validation of the impact of labour institutions on productivity growth. The main objective of this study is to analyse labour and economic growth tendencies of the period between 1980 and 2008 in various OECD countries. In our estimations we followed a specific taxonomy to identify the main features of productivity (output per capita) growth in different labour-skilled branches. Besides determining the sectoral differences of labour demand by standard comparative statistics, we used in our model specification a dynamic panel regression method.
All in all, we conclude that the high-skilled branches achieved better economic growth performance than the lower-skilled ones in most of the OECD countries. Analysing the time series panel data of these countries we also claim that productivity growth was negatively correlated with unemployment benefits and employment legislation in the long run.
Keywords: labour market institutions, productivity changes, sectoral approach
JEL classification: E25, I23, O43
1. Introduction
The existence of labour economics is justified by the fact that, in industrialized countries, a large proportion of population is made up of wage-earners or those who aspiring to become employees (Cahuc and Zylberberg 2010). Nowadays, labour economics covers a very large range of economic and social problems, such as the causes of labour market imperfections (i.e. unduly low employment, durable involuntary unemployment, unaccepted causes of financial recessions etc.), which have played a greatening role in recent macroeconomic research.
The contribution of labour to economic growth became especially popular in historical research after the rise of human capital theories advocated by Becker (1964) and Schultz (1961) and growth theories first formalised by Solow (1954). Later, the oil-crisis of the 1980s and its consequences eventually revealed that it takes more than just physical and human capital to have economic growth (Földvári and Leeuwen 2007). This made it possible to introduce labour institutions in new theories dealing with endogenous economic growth. However, unlike the neo-classical approach long-run economic growth should be determined within the models rather than being exogenously assumed (Czeglédi 2010).
Recently, serious debates have taken place in an attempt to explain the role of institutions. Labour market institutions are system of laws, norms, or conventions resulting from a collective choice and providing constraints or incentives that alter individual choices over labour (Boeri and van Ours (2008). However, as North (1991) claimed that institutions matter, essentially no clear consensus has yet emerged to answer how they impact on productivity, and also what kind of characteristics they should have in economies.
In this study the relationship between employment and economic growth is examined in the context of new institutional economics. Basically, the structure of labour was stimulated directly by the distribution of employment and/or output growth. Thus, in our estimations the time horizon was also a key determinant. Traditionally, in macroeconomics there are three opportunities. (1) In the short run, because of price rigidity, it is generally accepted that physical and human capital are certainly not fully exploited by economic actors. However, in the long run (2) both of them are fully utilized in the case of price adjustment. However, in the very long run (3) other economic factors, such as technology or institutions, can be also changed.
The main purpose of this study is to investigate a valid relationship among labour market institutions and productivity growth in the very long run. The rest of this paper is structured as follows. In the next sections we will briefly describe the sectoral features of output and employment structure with common descriptive statistics. In our estimations we follow a specific taxonomy to identify the main features of productivity growth in different labour-skilled branches. Then we will carry out a dynamic regression analyses with cross-industry panel data in order to investigate how employment, institutions effects on economic growth per capita. The paper ends with a brief conclusion and some policy implications.
2. Industry structure analysis and taxonomy
A unique database has been constructed for the analysis of economic and employment growth by the EU KLEMS (2003) Project. This project aims to create a database, which include measures of output, productivity, employment creation, capital formation etc. at the industry level for OECD countries from 1970 onwards. The last (March 2011) release of the KLEMS database provides data up to 2008 for a limited set of variables in different industries. Hence, in our estimations we should use the given time series of gross value added (GVA) in constant (1995) prices. The gross value added is often used in economics as the value of goods and services produced in an industry or sector of an economy. Basically, GVA is equivalent to output (GDP) less intermediate consumption. The numbers of persons engaged in 56 industries were separated by the Indicators of activities for Industry and Services, based on ISIC Rev 3. In our estimations we also need the share of investment within output for each OECD country, which is available from the Penn World Table (PWT), included in Heston et al. (2006), and the data of labour market institutions from the OECD (2014) database.
examination of employment growth, which is one of the indicators most readily associated with increases in productivity growth.
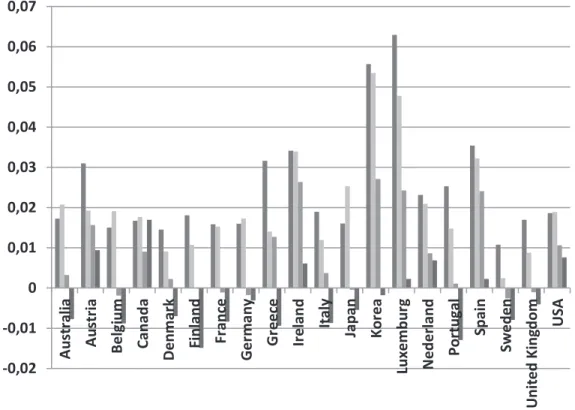
Figure 1. Average employment growth rates (%) of OECD countries in each different labour skilled group, 1980-2008
Source: own calculation based on EC KLEMS (2014).
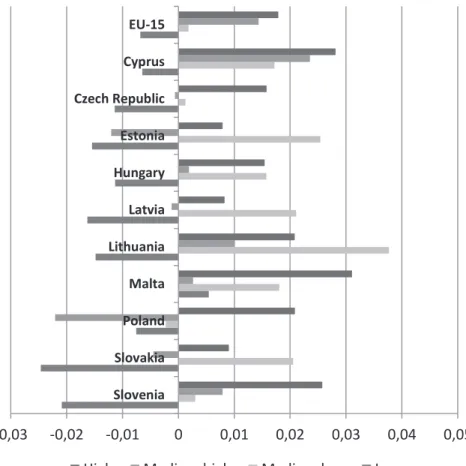
Figure 1. and 2. reflect employment growth rates in the same industries and time periods. The average annual employment growth rates in the high-skilled branches (HS and HIS) in all examined OECD countries were higher than in the lower skilled ones. This might anticipate an increasing role of human capital in labour demand. Moreover, in some smaller EU member states, such as in Cyprus and Slovenia, there was a larger proportion of employment growth in the high-skilled industries than the EU-15 averages. Furthermore, the employment growth was negative in the low-skilled (LS) sectors in several OECD countries. The only exception was Malta, in the period 1995-2008.
-0,02 -0,01 0 0,01 0,02 0,03 0,04 0,05 0,06 0,07 A u st ra li a A u st ri a B e lg iu m C a n a d a D e n m a rk Fi n la n d Fr a n ce G e rm a n y G re e ce Ir e la n d It a ly Ja p a n K o re a Lu x e m b u rg N e d e rl a n d P o rt u g a l S p a in S w e d e n U n it e d K in g d o m U S A
Figure 2. Average employment growth rates (%) of new EU countries in each different labour skilled group, 1995-2008
Source: own calculation based on EC KLEMS (2014).
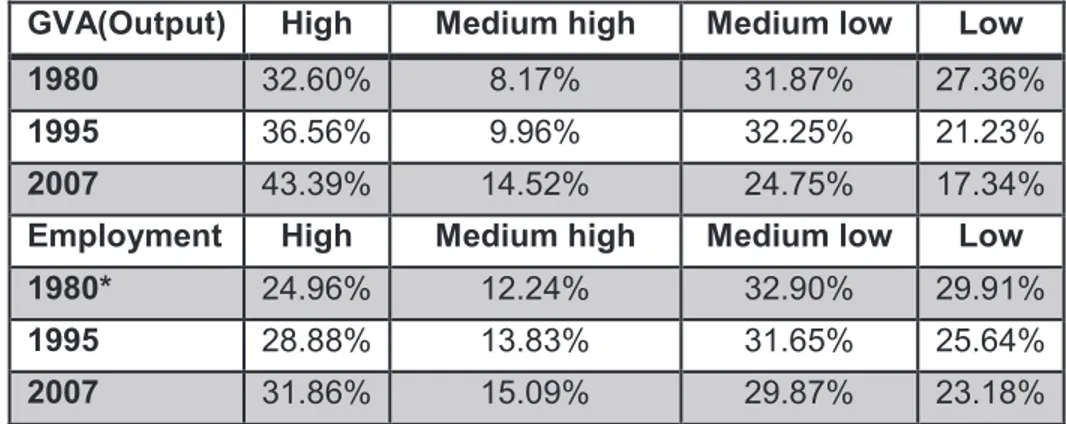
The industry structure should be described by using the distribution of output and employment to aggregate level of OECD countries. Table 2 represents value added (GVA) and employment shares of aggregate output over three years (1980, 1997 and 2008). In 1980, the majority proportion (59%) of economic growth stemmed from the LS and LIS sectors, but particularly by 2008 it decreased to 48%. However, the total distribution position differs across the OECD, we conclude that the high-skilled branches have achieved better economic growth performance than the lower skilled ones. When we estimated employment growth, the same tendencies of sectoral shifts also seemed to appear. Though, the employment share obviously increased in the HS and HIS branches (from 40% to 47%), the decreasing labour demand for low-skilled workers was still higher than in our estimations.
-0,03 -0,02 -0,01 0 0,01 0,02 0,03 0,04 0,05
Slovenia Slovakia Poland Malta Lithuania Latvia Hungary Estonia Czech Republic Cyprus EU-15
Table 2. Output and employment distribution of OECD countries in each labour-skilled sector
GVA(Output) High Medium high Medium low Low
1980 32.60% 8.17% 31.87% 27.36%
1995 36.56% 9.96% 32.25% 21.23%
2007 43.39% 14.52% 24.75% 17.34%
Employment High Medium high Medium low Low
1980* 24.96% 12.24% 32.90% 29.91%
1995 28.88% 13.83% 31.65% 25.64%
2007 31.86% 15.09% 29.87% 23.18%
Source: own calculation based on EC KLEMS (2014).
Notes: *except CYP, CZE, EST, HUN, LTU, LTV, MLT, POL, SLK and SLV
3. An empirical approach of dynamic productivity changes
In the neo-classical growth models, from the 1950s by Solow (1956), no special attention was given to institutions. Basically, it was argued that the growth of physical and human capital had an effect on the growth of GDP while the unexplained residual, labelled Total Factor Productivity (TFP) could not be measured directly. TFP is a ‘multi-factor’ variable, which accounts for effects in total output that can be taken as a measure of technological changes of economy and also the impact of institutions.
First, we focus on a well-known economic growth model promoted earlier by
Mankiw et al. (1992). Our starting point is a Cobb-Douglas production function,
so production at time [t] can be written as:
a a
t t
t
t
A
L
K
Y
=
(
)
1- (1)The notation is standard, where [Y] represents output, [A] is the variable of ‘total factor productivity’, [K] and [L] are capital and labour. Thus, we assume a constant return to scale and the magnitude of (1-α) should correspond roughly to the labour income share in total GDP, which is close to 2/3 in most countries.
There is an alternative way to express the role of institutions in this model, according to Mankiw et al (1992). First, denote [Y/L], as output per capita, and the logarithm of Equation (1) for the steady state level of productivity. Then, use the rate of investment in physical capital [sk] and the rate of employment growth [n]. We also assume that the technological growth [g] is constant across countries, because [g] reflects primarily the advancement of knowledge and there is no either strong reason to expect also depreciation rates [δ] to vary greatly as well. We also assume that ln[A] = [X], which is in this model a vector that capture the impact of institutions and [e] represents country-specific shocks. Hence, the log income per capita at a given time [t] equals with the following: t t t t k t X g n s L Y
e
a
b
d
a
a
a
a
+ -+ + + -= ÷ ø ö ç è æ ) ln( 1 ) ln( 1 ) ln( 1 ln (2)labour and productivity. After having demonstrated the existence of a systematic relationship between industrial structure of labour demand and income level, we will examine the impact of labour institutions on economic growth per capita. Taking into account new endogenous growth theories our model includes the lagged dependent variables among the repressors’.
A dynamic specification requires a specific instrumentation of lagged endogenous variables, for which we used the empirically offered GMM estimators developed by Arellano and Bond (1991). These methods employ lagged levels of dependent and predetermined variables, as well as differences between the exogenous variables as instruments.
In our dynamic model specification economy tends toward long run equilibrium. The extent of economic growth generally affects the rate at which output per capita approaches its steady state value. After taking the first differences of the dependent variables of Equation (2), our model assumes the following formula:
it it it
it k it
o
it
Y
s
n
g
X
e
Y
=
+
D
+
+
+
+
+
+
D
ln
b
b
1ln
-1b
2ln(
)
b
3ln(
d
)
b
4ln(
)
(3)Note: Δvar - variable in first differences, Δvart-1 - lagged differences, ln - in logarithm.
The variables refer to the following. The independent variable [Yi,t] is the ratio of a real GVA per capita of country [i] for the period [t] at a constant price (1995). The first dependent variable is the first lag of productivity growth. [sk] is the share of investment within sectoral output and [n] is the average growth rate of labour in each branches. The rate of [g] and depreciation [δ] here assumed to be 0.05, as in Mankiw et al. (1992). We also assumed that labour market institutions were given as cross-country specific variables for each branch. Hence, [X] is a vector, which indicates the impacts of labour market institutions and [e] is the error term.
The long run GDP per capita, the investment ratio, the engaged employment [n] and the institution variables are refer to the period between 1980 and 2008. All in all, we have an unbalanced panel date of 30 OECD countries to measure the relationship between labour institutions and long run output per capita in different labour-skilled branches.
Table (3.) represents the corresponding results for the one-step GMM estimators. Although, the two-step estimator should theoretically be preferred experimentally, but both estimations appeared to produce similar outcomes and we demonstrated the first one to assess the validity of comparisons. In this table we find a valid representation of the relationship between institutions and productivity growth. At the bottom section of this table we presented the results of AR(1) and Wald tests to demonstrate the result of autocorrelation and over-identifying restrictions. The significance levels of these tests in all models suggested that the dynamic specification should be preferred.
The impact of lagged real GVA per capita, however, is not robust in the high- and low-skilled sectors, but in other branches there are significant and positive z-statistics. Moreover as theoretically expected, If we have a continuous time, an increase in the share of investment within GDP [sk] in both sectors claim a positive (pro-cyclical) impact on productivity growth (the only exception is the LS sectors). The lack of significance in this case only means that changing investment does not indicate productivity growth in this branch at a given level of output per capita and other determinants.
Table 3. Dynamic panel regression of real GDP (GVA) per capita, 1980-2008
Dependent
Variable Δln(real GVA per capita)it Independent
variables High (HS) Medium high
(HIS)
Medium low
(LIS) Low (LS)
constant −0.385 0.318 −1.149 -0.725 −1,192 −1.008 −0.075 0.016
(-1.49) -0.77 (-2.81)*** (-1.99)** (-3.16)*** (-2.02)** (-0.32) -0.05
Δln(Y)it-1 -0.221 -0.464 0.479 0.281 0.145 0.184 0.562 0.442
(-0.72) (-1.38) (3.07)*** (1.81)* -0.85 -1.1 (4.44)*** (2.08)*
ln(sk)it 0.166 -0.061 0.418 0.305 0.423 0.264 0.045 0.008
(2.314)* (-0.45) (3.13)*** (2.57)*** (3.5)*** (1.66)* -0.59 -0.08
ln(ni+g+δ)t −0.417 −0.267 −0.813 −0.668 −0.515 −0,509 −0.421 −0.42
(-1.83)* (-1.52)* (-5.14)*** (-4.03)* (-3.89)*** (-3.76)** (-3.84)** (-2.51)**
ln(UBs)it −0.075 0.005 −0.051 -0.006
(-2.61)*** (-0,23) (-1.84)* (-0.28)
ln(EPL)it −0.725 −0.122 0.049
(-2.38)** (-1.76)* (-0.78)
Number of instruments
60 58 60 55 60 50 60 57
Number of countries
30 30 30 30 30 30 30 30
Wald-test 7.17* 10.48** 26.74*** 21.89*** 18.18*** 18.49*** 61.50*** 19.51***
AR-test (-2.83)*** (-2.79)*** (-2.43)** (-2.41)** (-3.45)*** (-3.47)*** (-3.45)*** (-3.35)***
Source: own calculation based on EC KLEMS (2014), OECD (2014) and Heston et al. (2006) databases.
Notes: * Heteroscedasticity robust z-statistics are in parentheses. Letters in the upper index refer to ***: significance at 1 per cent, **: 5 per cent, *: 10 per cent. P-values without an index mean that the coefficient is not significant even at the 10 per cent level.
Using our dynamic model specification of Equation (3) we established the impacts of labour market institutions from the available EC and OECD databases. Although the unions, minimum wages, active labour market policies (ALMPs) were tested as well, only the unemployment benefits (UBs) and employment protection legislation (EPL) have significant statistics in our model.
The impact of unemployment benefits according to the theory is not consistent. The UBs protect against uninsurable labour market risks and offer replacement income to workers experiencing unemployment after having lost their jobs. Nowadays all OECD countries have an unemployment benefit system in place. However, in each of them strict legislation and norms operate. In the labour market UBs affect outcomes via three channels (Cahuc and Zylberberg 2010). (1) They increase the reservation wage of recipients because they make workers “choosier” when deciding upon available jobs. (2) They also improve the “fall-back” option of workers and increase wage claims at bargaining. Finally, (3) they induce more people to participate in the labour market insofar as they increase the value of employment over inactivity.
to be large. The effect of 1% increase in the level of UBs resulted in a decrease of GDP per capita at 0.07 and 0.05 percentage point in the HS and LIS sectors. Although, there is no significant z-statistic in the LS branches, the UBs are obviously controversially correlated with productivity growth in each sector.
The employment protection legislation (EPL) is a set of mandatory restriction governing the dismissals of employees (Boeri et al. 1999). Their main purpose is to increase the volume and stability of employment. Despite this there is an intense debate of their actual effects because of the mixed empirical evidences. Essentially, the EPL regulations may affect the equilibrium level of employment and productivity in different ways. By reinforcing job security, EPL may enhance productivity performance, as workers will be more willing to cooperate with other employers in the development of production process (Akerlof 1984).To the extent that EPL leads to long-lasting work relationships, it may encourage employers to provide training to workers with potentially beneficial effects on human capital and labour productivity. A better skilled workforce may also increase flexibility and finally lead to a better functioning of production activity (Piore 1986). However, if regulation is very strict, as in many European countries, firms may become more cautious about adjusting their workforce with the ultimate effect of reducing labour turnover, e.g. movements from employment to unemployment and vice to versa (Bertola 1992). From our result we stated that an increase in EPL in the OECD countries might reduce productivity growth in both of the high and low (HIS and LIS) labour-skilled sectors.
4. Conclusion
In this paper we had two primary objectives. Our first objective was to analyse economic and employment growth tendencies for the period 1980-2008 in various OECD countries. From our results we claimed that the average annual employment growth rates in the high-skilled branches were higher than in the lower skilled ones. Moreover, from 1980 to 2007 in the HS and HIS branches the employment share obviously increased. These tendencies anticipated an increasing role of human capital over the next decades, but in spite of the decreasing demand for low-skilled workers, it was still higher than in our estimations.
The second objective was to examine the impact of institutions on economic growth per capita. Our dynamic panel regression model yields a valid negative relationship between labour and productivity growth in both sectors. All in all, we found that, the high-skill (HS) intensive branches might affect productivity growth least of all. We claimed also that the changes of unemployment benefits (UBs) and the employment legislation (EPL) is controversially correlated with productivity growth.
As a consequence, ceteris paribus, we consider the following government policies from our model representation. Given that the mainstream macro policies aimed at promoting stable and long run economic growth we could offer to aid the high-skilled employment branches if it will affect the basic economic demand structure. In particular, our analysis suggested that policy makers must try to increase the degree of competition in labour markets; i.e. by motivating the skilled workers to learn more for better productivity growth. Moreover, we believe that lower level of unemployment benefits and less regulated (strict) labour markets are needed for better economic performance.
usually reflected by a low positive and significant coefficients {see Barro and Lee (1993), Cohen and Soto (2001) etc., except in the famous study of Benhabib and Spiegel (1994)}. However, our empirical findings could only demonstrate the relationship between only few labour institutions (UBs, EPL) and productivity growth in the long run, since there is currently no unambiguous evidence to identify the impact of other ones, such as ALMPs, labour unions, tax wedges etc. on output per capita in different labour-skilled sectors. Hence, further research in these approaches could be fruitful as well.
5. Acknowledgements
This research was realized in the frames of TÁMOP 4.2.4. A/2-11-1-2012-0001 „National Excellence Program – Elaborating and operating an inland student and researcher personal support system” The project was subsidized by the European Union and co -financed by the European Social Fund.”
References
Akerlof, G. (1984) An Economist’s Book of Tales, Cambridge University Press, Cambridge.
Arellano, M. – Bond, S. (1991) Some Tests of Specification for Panel Date: Monte Carlo Evidence and an application to Employment Equations, Review of Economic Studies, 58, pp. 277–297.
van Ark, B. – Robinson, C. – Stokes, L. – Stuivenwold, E. (2003) Industry Structure and Taxonomies, pp. 37–72, in O’Mahony, M. – van Ark B. (ed.) EU Productivity and Competitiveness: An Industry Perspective. Can Europe Resume the Catching-up Process? EC, Italy. pp. 160.
Barro, R. J. – Lee, J. W. (1993) Institutional Comparisons of Educational attainment, Journal of Monetary Economics, 32(3), pp. 363–394.
Barro, R. J. – Sala-i-Martin, X. (1997) Technological Diffusion, Convergence, and Growth. Journal of Economic Growth, 2(1) pp. 1–27.
Becker, G. S. (1964) Human Capital, New York: NBER.
Benhabib, J. – Spiegel, M. M. (1994) The Role of Human Capital in Economic Development: Evidence from Aggregate Cross-Country and Regional U.S. Data, Journal of Monetary Economics, 34(2), pp. 143–173.
Boeri, T. – van Ours, J. (2008) The Economics of Imperfect Labor Markets, Princeton University Press. New Yersey.
Boeri, T. – Nicoletti, G. – Scarpetta, S. (1999) Regulation and Labour Market Performance, GIER Working Paper No. 158.
Cahuc, P. – Zylberberg, A. (2010) Labor Economics, Cambridge MIT Press, London. Cohen, D. – Soto, M. (2001) Growth and Human Capital: Good Data, Good Results, Journal of Economic Growth, 12(1), pp. 51–76.
Czeglédi, P. (2010) Individual Rights as a Factor of Economic Convergence, Acta Oeconomica, 60(4), pp. 375–403.
EC (2014) EU KLEMS Database, http://www.euklems.net/ (last downloaded: 2014.01.16.) Földvári, P. – Leeuwen, B. van (2008) Human Capital and Economic Growth in Asia 1890-2000: a Time-series Analysis. Asian Economic Journal, 22(3), pp. 225–240.
Gwartney, J. – Lawson, R. – Holcombe, R. G. (1999) Economic Freedom and The Environment for Economic Growth. Journal of Institutional and Theoretical Economics, 155(4), pp. 643–663.
Mankiw, G. N. – Romer, P. M. – Weil, D. N. (1992) A Contribution to the Empirics of Economic Growth, The Quarterly Journal of Economics, 107(2), pp. 407–437.
North, D. C. (1991) Institutions, Institutional Change, and Economic Performance, Cambridge University Press, Cambridge.
Piore, M. (1986) Labour Market Flexibility, University of California, Berkeley, CA. OECD (2014) OECD Stat Database, (last downloaded: 2014. 01.16.)
http://stats.oecd.org/Index.aspx?DatasetCode=RHMW ,
Schultz, T. (1961) Investment in Human Capital, American Economic Review, 51(1) pp. 1–17.