Is the decrease of fertility a consequence of the postponement
of the Entrance in the labour market?
Rebelo dos Santos, José, Escola Superior de Ciências Empresariais do Instituto Politécnico de Setúbal, Departamento de Comportamento Organizacional e Gestão de Recursos Humanos
Campus do IPS, Estefanilha,2914-503 Setúbal, Portugal, E-mail: [email protected]
Mendes, Maria Filomena, Universidade de Évora, Departamento de Sociologia, Largo dos Colegiais, 2 7000-803 Évora, Portugal, E-mail: [email protected]
Abstract
As the postponement in the age of entrance into the labour market and the fertility decline in Portugal are a primary concern in Society it is important to understand the patterns associated with this issue.
Data from the Portuguese Labour Force Survey (LFS) - data source: National Statistical Institute - from 1998 to 2004 was utilised in order to study the evolution of the entrance age into the labour market and the
relationships between entrance age, sex and education level.
The multinomial logit model evidenced that being a woman, being younger or having a higher qualification implied a later entrance age into the labour market, while being a man, being older or having lower qualifications were involved in an earlier entrance into the labour market.
Keywords: age of entrance, labour market, fertility, multinomial logit
Introduction
In this study, it was first analysed the relationship between entrance age into the labour market and sex, age and educational level. Next, it was described the relationship between the late entrance and the fertility decline in Portugal. To estimate the age of entrance in the labour market it was utilised data from the Portuguese Labour Force Survey (National Statistical Institute) from 1998 to 2004 and a multinomial logit model.
1. Evolution of the age of entrance into the labour market
The recent literature concerning the entry of young people into the labour market focuses empirically mainly on the differences between sex and educational level and few studies consider the variations of the age of entrance into the labour market according to the different groups of ages. In Portugal, studies on the relationship between educational levels and rates of participation in the labour market showed that higher qualification implied more chances of participation (Dias and Mata, 1997) although the entrance into the labour market happens mainly when people are aged from 20 to 29 years (Santos and Mendes, 2007). The rate of participation of the female was quite lower than the rate of participation of the male and the female entrance into the labour market happened at older ages (Dias and Mata, op. cit.).
1.1. Descriptive statistics
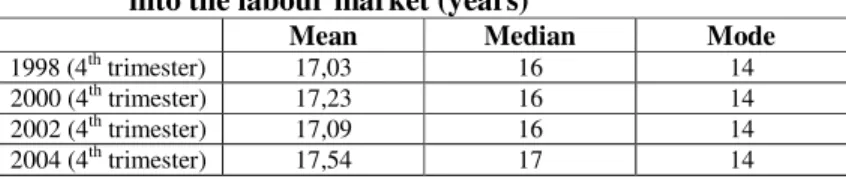
Table 1 provides the descriptive statistics concerning the age of entrance into the labour market.
Table 1 – Mean age, median age and modal age of entrance into the labour market (years)
Mean Median Mode
1998 (4th trimester) 17,03 16 14
2000 (4th trimester) 17,23 16 14
2002 (4th trimester) 17,09 16 14
2004 (4th trimester) 17,54 17 14
Source: INE, data from LFS 1998, 2000, 2002, 2004
In 1998, the median age of the entrance in the labour market was 16 years and the median 17, 03 years. In 2004, the median age was 17 years and the average age 17, 54 years. This analysis showed that the age of entrance slightly increased every year. There was a substantial decrease of the percentage of active population in the group aged from 15 to 19 years, and a lower decrease of that percentage in the group aged from 20 to 24 years, which illustrate a delayed entry of young people into the labour market (table 2).
Table 2 – Active population (%) by group of ages (years)
1998 (4th trim.) 23,3 60,2 75,3 72,6 67,2 64,7 60,2 49,9 36,3 20,5
2000 (4th trim.) 23,4 59,9 76,4 74,0 71,4 64,9 59,5 50,8 36,9 22,1
2002 (4th trim.) 22,4 63,0 79,0 75,5 71,0 68,1 63,3 53,3 39,4 22,3
2004(4th trim.) 17,8 59,2 79,1 79,7 73,9 70,7 65,4 57,4 42,3 21,8
Source: INE, data from LFS 1998, 2000, 2002, 2004
In all the other groups there was an increase in the percentage of active population. The higher increase was observed in the groups aged from 50 to 54 and from 30 to 34 years. In Table 3 are expressed the percentages of students in each age group. There is evident a substantial increase in that percentages in the groups aged from 15-19 (68,4% to 75,4%) and from 20-24 years (25,5 to 33,6). The increment was quite lower (5,1% to 6,6%) in the group aged 25-29 years. This means that the youngest continued their studies until older ages.
Table 3 - Percentages of students in the different age groups
15-19 20-24 25-29 30-34
1998 (4th trim.) 68,4 25,5 5,1 0,5
2000 (4th trim.) 67,6 29,0 6,0 0,5
2002 (4th trim.) 69,6 27,1 5,3 0,7
2004 (4th trim.) 75,4 33,6 6,6 0,5
Source: INE, data from LFS 1998, 2000, 2002, 2004
Comparing data from Tables 1 and 2 and Graphic 1 we verified that in the years where the mean age of entrance increased - resulting in a less significant level of participation in the labour market - there was a decrease in the total fertility rate (with exception for the case of 2000). This year has been very atypical in the Portuguese fertility context. The increment in the TFR observed in 2000 could be related with the attraction experienced by parents relatively to the number 2000 (and the beginning of the new century) when they decided the timing of childbearing.
Graphic 1 – Evolution of the total fertility rate (TFR) in Portugal from 1998 till 2004
T otal fertility rate (T FR)
1,35 1,40 1,45 1,50 1,55 1,60
1998 2000 2002 2004
Source: INE
1.2. Multinomial logit
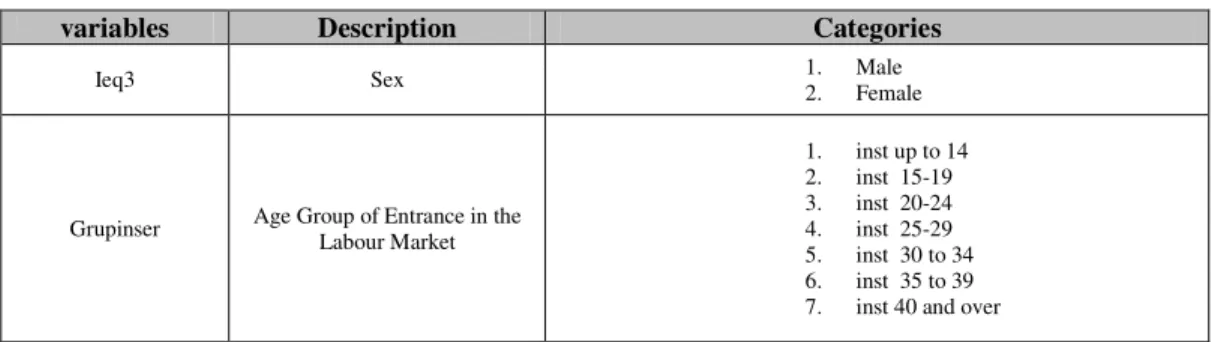
In order to study the relationships between the evolution of the age of entrance into the labour market and the age groups, sex and educational level, we utilised a logit multinomial analysis. In Table 4 are presented the variables utilised.
Table 4 – Means of the selectedvariables used in Multinomial logit
variables Description Categories
Ieq3 Sex 1.2. Male Female
Grupinser Age Group of Entrance in the Labour Market
Grupoetario Age Group
1. 15-19 years old 2. 20 - 24 3. 25 - 29 4. 30 - 34 5. 35 - 39 6. 40 - 44 7. 45 - 49 8. 50 - 54 9. 55 - 59 10. 60 - 64
Instrnivel Level of Education
1. less than elementary 2. elementary education 3. secondary education 4. tertiary education
dependent variable Description Categories
Grupinser Age Group of entrance 7 categories
independent variables Description Categories
Female Female Female=1 if ieq=2, female=0 others
Male Male Male =1 if ieq3=1,male =0 others
age15-19 15-19 years old Age 15 to19 =1 if grupoetario =1, age 15 to 19 = 0 others age20-24 20-24 years old Age 20 to 24 =1 if grupoetario =2, age 20 to 24 = 0 others age25-29 25-29 years old Age 25 to 29 =1 if grupoetario =3, age 25 to 29 = 0 others age30-34 30-34 years old Age 30 to 34 =1 se grupoetario =4, age 30 to 34 = 0 others age35-39 35-39 years old Age 35 to 39 =1 se grupoetario =5, age 35 to 39 = 0 others age40-44 40-44 years old Age 40 to 44 =1 se grupoetario =6, age 40 to 44 = 0 others age45-49 45-49 years old Age 45 to 49 =1 se grupoetario =7, age 45 to 49 = 0 others age50-54 50-54 years old Age 50 to 54 =1 se grupoetario =8, age 50 to 54 = 0 others age55-59 55-59 years old Age 55 to 59 =1 se grupoetario =9, age 55 to 59 = 0 others age60-64 60-64 years old Age 60 to 64 =1 se grupoetario =10, age 60 to 64 = 0 others Seminstr Less than elementary seminstr=1 if instrnivel=1 seminstr=0 others
Instrbas Elementary instrbas=1 se instrnivel=2, instrbas=0 others Instrsec Secondary instrsec=1 se instrnivel=3, instrsec =0 others Instrsup Tertiary instrsup=1 se instrnivel=4, instrsup=0 others
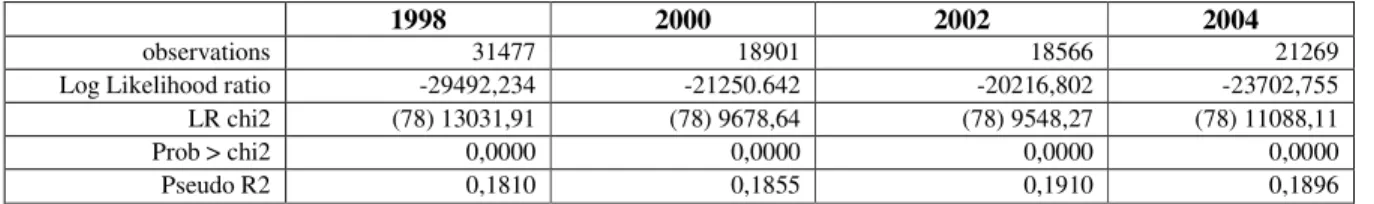
The categories used as base outcomes were: concerning the dependent variable, the category 1 (up to the age of 14). In the case of the independent variables: in what concerns the variable “age group”, the category 10 (the 60-64 years old); and the category 4 (persons without any educational level) for “educational level” and the category male for “sex”. The models showed significance (Table 5), presenting not significant values only in the cases of the variables that were excluded in Table 6.
Table 5 – Estimated Results (1998-2004)
1998 2000 2002 2004
observations 31477 18901 18566 21269 Log Likelihood ratio -29492,234 -21250.642 -20216,802 -23702,755 LR chi2 (78) 13031,91 (78) 9678,64 (78) 9548,27 (78) 11088,11 Prob > chi2 0,0000 0,0000 0,0000 0,0000 Pseudo R2 0,1810 0,1855 0,1910 0,1896
Source: INE, data from LFS 1998, 2000, 2002, 2004; Note: All variables are dummies, except “Grupinser”
The results can be summarized as follows: the age of entrance was, in general, later for females; persons with secondary and higher education levels entered, mainly, when aged from 25-35 years. The entrances more early occurred especially in male’s case that, in the moment of the inquiry, had between 35 and 49 years old.
Table 6 – Logit - Age of entrance into the labour market, by age group, sex and educational level
Grupinser (Age Group of Entrance) Independent
variables RRR1998 RRR2000 RRR2002 RRR2004
2 (15-19) age15-19 11.20404 24.56862 31.27961 35.58731
2 (15-19) age20-24 1.884252 10.32792 14.45849 22.42344
2 (15-19) age30-34 .6932585 3.894915 4.089633 5.021401
2 (15-19) age35-39 .6488141 3.454199 3.500308 3.495164 2 (15-19) age40-44 .4396577 2.179998 2.858849 3.342867
2 (15-19) age45-49 .4335054 1.946375 1.824333 1.879027
2 (15-19) age55-59 .6943375 1.447779 1.233261 1.288531 2 (15-19) Female 2.450243 1.220336 1.163481 1.194644
2 (15-19) tertiary education 6.63244 19.49405 15.37659 16.11067
2 (15-19) secondary education 10.4339 15.75912 10.90878 12.2597 3 (20-24) age20-24 8.320729 13.42397 20.54334 23.7503 3 (20-24) age25-29 5.909937 6.058392 8.262119 8.64275
3 (20-24) age30-34 5.357311 4.094558 3.70186 3.874705
3 (20-24) age35-39 4.475555 3.118894 3.764042 3.368265
3 (20-24) age40-44 2.941589 2.399196 3.377368 3.187563
3 (20-24) age45-49 3.171572 1.993571 2.372549 2.132731 3 (20-24) age50-54 2.443857 2.018817 2.287049 1.868291 3 (20-24) age55-59 1.907461 1.959879 2.023049 1.483726
3 (20-24) Female 2.288624 2.048803 1.876107 1.71808
3 (20-24) tertiary education 260.0046 290.5693 274.0443 148.4128
3 (20-24) secondary education 114.2221 74.72818 67.6913 33.84669
3 (20-24) elementary education 3.948603 3.350007 2.948226 1.679475
4 (25-29) age25-29 3.361504 3.523101 3.25679 3.901113 4 (25-29) age30-34 3.016863 2.926989 2.162893 2.640775
4 (25-29) age35-39 2.801518 2.619103 1.862497 1.77352
4 (25-29) age40-44 1.489127 1.494082 1.608889 2.114201 4 (25-29) Female 2.576331 2.25102 2.436635 1.800653
4 (25-29) tertiary education 364.4852 534.3868 448.094 212.9646
4 (25-29) secondary education 83.26218 58.97752 46.09533 18.15018 5 (30-34) Female 7.059765 6.726109 6.407277 4.322743 5 (30-34) tertiary education 83.00601 216.6682 114.8431 91.7766
5 (30-34) secondary education 33.92508 37.88794 22.66319 13.84554 5 (30-34) elementary education 3.228649 5.354673 2.517049 2.418828 6 (35-39) Female 24.28451 11.67763 16.67852 9.74077
6 (35-39) tertiary education 41.3503 34.15193 16.13819 14.58973 6 (35-39) secondary education 17.51219 7.114673 20.26054 4.331104 7 (40+) age40-44 .2051166 .0815604 .3400376 .4699622
7 (40+) Female 51.91474 86.99355 41.72085 73.7059
7 (40+) elementary education 3.0648 2.887524 2.045342 2.323472
Source: INE, data from LFS 1998, 2000, 2002, 2004
The logit model showed that being a woman, being younger or having a higher qualification implied a later entrance into the labour market. On the other hand, being a man, being older or having lower education implied an earlier entrance into the labour market.
Conclusions
The results revealed the postponement of the age of entry in the labour market due to the enlargement of the lifetime period of education andprobably, to the difficulty of getting a job. However there is no scientific information to support the later statement. The decrease of the total fertility rate that has been simultaneously verified, placing in risk the future replacement of the generations, can be associated to the referred postponement. This research is still in progress, so we expect to have soon some consistent findings that can tell us more about that association, specifically between the postponement of motherhood and first job participation.
References
Dias, M., (1997), “Transições no mercado de trabalho” in Boletim Económico do Banco de Portugal, Março, pp. 51-63.
INE (sd), Estimativas da População Residente e Estatísticas Demográficas, INE, Lisboa.
Santos, J. and M. Mendes, (2007), “Qualificações Académicas como chave para a entrada no mercado de trabalho: constatações a partir da análise dos Inquéritos ao Emprego de 1998 a 2004”, in IX Jornadas de