Article
A cluster method for finding node sets / sub-networks based on
between- node similarity in sets of adjacency nodes: with application
in finding sub-networks in tumor pathways
WenJun Zhang
1,
Xin Li
2 1School of Life Sciences, Sun Yat-sen University, Guangzhou 510275, China; International Academy of Ecology and Environmental Sciences, Hong Kong
2
College of Plant Protection, Northwest A & F University, Yangling 712100, China; Yangling Institute of Modern Agricultural Standardization, Yangling 712100, China
E-mail: [email protected], [email protected], [email protected]
Received 6 August 2015; Accepted 28 September 2015; Published online 1 March 2016
Abstract
A network consists of node sets or sub-networks. In present study, a cluster method for finding node sets /
sub-networks according to between-node similarity in sets of adjacency nodes was proposed. A typical
example demonstrated that the method is highly effective. Sub-networks in tumor pathways are identified.
Matlab codes of the method are presented.
Keywords
node sets; sub-networks; cluster analysis; similarity; sets of adjacency nodes; tumor pathways.
1 Introduction
Both network and sub-network are relative concepts. A network is usually a sub-network of a macro-network,
which forms a hierarchical structure of network. Finding node sets / sub-networks from a network is useful
for the analysis of network topology and structure. In this study, a cluster method for finding node sets /
sub-networks using between-node similarity in sets of adjacency nodes is proposed. It is demonstrated that
the method is effective. Meanwhile, sub-networks in tumor pathways are identified. Matlab codes of the
method are presented for further use.
2 Method
A network
X
with
m
nodes (Zhang, 2012b), its adjacency matrix is
a
=(
a
ij)
m×m.
a
ij=1, if two nodes
v
iand
v
jare
adjacent;
a
ij=0, if
v
iand
v
jare not adjacent, and
a
ii=0;
i
,
j
=1,2,…,
m
. Adjacency matrix
a
is a symmetric matrix,
i.e.,
a
=
a
’. Generally the nodes in a node set, with similar sets of adjacency nodes, have some of the similar
properties. A sub-network is a node set, and connections within the sub-network are much more than
connections towards outside the sub-network. The cluster method for searching node sets / sub-networks is as
follows.
Proceedings of the International Academy of Ecology and Environmental Sciences ISSN 22208860
URL: http://www.iaees.org/publications/journals/piaees/onlineversion.asp RSS: http://www.iaees.org/publications/journals/piaees/rss.xml
Email: [email protected] EditorinChief: WenJun Zhang
First, define between-node similarity as follows. For finding node sets
r
ij=
∑k
=1m(
a
ika
jk)/
m
i
,
j
=1,2,…,
m
;
i
j
where 0
r
ij
1.
r
ij=1, means that the sets of adjacent nodes of two nodes,
i
and
j
, are the same;
r
ij=0, means that
two nodes,
i
and
j
, do not share any adjacency nodes. For finding sub-networks
r
ij=
∑k
=1m(
a
ika
jk)/
m
a
ij=1
r
ij=0
a
ij=0
i
,
j
=1,2,…,
m
;
i
j
where 0
r
ij
1.
r
ij=1, means that the sets of adjacent nodes of two connected nodes,
i
and
j
, are the same;
r
ij=0,
means that two nodes,
i
and
j
, are unconnected.
Between-node distance is defined as
d
ij=1-
r
ijwhere 0
d
ij
1. Between-node similarity and distance matrices are all symmetric matrices, i.e.,
r
=
r
’, and
d
=
d
’.
Calculate between node set / sub-network distance. Suppose there are two node sets / sub-networks,
A
and
B
. Distance between
A
and
B
, based on the longest distance, is as the following
d
AB=
max
d
ij,
i
∈
A
,
j
∈
B
At the start,
m
nodes are
m
node sets / sub-networks respectively. In the sets of clusters (node sets /
sub-networks), choose two clusters with the minimum
d
ABto combine into a new cluster (new node set /
sub-network). Repeat the cluster procedure, until
m
nodes are eventually clustered into a cluster (network). If
the minimum
d
ABfor two or more cluster procedures are the same, only the last cluster procedure in these
cluster procedures is chosen for use.
For finding sub-networks, connectance of each sub-network is calculated. Connectance of a network
represents the connection intensity of the network. Connectance=number of actual connections/number of
potential connections (Zhang, 2011). The averaged connectance for each cluster procedure is calculated also.
According to connectance or other information, the classification for finding node sets / sub-networks at
certain hierarchical level can be determined.
The following are Matlab codes of the algorithm (detSubnetwworks.m)
%Reference: Zhang WJ, Li X. 2016. A cluster method for finding node sets / sub-networks based on between-node similarity in sets of adjacency nodes: with application in finding sub-networks in tumor pathways. Proceedings of the International Academy of Ecology and Environmental Sciences, 2016, 6(1): 13-23
str=input('Input the file name of adjacency matrix a (e.g., raw.txt, raw.xls, etc. Adjacency matrix is D=(dij)m*m, where m is the number of nodes in the network. dij=1, if vi and vj are adjacent, and dij=0, if vi and vj are not adjacent; i, j=1,2,…, m): ','s'); findwhat=input('Input a number to choose type of finding (1: Node sets; 2: Sub-networks): ');
a=load(str);
dim=size(a); m=dim(1); for i=1:m-1
if (findwhat==1)
r(i,j)=0;
for k=1:m
if ((a(i,k)==a(k,j)) & (a(i,k)~=0)) r(i,j)=r(i,j)+1; end
end
r(i,j)=r(i,j)/m; r(j,i)=r(i,j);
d(i,j)=1-r(i,j); d(j,i)=d(i,j);
end;
if (findwhat==2)
if (a(i,j)~=0)
r(i,j)=0;
for k=1:m
if ((a(i,k)==a(k,j)) & (a(i,k)~=0)) r(i,j)=r(i,j)+1; end
end
r(i,j)=r(i,j)/m; r(j,i)=r(i,j);
d(i,j)=1-r(i,j); d(j,i)=d(i,j);
else r(i,j)=0; r(j,i)=0; d(i,j)=1; d(j,i)=1;
end; end; end; end
d1=d;
bb1=1;
u(bb1)=0;
nu(bb1)=m;
for i=1:nu(bb1) x(bb1,i)=i; end
for i=1:nu(bb1) y(bb1,i)=1; end
while (nu(bb1)>1)
aa=1e+10;
for i=1:nu(bb1)-1
for j=i+1:nu(bb1)
if (d(i,j)<=aa) aa=d(i,j); end
end; end
aa1=0;
for i=1:nu(bb1)-1
for j=i+1:nu(bb1)
if (abs(d(i,j)-aa)<=1e-06)
aa1=aa1+1; v(aa1)=i; w(aa1)=j;
end; end; end
for i=1:nu(bb1) s(i)=0; end
nn1=0;
for i=1:aa1
if ((v(i)~=0) & (w(i)~=0))
nn1=nn1+1;
for j=1:aa1
if ((v(j)==v(i)) | (v(j)==w(i)) | (w(j)==w(i)) | (w(j)==v(i)))
s(v(j))=nn1; s(w(j))=nn1;
end
v(i)=0; w(i)=0;
end; end
for i=1:nn1
y(bb1+1,i)=0;
for j=1:nu(bb1)
if (s(j)==i)
for k=1:m
if (x(bb1,k)==j) x(bb1+1,k)=i; end
end
y(bb1+1,i)=y(bb1+1,i)+y(bb1,j);
end; end; end
for i=1:nu(bb1)
if (s(i)==0)
nn1=nn1+1;
for k=1:m
if (x(bb1,k)==i) x(bb1+1,k)=nn1; end
end
y(bb1+1,nn1)=y(bb1,i); end
end;
bb1=bb1+1;
u(bb1)=aa;
nu(bb1)=nn1;
for i=1:nu(bb1)-1
for j=i+1:nu(bb1)
d(i,j)=-1e+10;
for k=1:m
if (x(bb1,k)==i)
for kk=1:m
if (x(bb1,kk)==j)
if (d1(k,kk)>d(i,j)) d(i,j)=d1(k,kk); end
end; end; end; end
d(j,i)=d(i,j);
end; end
end;
for k=1:m y(bb1,k)=1; end
for i=bb1-1:-1:1
rr=0;
for j=1:nu(i+1)
ww=0;
for k=1:m
if (y(i+1,k)==j) ww=ww+1; v(ww)=k; end
end
vv=0;
ee=0;
for jj=ii-1:-1:1
if (x(i,v(ii))==x(i,v(jj))) y(i,v(ii))=y(i,v(jj)); break; end
ee=ee+1;
end
if (ee==ii-1) vv=vv+1; y(i,v(ii))=rr+vv; end
end
rr=rr+vv;
end; end
for k=1:bb1
rs(k)=1-u(k);
end;
s=1; i=0;
while (m>0)
ss=1;
for j=s+1:bb1
if (rs(j)==rs(s)) ss=ss+1; end;
end
s=s+ss; i=i+1;
la(i)=s-1;
if (s>=bb1-1) break; end
end
bb1=i;
yy=zeros(m);
for k=1:bb1
for i=1:nu(la(k))
for j=1:m
if (y(la(k),j)==i) yy(k,j)=i; end;
end; end; end
for k=1:bb1
rss(k)=rs(la(k)); uu(k)=u(la(k)); nuu(k)=nu(la(k));
end
k=1;
for i=1:nuu(1)
for j=1:m
if (yy(1,j)==i) vs(k)={j}; k=k+1; end
end; end
iss='';
for k=1:bb1
con=0;
iss=strcat(iss,'r=',num2str(rss(k)),'\n');
for i=1:nuu(k)
iss=strcat(iss,'(');
numm=0;
if (yy(k,j)==i) iss=strcat(iss,num2str(j),','); numm=numm+1; temp(numm)=j; end
end
iss=strcat(iss,')');
if (findwhat==2)
num=0;
for ii=1:numm-1
for j=ii+1:numm
if (a(temp(ii),temp(j))~=0) num=num+1; end
end; end
if (numm>1) connectance=num/((numm^2-numm)/2);
else connectance=0;
end
con=con+round(connectance*10000)/10000;
iss=strcat(iss,'(Connectance=',num2str(round(connectance*10000)/10000),')');
end; end
iss=strcat(iss,'\n');
if (findwhat==2) con=con/nuu(k);
iss=strcat(iss,'Averaged connectance=',num2str(con),'\n');
end
end
fprintf(iss)
3 A Typical Example
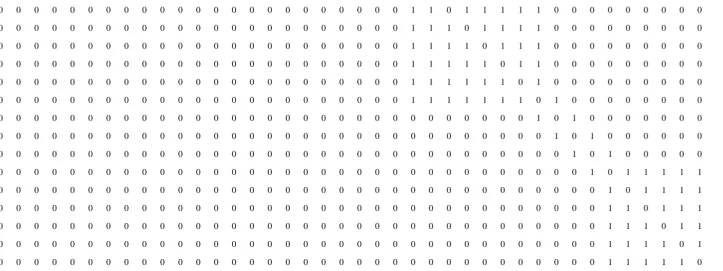
Suppose the adjacency matrix (40
40) of a typical network is
0 1 1 1 1 1 0 0 0 0 0 0 0 0 0 0 0 0 0 0 0 0 0 0 0 0 0 0 0 0 0 0 0 0 0 0 0 0 0 0
1 0 1 1 1 1 0 0 0 0 0 0 0 0 0 0 0 0 0 0 0 0 0 0 0 0 0 0 0 0 0 0 0 0 0 0 0 0 0 0
1 1 0 1 1 1 0 0 0 0 0 0 0 0 0 0 0 0 0 0 0 0 0 0 0 0 0 0 0 0 0 0 0 0 0 0 0 0 0 0
1 1 1 0 1 1 0 0 0 0 0 0 0 0 0 0 0 0 0 0 0 0 0 0 0 0 0 0 0 0 0 0 0 0 0 0 0 0 0 0
1 1 1 1 0 1 0 0 0 0 0 0 0 0 0 0 0 0 0 0 0 0 0 0 0 0 0 0 0 0 0 0 0 0 0 0 0 0 0 0
1 1 1 1 1 0 1 0 0 0 0 0 0 0 0 0 0 0 0 0 0 0 0 0 0 0 0 0 0 0 0 0 0 0 0 0 0 0 0 0
0 0 0 0 0 1 0 1 0 0 0 0 0 0 0 0 0 0 0 0 0 0 0 0 0 0 0 0 0 0 0 0 0 0 0 0 0 0 0 0
0 0 0 0 0 0 1 0 1 0 0 0 0 0 0 0 0 0 0 0 0 0 0 0 0 0 0 0 0 0 0 0 0 0 0 0 0 0 0 0
0 0 0 0 0 0 0 1 0 1 0 0 0 0 0 0 0 0 0 0 0 0 0 0 0 0 0 0 0 0 0 0 0 0 0 0 0 0 0 0
0 0 0 0 0 0 0 0 1 0 1 1 1 1 1 1 1 1 0 0 0 0 0 0 0 0 0 0 0 0 0 0 0 0 0 0 0 0 0 0
0 0 0 0 0 0 0 0 0 1 0 1 1 1 1 1 1 1 0 0 0 0 0 0 0 0 0 0 0 0 0 0 0 0 0 0 0 0 0 0
0 0 0 0 0 0 0 0 0 1 1 0 1 1 1 1 1 1 0 0 0 0 0 0 0 0 0 0 0 0 0 0 0 0 0 0 0 0 0 0
0 0 0 0 0 0 0 0 0 1 1 1 0 1 1 1 1 1 0 0 0 0 0 0 0 0 0 0 0 0 0 0 0 0 0 0 0 0 0 0
0 0 0 0 0 0 0 0 0 1 1 1 1 0 1 1 1 1 0 0 0 0 0 0 0 0 0 0 0 0 0 0 0 0 0 0 0 0 0 0
0 0 0 0 0 0 0 0 0 1 1 1 1 1 0 1 1 1 0 0 0 0 0 0 0 0 0 0 0 0 0 0 0 0 0 0 0 0 0 0
0 0 0 0 0 0 0 0 0 1 1 1 1 1 1 0 1 1 0 0 0 0 0 0 0 0 0 0 0 0 0 0 0 0 0 0 0 0 0 0
0 0 0 0 0 0 0 0 0 1 1 1 1 1 1 1 0 1 0 0 0 0 0 0 0 0 0 0 0 0 0 0 0 0 0 0 0 0 0 0
0 0 0 0 0 0 0 0 0 1 1 1 1 1 1 1 1 0 1 0 0 0 0 0 0 0 0 0 0 0 0 0 0 0 0 0 0 0 0 0
0 0 0 0 0 0 0 0 0 0 0 0 0 0 0 0 0 1 0 1 0 0 0 0 0 0 0 0 0 0 0 0 0 0 0 0 0 0 0 0
0 0 0 0 0 0 0 0 0 0 0 0 0 0 0 0 0 0 1 0 1 0 0 0 0 0 0 0 0 0 0 0 0 0 0 0 0 0 0 0
0 0 0 0 0 0 0 0 0 0 0 0 0 0 0 0 0 0 0 1 0 1 0 0 0 0 0 0 0 0 0 0 0 0 0 0 0 0 0 0
0 0 0 0 0 0 0 0 0 0 0 0 0 0 0 0 0 0 0 0 1 0 1 0 0 0 0 0 0 0 0 0 0 0 0 0 0 0 0 0
0 0 0 0 0 0 0 0 0 0 0 0 0 0 0 0 0 0 0 0 0 1 0 1 0 0 0 0 0 0 0 0 0 0 0 0 0 0 0 0
0 0 0 0 0 0 0 0 0 0 0 0 0 0 0 0 0 0 0 0 0 0 1 0 1 1 1 1 1 1 1 0 0 0 0 0 0 0 0 0
0 0 0 0 0 0 0 0 0 0 0 0 0 0 0 0 0 0 0 0 0 0 0 1 1 0 1 1 1 1 1 0 0 0 0 0 0 0 0 0
0 0 0 0 0 0 0 0 0 0 0 0 0 0 0 0 0 0 0 0 0 0 0 1 1 1 0 1 1 1 1 0 0 0 0 0 0 0 0 0
0 0 0 0 0 0 0 0 0 0 0 0 0 0 0 0 0 0 0 0 0 0 0 1 1 1 1 0 1 1 1 0 0 0 0 0 0 0 0 0
0 0 0 0 0 0 0 0 0 0 0 0 0 0 0 0 0 0 0 0 0 0 0 1 1 1 1 1 0 1 1 0 0 0 0 0 0 0 0 0
0 0 0 0 0 0 0 0 0 0 0 0 0 0 0 0 0 0 0 0 0 0 0 1 1 1 1 1 1 0 1 0 0 0 0 0 0 0 0 0
0 0 0 0 0 0 0 0 0 0 0 0 0 0 0 0 0 0 0 0 0 0 0 1 1 1 1 1 1 1 0 1 0 0 0 0 0 0 0 0
0 0 0 0 0 0 0 0 0 0 0 0 0 0 0 0 0 0 0 0 0 0 0 0 0 0 0 0 0 0 1 0 1 0 0 0 0 0 0 0
0 0 0 0 0 0 0 0 0 0 0 0 0 0 0 0 0 0 0 0 0 0 0 0 0 0 0 0 0 0 0 1 0 1 0 0 0 0 0 0
0 0 0 0 0 0 0 0 0 0 0 0 0 0 0 0 0 0 0 0 0 0 0 0 0 0 0 0 0 0 0 0 1 0 1 0 0 0 0 0
0 0 0 0 0 0 0 0 0 0 0 0 0 0 0 0 0 0 0 0 0 0 0 0 0 0 0 0 0 0 0 0 0 1 0 1 1 1 1 1
0 0 0 0 0 0 0 0 0 0 0 0 0 0 0 0 0 0 0 0 0 0 0 0 0 0 0 0 0 0 0 0 0 0 1 0 1 1 1 1
0 0 0 0 0 0 0 0 0 0 0 0 0 0 0 0 0 0 0 0 0 0 0 0 0 0 0 0 0 0 0 0 0 0 1 1 0 1 1 1
0 0 0 0 0 0 0 0 0 0 0 0 0 0 0 0 0 0 0 0 0 0 0 0 0 0 0 0 0 0 0 0 0 0 1 1 1 0 1 1
0 0 0 0 0 0 0 0 0 0 0 0 0 0 0 0 0 0 0 0 0 0 0 0 0 0 0 0 0 0 0 0 0 0 1 1 1 1 0 1
0 0 0 0 0 0 0 0 0 0 0 0 0 0 0 0 0 0 0 0 0 0 0 0 0 0 0 0 0 0 0 0 0 0 1 1 1 1 1 0
The corresponding network graph is drawn for convenient comparison using Java software (Zhang, 2012a),
as indicated in Fig. 1.
Fig. 1 A network graph.
3.1 Finding sub-networks
The cluster results for finding sub-networks are as follows
r=1
(1)(Connectance=0)(2)(Connectance=0)(3)(Connectance=0)(4)(Connectance=0)(5)(Connectance=0)(6)(Connectance=0)(35)(C
onnectance=0)(36)(Connectance=0)(37)(Connectance=0)(38)(Connectance=0)(39)(Connectance=0)(40)(Connectance=0)(10)(C
onnectance=0)(11)(Connectance=0)(12)(Connectance=0)(13)(Connectance=0)(14)(Connectance=0)(15)(Connectance=0)(16)(C
onnectance=0)(17)(Connectance=0)(18)(Connectance=0)(24)(Connectance=0)(25)(Connectance=0)(26)(Connectance=0)(27)(C
onnectance=0)(28)(Connectance=0)(29)(Connectance=0)(30)(Connectance=0)(31)(Connectance=0)(7)(Connectance=0)(8)(Con
nectance=0)(9)(Connectance=0)(19)(Connectance=0)(20)(Connectance=0)(21)(Connectance=0)(22)(Connectance=0)(23)(Conn
ectance=0)(32)(Connectance=0)(33)(Connectance=0)(34)(Connectance=0)
Averaged connectance=0
r=0.175
onnectance=0)(36)(Connectance=0)(37)(Connectance=0)(38)(Connectance=0)(39)(Connectance=0)(40)(Connectance=0)(10,11
,12,13,14,15,16,17,18)(Connectance=1)(24)(Connectance=0)(25)(Connectance=0)(26)(Connectance=0)(27)(Connectance=0)(2
8)(Connectance=0)(29)(Connectance=0)(30)(Connectance=0)(31)(Connectance=0)(7)(Connectance=0)(8)(Connectance=0)(9)(
Connectance=0)(19)(Connectance=0)(20)(Connectance=0)(21)(Connectance=0)(22)(Connectance=0)(23)(Connectance=0)(32)(
Connectance=0)(33)(Connectance=0)(34)(Connectance=0)
Averaged connectance=0.03125
r=0.15
(1)(Connectance=0)(2)(Connectance=0)(3)(Connectance=0)(4)(Connectance=0)(5)(Connectance=0)(6)(Connectance=0)(35)(C
onnectance=0)(36)(Connectance=0)(37)(Connectance=0)(38)(Connectance=0)(39)(Connectance=0)(40)(Connectance=0)(10,11
,12,13,14,15,16,17,18)(Connectance=1)(24,25,26,27,28,29,30,31)(Connectance=1)(7)(Connectance=0)(8)(Connectance=0)(9)(
Connectance=0)(19)(Connectance=0)(20)(Connectance=0)(21)(Connectance=0)(22)(Connectance=0)(23)(Connectance=0)(32)(
Connectance=0)(33)(Connectance=0)(34)(Connectance=0)
Averaged connectance=0.08
r=0.1
(1,2,3,4,5,6)(Connectance=1)(35,36,37,38,39,40)(Connectance=1)(10,11,12,13,14,15,16,17,18)(Connectance=1)(24,25,26,27
,28,29,30,31)(Connectance=1)(7)(Connectance=0)(8)(Connectance=0)(9)(Connectance=0)(19)(Connectance=0)(20)(Connectan
ce=0)(21)(Connectance=0)(22)(Connectance=0)(23)(Connectance=0)(32)(Connectance=0)(33)(Connectance=0)(34)(Connectan
ce=0)
Averaged connectance=0.26667
r=0
(1,2,3,4,5,6,7,8,9,10,11,12,13,14,15,16,17,18,19,20,21,22,23,24,25,26,27,28,29,30,31,32,33,34,35,36,37,38,39,40)(Connectanc
e=0.1385)
Averaged connectance=0.1385
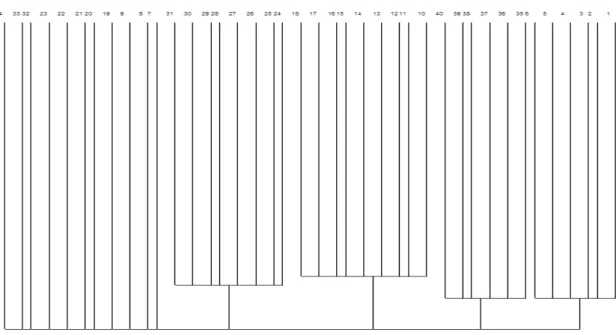
The cluster graph for results is shown in Fig. 2.
Fig. 2 Cluster results for finding sub-networks.
at certain levels (bold results) are acceptable. There are mainly four sub-networks, i.e., node sets (1,2,3,4,5,6),
(35,36,37,38,39,40), (10,11,12,13,14,15,16,17,18), (24,25,26,27,28,29,30,31). Therefore the method
proposed is valuable for finding sub-networks. It should be noted that in this example the optimal
classification is that with maximum averaged connectance.
3.2 Finding node sets
The results for finding node sets are as follows
r=1
(1)(2)(3)(4)(5)(6)(35)(36)(37)(38)(39)(40)(8)(33)(10)(11)(12)(13)(14)(15)(16)(17)(18)(24)(25)(26)(27)(28)(29)(30)(31)(7)(9)(1
9)(21)(23)(20)(22)(32)(34)
r=0.175
(1)(2)(3)(4)(5)(6)(35)(36)(37)(38)(39)(40)(8)(33)(10,11,12,13,14,15,16,17,18)(24)(25)(26)(27)(28)(29)(30)(31)(7)(9)(19)(21)(2
3)(20)(22)(32)(34)
r=0.15
(1)(2)(3)(4)(5)(6)(35)(36)(37)(38)(39)(40)(8)(33)(10,11,12,13,14,15,16,17,18)(24,25,26,27,28,29,30,31)(7)(9)(19)(21)(23)(20)(
22)(32)(34)
r=0.1
(1,2,3,4,5,6)(35,36,37,38,39,40)(8)(33)(10,11,12,13,14,15,16,17,18)(24,25,26,27,28,29,30,31)(7)(9)(19)(21)(23)(20)(22)(32)(3
4)
r=0.025
(1,2,3,4,5,6)(35,36,37,38,39,40)(8)(33)(10,11,12,13,14,15,16,17,18)(24,25,26,27,28,29,30,31)(7,9)(19,21,23)(20,22)(32,34)
r=0
(1,2,3,4,5,6,7,8,9,10,11,12,13,14,15,16,17,18,19,20,21,22,23,24,25,26,27,28,29,30,31,32,33,34,35,36,37,38,39,40)
4 Sub-networks in Tumor Pathways
Some tumor pathways (ABCAM, 2012; Huang and Zhang, 2012; Li and Zhang, 2013; Pathway Central, 2012;
Zhang, 2016) are used to find their sub-networks. The results show that the pathways there are not any
sub-networks in Ras, PPAR, STAT3, and HGF. The sub-networks and their links of other pathways are
indicated as the follows, in which nodes in parentheses are metabolites/reactions in the pathways (Huang and
Zhang, 2012)
JNK sub-network: (CDC42,MKK1), (CDC42,PAK), (Rac,MKK1), (Rac,PAK), (MKK1,PAK)
m-TOR sub-network: (mTOR-Ractor-GβL,PP2A), (mTOR-Ractor-GβL,4EBP), (PP2A,4EBP)
TGF-
β
sub-network: (ERK1/2,SMAD2-P-P-SMAD4), (ERK1/2,SBE), (SMAD2-P-P-SMAD4,SBE)
TNF sub-network: (TRADD,SODD), (TRADD,Caspase 8), (SODD,Caspase 8)
FAS-Signaling sub-network: (Fas,BTK), (Fas,c-FLIP), (BTK,FADD), (FADD,c-FLIP)
PTEN-680 sub-network: (PTEN,PI(3,4,5)P3), (PTEN,P), (PI(3,4,5)P3,P)
EGF
Sub-network 1: (Vav,ErbB2), (Vav,EGFR), (ErbB2,EGFR)
Sub-network 2: (EPS8,E3B1), (EPS8,RNTRE), (E3B1,RNTRE)
p53
Sub-network 1: (ART,Chk1-P), (ART,p53-P-P), (Chk1-P,p53-P-P)
Sub-network 2: (Bax,BCL2), (Bax,Gene Expression), (BCL2,Gene Expression)
Akt
Sub-network 2: (TSC2-TSC1,mTOR), (TSC2-TSC1,Akt-P), (mTOR,Akt-P)
ERK-Signaling
Sub-network 1: (Src-FAK,PI3K), (Src-FAK,Rac), (PI3K,Rac)
Sub-network 2:
(c-Raf,KSR), (c-Raf,MEKK1), (c-Raf,MEK1/2), (KSR,ERK1/2), (KSR,MEK1/2), (MEKK1,ERK1/2), (MEKK1,MEK1/2),
(ERK1/2,MEK1/2)
PI3K
Sub-network 1: (BLK,Toc-Vav), (BLK,(BLNK-BTK-PLC-β,y)), (Toc-Vav,(BLNK-BTK-PLC-β,y))
Sub-network 2: (MAPKs,PIK3C), (MAPKs,PIK3C3), (PIK3C,IkBs-P-NKkB), (PIK3C3,IkBs-P-NKkB)
Sub-network 3: (BAM32,PtdIns(3,4)P2), (PtdIns(3,4)P2,PIP3)
JAK-STAT
Sub-network 1: (JAK2,Growth Hormones Receptor), (JAK2,STAT5-P), (Growth Hormones Receptor,STAT5-P)
Sub-network 2: (TYK2,IFNAR2), (TYK2,STAT2-P), (IFNAR2,STAT2-P)
Sub-network 3: (JAKs,Cytokines Receptor), (JAKs,STATs-P), (Cytokines Receptor,STATs-P)
Sub-network 4:
((STATs)2,(SUMO)3-(STATs)2-PIAS-Ubsc9), ((STATs)2,(STATs-P)2-Cofactors-CTFS-P),
((SUMO)3-(STATs)2-PIAS-Ubsc9,KPNA1-RAN), (KPNA1-RAN,(STATs-P)2-Cofactors-CTFS-P)
MARK
Sub-network 1: (GPCR,RTK-GRB2-SOS), (GPCR,Ras-GTP), (RTK-GRB2-SOS,Ras-GTP)
Sub-network 2: (MEKK1,MEK1/2), (MEKK1,Raf1-A-Raf-B-Raf), (MEK1/2,PAK), (PAK,Raf1-A-Raf-B-Raf)
Sub-network 3: (Src-FAK,PI3K), (Src-FAK,Rac1-GTP), (PI3K,Rac1-GTP)
Sub-network 4: (OSM,MEK3/6), (OSM,MAPAs), (MEK3/6,MAPAs)
Sub-network 5: (PLC,DAG), (PLC,PKC), (DAG,PKC)
Sub-network 6: (MAP3Ks,POSH), (MAP3Ks,MEK4/7), (POSH,JNK), (MEK4/7,JNK)