A new method for feature selection based on fuzzy similarity
measures using multi objective genetic algorithm
Hassan Nosrati Nahook1*, Mahdi Eftekhari2
(1) Faculty member of Information Technology Engineering departmen, Payame Noor University, Saravan, Iran (2) Department Computer Engineering - Faculty of Engineering - Shahid Bahonar University of Kerman, Iran.
Copyright 2014 © Hassan Nosrati Nahook and Mahdi Eftekhari. This is an open access article distributed under the Creative Commons Attribution License, which permits unrestricted use, distribution, and reproduction in any medium, provided the original work is properly cited.
Abstract
Feature selection (FS) is considered to be an important preprocessing step in machine learning and pattern recognition, and feature evaluation is the key issue for constructing a feature selection algorithm. Feature selection process can also reduce noise and this way enhance the classification accuracy. In this article, feature selection method based on fuzzy similarity measures by multi objective genetic algorithm (FSFSM
– MOGA) is introduced and performance of the proposed method on published data sets from UCI was evaluated. The results show the efficiency of the method is compared with the conventional version. When this method multi-objective genetic algorithms and fuzzy similarity measures used in CFS method can improve it.
Keywords: Feature Selection, Fuzzy Similarity Measures, Multi Objective Genetic.
1 Introduction
Large dimensionality presents a problem for handling data due to the fact that the complexity of many commonly used operations are highly dependent (e.g. exponentially) on the level of dimensionality. The problems associated with such large dimensionality mean that any attempt to use machine learning or data-mining tools to extract knowledge, results in very poor performance. Feature selection (FS) [1] is a process which attempts to select features which are information-rich whilst retaining the original meaning of the features following reduction. Most learning algorithms are unable to consider problems of such size, whilst those that are not will usually perform poorly.
A similarity measure is an important tool for determining the degree of similarity between two objects. Kaufman and Rousseeuw [2] presented some examples to illustrate traditional similarity measure applications in hierarchical cluster analysis. Since Zadeh [3] originated the idea of fuzzy sets, many different similarity measures between fuzzy sets have been proposed in the literature. Zwick etal [4]
Available online at www.ispacs.com/jfsva Volume 2014, Year 2014 Article ID jfsva-00162, 12 Pages
Reviewed geometric distance and Hausdorff metrics presenting similarity measures among fuzzy sets. Pappis and Karacapilidis [5] proposed three similarity measures based on union and intersection operations, the maximum difference, and the difference and sum of membership grades. Wang [6] presented two similarity measures between fuzzy sets and between elements. Liu [7] and Fan and Xie [8] provided the axiom definition and properties of similarity measures between fuzzy sets. Turksen and Zhong [9] applied similarity measures between fuzzy sets for approximate analogical reasoning. Buckley and Hayashi [10] used a similarity measure between fuzzy sets to determine whether a rule should be fired for rule matching in fuzzy control and neural networks.
The theory of fuzzy sets, proposed by Zadeh [3], has gained successful applications in various fields. Measures of similarity between fuzzy sets, as an important content in fuzzy mathematics, have gained attention from researchers for their wide applications in real world. Based on similarity measures that are very useful in some areas, such as pattern recognition, machine learning, decision making and market prediction, many measures of similarity between fuzzy sets have been proposed and researched in recent years.
In this paper, we will review several popular similarity measures between fuzzy sets and a feature selection method based on fuzzy similarity measures by multi objective genetic algorithm (FSFSM – MOGA) is presented. This paper is organized as follows. Section 2 describes the related terms. Section 3 explains the multi – objective genetic algorithm. Section 4 describes the correlation based on feature selection method. Section 5 explains the proposed method based on fuzzy similarity measure for evaluate similarity between features by multi objective genetic algorithm. In Section 6, the experimental results of the proposed method are presented. The last section summarises and conclusion related work.
2 Related terms
2.1. T – norm and T – conorm
The triangular norms (t-norm), which generalize the form of intersection and union, are next well described and later will be used to construct our similarity measure: For any x [ ].
T – norm: A two-place function [ ] [ ] [ ] is called t – norm if the following conditions are satisfied:
;
;
( )
A t-norm is called Archimedean if and only if is continuous and [ ]
T – conorm: A two-place function [ ] [ ] [ ] is called t – conorm if the following conditions are satisfied:
;
;
( )
A function [ ] [ ] [ ] is dual t-conorm of t-norm such that for all x [ ] both the following equivalent equalities hold, - - - and - - - , where (1 – x) and (1 – y) are respectively complements of x and y.
Next we present a list of the main well know and most frequently used t – norms [11, 12]:
(2.1)
(2.2)
( - ) (2.3)
{
(2.4)
( - ) – - (2.5)
( ( - )(- - )) - (2.6)
- ( - ) ( - ) - (2.7)
(
-) (
-)
- (2.8)
-
- - (2.9)
( - ) - (2.10)
( ( - )- ) - - (2.11)
By using the duality we can easily establish the Yu's t-conorm, which is:
- (2.12)
2.2.Similarity measures for fuzzy sets
A function [ ] is called a normal interval valued similarity measure, if satisfies following properties for all A, B, and C :
I. ,
II. [ ], III. [ ],
IV. Monotonic:
Distance based similarity measures for Fuzzy sets. The most obvious way of calculating similarity of fuzzy sets is based on their distance. This calculation is in two step: in first part the distance between two fuzzy sets is obtained by a distance measure and in the second part one of the relationships between similarity and distance comes into play to reach at the degree of similarity.
Distance measures are present in literature. The most commonly employed distance measures are:
1. The Hamming distance
∑ | - | (2.13)
2. The normalized Hamming distance
∑ | - | (2.14)
3. The Euclidean distance
√∑ - (2.15)
4. In general
∑ | - | (2.16)
5. The sup distance
| - | (2.17)
Where measures 1–4 are constructed for finite universe. The relationship between the notions of similarity and distance is expressed in several ways some of which are as follows: If is the distance measure between two fuzzy sets and on a universe , then following measures of similarity are presented in [14, 15, 16] respectively:
1. The distance based assessment proposed by Koczy:
(2.18)
2. The distance based assessment proposed by Williams and Steele:
- (2.19)
Where � is the steepness measure.
3. Family of distance based similarity measures presented by Sanitini:
2.3. Fuzzy similarity measures (1) Simple fuzzy similarity measures
As definition of the cardinality of a fuzzy set in we consider the usual sigma-count of :
∑ (2.21)
Furthermore, the complement of is defined by:
- (2.22)
And therefore .
We have expressed T – norms in Section 2.1. In this paper, only the T – norm of equation (2.1) we use. Consider two fuzzy sets and in and let and , then we define:
(2.23)
(2.24)
Where T is an arbitrary t-norm, and Sn denotes its dual t-conorm: - - - . We further restrict the t-norm T to the family of Minimum t-norms, namely the t-norms characterized by the functional equation:
(2.25)
Hence, fuzzification equation (2.24) for set union can be restated in the alternative form:
- (2.26)
Notice that rules (2.21), (2.22) and (2.26) are such that both the expressions and are fuzzified to the same expression.
Equations (2.21) and (2.22) leads to the fuzzy similarity measures listed in Table 1.
Table 1: Simple fuzzy similarity measures.
S Expression
S11 ∑ ∑
∑ ∑
(Complement S11)S12 ∑ ∑
∑ ∑
S13 ∑ ∑
(Complement S13)S14 ∑ ∑
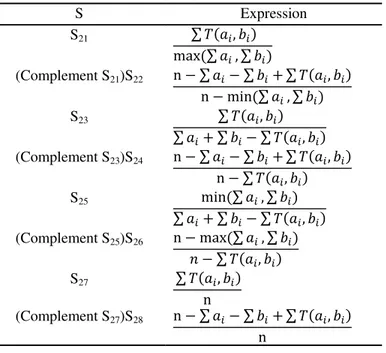
- based fuzzy similarity measures
Table 2: - based fuzzy similarity measures.
S Expression
S21 ∑
∑ ∑
(Complement S21)S22 ∑ ∑ ∑
∑ ∑
S23 ∑
∑ ∑ ∑
(Complement S23)S24 ∑ ∑ ∑
∑
S25 ∑ ∑
∑ ∑ ∑
(Complement S25)S26 ∑ ∑
∑
S27 ∑
(Complement S27)S28 ∑ ∑ ∑
2.4. Fuzzy similarity measures based on distance
In this Fuzzy similarity measure, for features of a standard data set, we define a triangular fuzzy number. In this case, the minimum and maximum values in each feature is defined respectively the lower and upper fuzzy numbers. Each feature a triangular fuzzy number will vary according to the center. Whatever triangular fuzzy number related to more asymmetric features, the degree of similarity between two features is greater.That degree of similarity between two feature is calculated as follows:
We Use Triangular Fuzzy number
as follows (equation (2.27)) [17]:
{
؛
( - )
( -)
؛
( - )
( - )
؛
(2.27)
Let (m, 0) divides, internally, the base of the triangle in ratio , where is real positive number ( ).
--
(2.28)
Figure 1: Triangular fuzzy number.
In [18], Hsieh and Chen proposed a similarity measure using the "graded mean integration representation distance", where the degree of similarity between fuzzy numbers and can be calculated with equation (2.18). Where
| - | (2.29)
and are the graded mean integration representations of and , respectively. If and are triangular fuzzy numbers, where and , then the graded mean integration representations and of and , respectively, are defined as follows [18, 19]:
(2.30)
(2.31)
It is obvious that the larger the value of , the more the similarity between the fuzzy numbers and .
3 Multi objective genetic algorithm
In GA terminology, a solution vector x X is called an individual or a chromosome. Chromosomes are made of discrete units called genes. Each gene controls one or more features of the chromosome. In the original implementation of GA by Holland, genes are assumed to be binary digits. In later implementations, more varied gene types have been introduced. Normally, a chromosome corresponds to a unique solution x in the solution space. This requires a mapping mechanism between the solution space and the chromosomes. This mapping is called an encoding. In fact, GA work on the encoding of a problem, not on the problem itself.
GA operate with a collection of chromosomes, called a population. The population is normally randomly initialized. As the search evolves, the population includes fitter and fitter solutions, and eventually it converges, meaning that it is dominated by a single solution. Holland also presented a proof of convergence (the schema theorem) to the global optimum where chromosomes are binary vectors.
The mutation operator introduces random changes into characteristics of chromosomes. Mutation is generally applied at the gene level. In typical GA implementations, the mutation rate (probability of changing the properties of a gene) is very small and depends on the length of the chromosome. Therefore, the new chromosome produced by mutation will not be very different from the original one. Mutation plays a critical role in GA. As discussed earlier, crossover leads the population to converge by making the chromosomes in the population alike. Mutation reintroduces genetic diversity back into the population and assists the search escape from local optima.
Being a population-based approach, GA are well suited to solve multi-objective optimization problems. A generic single-objective GA can be modified to find a set of multiple non-dominated solutions in a single run. The ability of GA to simultaneously search different regions of a solution space makes it possible to find a diverse set of solutions for difficult problems with non-convex, discontinuous, and multi-modal solutions spaces. The crossover operator of GA may exploit structures of good solutions with respect to different objectives to create new nondominated solutions in unexplored parts of the Pareto front. In addition, most multi-objective GA do not require the user to prioritize, scale, or weigh objectives. Therefore, GA have been the most popular heuristic approach to multi-objective design and optimization problems. Jones etal [20] Reported that 90% of the approaches to multiobjective optimization aimed to approximate the true Pareto front for the underlying problem. A majority of hese used a meta-heuristic technique, and 70% of all metaheuristics approaches were based on evolutionary approaches.
Several survey paper [21, 22, 23, 24] have been published on evolutionary multi-objective optimization. Coello lists more than 2000 references in his website [25]. Generally, multi-objective GA differ based on their fitness assignment procedure, elitisim, or diversification approaches. In this paper, multi-objective genetic algorithm to select the optimal number of features to use.
4 Correlation based on feature selection (CFS)
Like the majority of feature selection programs, CFS uses a search algorithm along with a function to
“ ”
subsets takes into account the usefulness of individual features for predicting the class label along with the level of intercorrelation among them. The hypothesis on which the heuristic is based can be stated: '' Good feature subsets contain features highly correlated with the class, yet uncorrelated with each other.''
In test theory (Huawen, JiguiSun, LeiLiu and HuijieZhang, 2009) [26], the same principle is used to design a composite test (the sum or average of individual tests) for predicting an external variable of interest. In this situation, the features" are individual tests which measure traits related to the variable of interest (class).
A feature subset S containing k features, ̅̅̅ the average feature – class correlation, and ̅ the average feature – feature intercorrelation, The equations are defined.
̅ ∑ ( )
(4.32)
̅̅̅ ∑ ( ) (4.33)
5
The proposed feature selection method based on fuzzy similarity measures by multi bbjective genetic algorithms (FSFSM – MOGA)This method is the same as CFS method, with the difference that instead of the correlation matrix use fuzzy similarity measure matrix and to select the optimal the number of features, we use multi-objective genetic algorithm.
In this case, equations (2.31) and (4.32) the following equations are converted.
̅̅̅ ∑ - ( ) (5.34)
̅̅̅ ∑ ( )
(5.35)
Where Sm is the fuzzy similarity measure matrix, ̅̅̅ the average feature – class fuzzy similarity, and ̅̅̅ the average feature – feature fuzzy similarity.
Use MOGA algorithm of In the proposed method is explained briefly as follows:
1.Fuzzy similarity matrix calculated using fuzzy similarity measures. 2.Calculated (̅̅̅ ) and (̅̅̅ ) using fuzzy similarity matrix.
3.Selection the number of optimal features using multi-objective genetic algorithm (use fitness functions relating to equations (5.34) and (5.35)).
̅̅̅ ∑ ( )
(5.36)
̅̅̅̅̅ ∑ ( ) (5.37)
Finally, we compare the results of proposed method with the results of the CFS method fitness functions. CFS method, Fitness functions:
̅ ∑ ( )
(5.38)
̅̅̅̅̅ ∑ ( )
(5.39)
6 Experiments
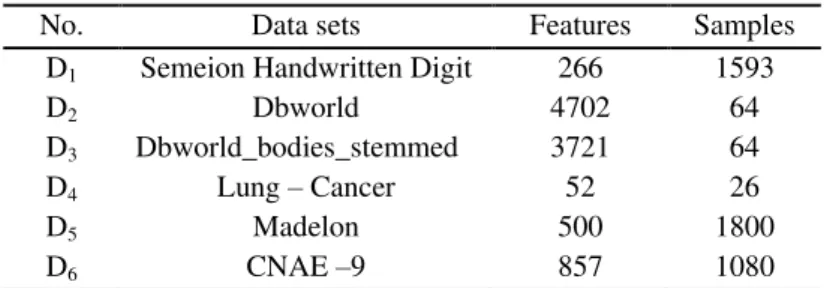
Six data sets are used in the experiments to test the proposed algorithm. All of them have been taken from the UCI machine learning database [27]. the properties of the data sets are summarized in Table 3. (they differ greatly in the sample size, feature number).
Table 3: Description of the used data sets.
No. Data sets Features Samples
D1 Semeion Handwritten Digit 266 1593
D2 Dbworld 4702 64
D3 Dbworld_bodies_stemmed 3721 64
D4 Lung – Cancer 52 26
D5 Madelon 500 1800
D6 CNAE –9 857 1080
Table 4: The number of Selective features the proposed method in comparison with the conventional method for two classes of FSM using correlation matrix.
Data sets Total number of
features The number of selective feature two method
CFS method FSFSM – MOGA method
Using the correlation matrix
Distance – FSM - FSM
D1 266 12 11 10
D2 4702 260 284 138
D3 3721 207 232 106
D4 52 2 2 2
D5 500 32 28 26
D6 857 36 26 24
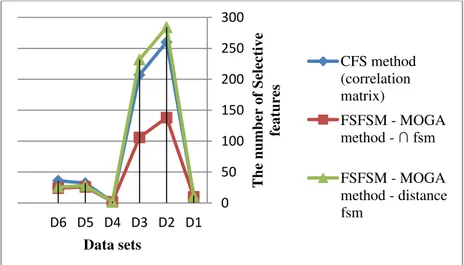
In the feature selection algorithms of machine learning, the average fuzzy measure feature – feature less and average fuzzy measure class – feature more is better. In table (4), we see that the FSFSM – MOGA method is better than the conventional method. Especially when we use of the - fuzzy similarity measures. This result in figure 2 is clearly specified.
Figure 2: The number of Selective features the proposed method in comparison with CFS method.
7 Conclusion
In this paper, we have presented a new method for feature selection based on fuzzy similarity measure using multi – objective genetic algorithm (FSFSM – MOGA). CFS method using fuzzy similarity measure and MOGA were improved, as the performance of this method is shown in Table 4 and figure 2. Experiments show that feature selection method using fuzzy similarity measures together with similarity classifier is giving good results. The proposed method can be modified with other fuzzy similarity measures and improve it.
References
[1] M. Dash, H. Liu, Feature Selection for Classification, Intelligent Data Analysis, 1 (1-4) (1997) 131-156. http://dx.doi.org/10.1016/S1088-467X(97)00008-5 0 50 100 150 200 250 300 D1 D2 D3 D4 D5 D6 The number of Sele ctive fea tu res Data sets CFS method (correlation matrix)
FSFSM - MOGA method -
[2] L. Kaufman, P. J. Rousseeuw, Finding Groups in Data: An Introduction to Cluster Analysis, New York: Wiley, (1990).
[3] L. A. Zadeh, Fuzzy sets, Information Control, 8 (1965) 338-356. http://dx.doi.org/10.1016/S0019-9958(65)90241-X
[4] R. Zwick, E. Carlstein, D. V. Budescu, Measures of similarity among fuzzy concepts: A comparative analysis, Int J Approximate Reason, 1 (1987) 221-242.
http://dx.doi.org/10.1016/0888-613X(87)90015-6
[5] C. P. Pappis, N. I. Karacapilidis, A comparative assessment of measures of similarity of fuzzy values, Fuzzy Sets and Systems, 56 (1993) 171-174.
http://dx.doi.org/10.1016/0165-0114(93)90141-4
[6] W. J. Wang, New similarity measures on fuzzy sets and on elements, Fuzzy Sets and Systems, 85 (1997) 305-309.
http://dx.doi.org/10.1016/0165-0114(95)00365-7
[7] X. Liu, Entropy, distance measure and similarity measure of fuzzy sets and their relations, Fuzzy Sets and Systems, 52 (1992) 305-318.
http://dx.doi.org/10.1016/0165-0114(92)90239-Z
[8] J. Fan, W. Xie, Some notes on similarity measure and proximity measure, Fuzzy Sets Syst, 101 (1999) 403-412.
http://dx.doi.org/10.1016/S0165-0114(97)00108-5
[9] I. B. Turksen, Z. Zhong, An approximate analogical reasoning approach based on similarity measures, IEEE Trans Syst Man Cybern, 18 (1988) 1049-1056.
http://dx.doi.org/10.1109/21.23107
[10] J. J. Buckley, Y. Hayashi, Fuzzy input–output controllers are universal approximates, Fuzzy Sets and Systems, 58 (1993) 273-278.
http://dx.doi.org/10.1016/0165-0114(93)90503-A
[11] Kalle Saastamoinen, Many valued algebraic structure as measures of comparison, PhD thesis, Lappenranta University of Technology, (2008).
[12] Gottwald Siegfried, Fuzzy sets and fuzzy logic, Artificial intelligence, ISNB 3-528-05311-9, (1993).
[13] H. Bustince, Indicator of inclusion grade for interval valued fuzzy sets: Application to approximate reasoning based on interval-valued fuzzy sets, Int. J. Approx. Reasoning, 23 (2000) 137-209.
http://dx.doi.org/10.1016/S0888-613X(99)00045-6
[14] T. Laszlo Koczy, T. Domonkos, Fuzzy rendszerek, Typotex, 14 (15) (2001) 1-122.
[15] J. Williams, N. Steele, Difference, distance and similarity as a basis for fuzzy decision support based on prototypical decision classes, Fuzzy Sets and Systems, 131 (2002) 35-46.
[16] S. Santini, R. Jain, Similarity is a geometer, Multimedia Tools and Applications, 5 (3) (1997) 277-306.
http://dx.doi.org/10.1023/A:1009651725256
[17] Josè Galindo, Handbook of Research in Fuzzy Information Processing in Databases, Information science Reference, (2008).
[18] C. H. Hsieh, S. H. Chen, Similarity of generalized fuzzy numbers with graded mean integration representation, in Proceedings of the Eighth International Fuzzy Systems Association World Congress, 2 (1999) 551-555.
[19] De Baets, Bernard, Hans De Meyer, The Frank T–norm Family in Fuzzy Similarity Measurement, In EUSFLAT Conference, 2nd, Proceedings, (2001) 249-252.
[20] D. F. Jones, S. K. Mirrazavi, M. Tamiz, Multiobjective meta-heuristics: an overview of the current state-of-the-art, Eur J Oper Res, 137 (1) (2002) 1-9.
http://dx.doi.org/10.1016/S0377-2217(01)00123-0
[21] E. Zitzler, K. Deb, L. Thiele, Comparison of multiobjective evolutionary algorithms: empirical results, Evol Comput, 8 (2) (2000) 173-95.
http://dx.doi.org/10.1162/106365600568202
[22] E. Zitzler, L. Thiele, Multiobjective evolutionary algorithms: a comparative case study and the strength Pareto approach, IEEE Trans Evol Comput, 3 (4) (1999) 257-71.
http://dx.doi.org/10.1109/4235.797969
[23] C. A. Coello, An updated survey of GA-based multiobjective optimization techniques, ACM Comput Surv, 32 (2) (2000) 109-43.
http://dx.doi.org/10.1145/358923.358929
[24] M. T. Jensen, Reducing the run-time complexity of multiobjective EAs: The NSGA-II and other algorithms, IEEE Trans Evol Comput, 7 (5) (2003) 503-15.
http://dx.doi.org/10.1109/TEVC.2003.817234
[25] L. Xiujuan, S. Zhongke, Overview of multi-objective optimization methods, J Syst Eng Electron, 15 (2) (2004) 142-6.
[26] Huawen Liu, Jigui Sun, Lei Liu, Huijie Zhang, Feature selection with dynamic mutual information, Pattern Recognition, 42 (2009) 1330-1339.
http://dx.doi.org/10.1016/j.patcog.2008.10.028