___________________________
Corresponding author: Dragan Perovic, Julius Kuehn-Institute, Federal Research Centre for Cultivated Plants, Institute for Resistance Research and Stress Tolerance, Erwin-Baur-Str. 27, 06484 Quedlinburg, Germany,e-mail: dragan.perovic@jki.bund.de,Tel.: + 49 (0)394647611 Fax: + 49 (0)394647600
UDC 575:633.16 DOI: 10.2298/GENSR1301167S
Original scientific paper
MOLECULAR CHARACTERIZATION OF BARLEY (Hordeum vulgare L.) ACCESSIONS OF THE SERBIAN GENEBANK BY SSR FINGERPRINTING
Gordana SURLAN-MOMIROVIC1, Ilona KRÄMER2, Kamenko BRATKOVIC3, Miroslav ZORIC4,Una MOMIROVIC5
, Gordana BRANKOVIC1, Irena CALIC1, Vesna KANDIC6,
Novo PRZULJ4, Frank ORDON2, Dragan PEROVIC2*
1 University of Belgrade, Faculty of Agriculture, Belgrade, Serbia 2
Julius Kühn-Institut (JKI), Federal Research Centre for Cultivated Plants, Quedlinburg, Germany
3 Centre for Small Grains, Kragujevac, Serbia 4 Institute of Field and Vegetable Crops, Novi Sad, Serbia
5 State University of Novi Pazar, Serbia
Surlan Momirovic G., I. Kramer, K.Bratkovic, M.Zoric, U. Momirovic, G.Brankovic, I.Calic, V.Kandic, N.Przulj, F. Ordon and D. Perovic (2013):
Molecular characterization of barley (Hordeum vulgare L.) accessions of the Serbian genebank by SSR fingerprinting. Genetika, Vol 45, No. 1, 167-180.
Molecular diversity of 145 barley (Hordeum vulgare subsp. vulgare L.)
between-group component was predominant (76.85%) for growth habit and 89.45% for row type. Unweighted Pair Group Method with Arithmetic Mean (UPGMA) cluster analysis based on the shared allele distance (DSA) matrix estimated on the
SSR data assigned the genotypes into two clusters - the first smaller consisting of the six 6-rowed spring cultivars and the second comprising six subclusters. Genotype MBR1012 was separated from all other genotypes that constitute UPGMA tree. The associations of genotypes belonging to different growth habit and row type groups were assessed using Principal Coordinate Analysis revealing separation of winter growth habit group from facultative one. The use of the STRUCTURE clustering algorithm allowed the identification of 2 subpopulations of genotypes.
Key words: barley diversity, Serbian Gene Bank, SSRs, population
structure
INTRODUCTION
Barley is one of the main grain crops, and is used for animal feed, brewing, and human consumption (HAYES et al., 2003). According to the World Information and Early Warning
System of the FAO (WIEWS), as of May 2011, there were around 470 000 Hordeum spp.
accessions in the world, of which around 149 000 are stored in Europe held in 34 countries (KNÜPFFER et al., 2011). Knowledge regarding the amount of genetic variation in germplasm
arrays and genetic relationships between genotypes are important considerations for efficient conservation and utilization of germplasm resources in the changing climate (MATUS and HAYES
2002, DODIGet al., 2008; DODIGet al., 2012). Crop diversity has important implications for the
genetic vulnerability and the potential for crop improvement. Recent developments in plant molecular biology and emerging molecular markers have allowed for the detection of diversity and differences among and within cultivars at the DNA level (AHSYEEet al., 2013, PAVLOVI et al., 2012)
Microsatellite markers, also known as simple sequence repeats (SSR), have proven to be one of the most suitable type of molecular markers for estimating genetic diversity in barley, genome mapping and marker assisted breeding, due to multi-allelic nature, chromosome specificity, high polymorphism rates, random distribution throughout the genome, cost-effectiveness and good reproducibility (VARSHNEY et al., 2010). Thirty-six SSR were used to
profile 96 wheat genotypes from the collection of genetic resources at the Institute of Field and Vegetable Crops, Novi Sad, Serbia (DODIGet al., 2010). New trends in germplasm management
include development of core subsets from the larger collection and using these collections for association mapping. Core genotype collections are being established as tools for germplasm study and resources for breeders when sources of new alleles are needed. The objectives of the study were to: (i) screen germplasm of 145 barley genotypes with a set of 15 EST SSRs equally distributed along the seven chromosomes; (ii) study the genetic diversity among the barley germplasm at molecular levels.
.
MATERIALS AND METHODS
One hundred forty and five barley (Hordeum vulgare subsp. vulgare L.) accessions
lines from five institutes/companies were used in this study (Table 1). Accessions named with MBR don’t have complete passport information and country of origin.
Genomic DNA was extracted from leaves of 14-day-old plants according to STEINet al.
(2001). The concentration and quality of DNA was determined using the NanoDrop ND-100 spectrophotometer (PeQLab, Erlangen, Germany) and gel electrophoresis. All samples were adjusted to a final concentration of 20 ng/µl. PCR was performed in a volume of 10 µl, containing 1µl of 10x buffer, 1 µl of 25 mM MgCl2, 0.2 µl of each 10 mM dNTPs, forward primer (1.0 pmol/µl) and reverse primer (10.0 pmol/µl), 0.08 µl 5U Hot FIREPol®DNA polymerase (Solis BioDyne, Tartu, Estonia), 6.12 µl HPLC gradient grade water (Carl Roth, Karlsruhe, Germany) and 1µl template DNA. For SSR amplification, M13 tailed forward primers were used according to (PEROVIC et al., 2013), so that 0.1 µl of ‘M13’ primer (10.0
pmol/µl) labeled with 5’ fluorescent dyes was added to the reaction mix. DNA amplification was performed in a Gene Amp® PCR System 9700 (Applied Biosystems, Darmstadt, Germany). The following PCR conditions were used for all primers: 94°C for 5 min followed by a touchdown PCR with 12 cycles of 30 s at 94°C, 30 s at 62°C, 30 s at 72°C; and then 35 cycles with 30 s at 94°C, 30 s at 56°C, 30 s at 72°C, and a final extension at 72°C for 10 min.
Detection of allele size for the SSR marker was conducted using a capillary electrophoresis ABI PRISM® 3100 genetic analyzer (Applied Biosystems, Darmstadt, Germany). The output from the sequencer was analyzed with Genescan software (PE Applied Biosystems, Foster City, CA, USA) to measure the molecular size of each SSR allele. A set of 15 EST SSR markers, with 2-3 SSR markers per chromosome, with a range of 4-18 alleles per locus were used to characterize the genetic diversity of 145 barley accessions (Table 2).
Microsatellite diversity statistics was estimated using genetic data analysis (GDA) (LEWIS and ZAYKIN, 2001) and PopGene software. In addition, unbiased estimates of gene
diversity-allelic richness were determined using FSTAT (GOUDET, 2002) software. Microsat software was used to produce a distance matrix (DSA) among pairs of barley accessions based on
the proportion of shared alleles. The DSA matrix was submitted to analysis of molecular variance
(AMOVA) using Arlequin software (SCHNEIDERet al., 2000). Unweighted Pair Group Method
with Arithmetic Mean (UPGMA) tree was constructed using MEGA software (TAMURAet al.,
2007), based on the shared allele distance (DSA) matrix among barley accessions. The
substructure of the accessions was analyzed using the Bayesian model based clustering approach provided in STRUCTURE software (PRITCHARDet al., 2000) with the length of burn-in period of 10,000 steps followed by 100,000 Monte Carlo Markov Chain replicates and a model allowing for admixture and correlated allele frequencies (FALUSHet al., 2003).
RESULTS
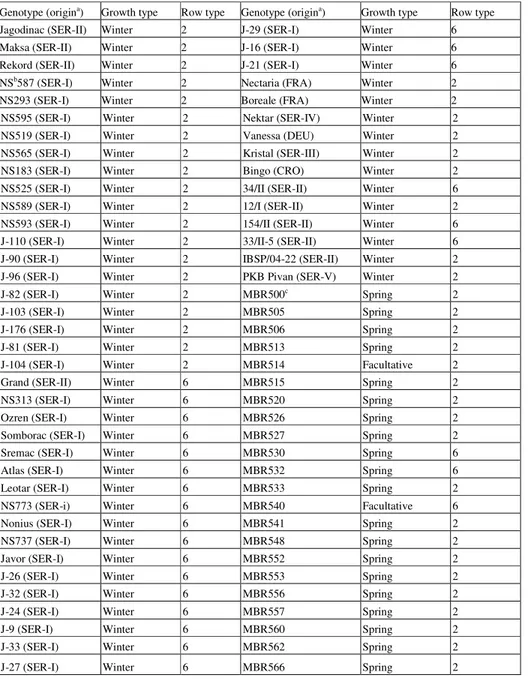
Table 1a Name, country of origin, growth habit and row type of the 145 barley accessions used in the study derived from the Serbian Genbank
Genotype (origina) Growth type Row type Genotype (origina) Growth type Row type
Jagodinac (SER-II) Winter 2 J-29 (SER-I) Winter 6
Maksa (SER-II) Winter 2 J-16 (SER-I) Winter 6
Rekord (SER-II) Winter 2 J-21 (SER-I) Winter 6
NSb587 (SER-I) Winter 2 Nectaria (FRA) Winter 2
NS293 (SER-I) Winter 2 Boreale (FRA) Winter 2
NS595 (SER-I) Winter 2 Nektar (SER-IV) Winter 2
NS519 (SER-I) Winter 2 Vanessa (DEU) Winter 2
NS565 (SER-I) Winter 2 Kristal (SER-III) Winter 2
NS183 (SER-I) Winter 2 Bingo (CRO) Winter 2
NS525 (SER-I) Winter 2 34/II (SER-II) Winter 6
NS589 (SER-I) Winter 2 12/I (SER-II) Winter 2
NS593 (SER-I) Winter 2 154/II (SER-II) Winter 6
J-110 (SER-I) Winter 2 33/II-5 (SER-II) Winter 6
J-90 (SER-I) Winter 2 IBSP/04-22 (SER-II) Winter 2
J-96 (SER-I) Winter 2 PKB Pivan (SER-V) Winter 2
J-82 (SER-I) Winter 2 MBR500c Spring 2
J-103 (SER-I) Winter 2 MBR505 Spring 2
J-176 (SER-I) Winter 2 MBR506 Spring 2
J-81 (SER-I) Winter 2 MBR513 Spring 2
J-104 (SER-I) Winter 2 MBR514 Facultative 2
Grand (SER-II) Winter 6 MBR515 Spring 2
NS313 (SER-I) Winter 6 MBR520 Spring 2
Ozren (SER-I) Winter 6 MBR526 Spring 2
Somborac (SER-I) Winter 6 MBR527 Spring 2
Sremac (SER-I) Winter 6 MBR530 Spring 6
Atlas (SER-I) Winter 6 MBR532 Spring 6
Leotar (SER-I) Winter 6 MBR533 Spring 2
NS773 (SER-i) Winter 6 MBR540 Facultative 6
Nonius (SER-I) Winter 6 MBR541 Spring 2
NS737 (SER-I) Winter 6 MBR548 Spring 2
Javor (SER-I) Winter 6 MBR552 Spring 2
J-26 (SER-I) Winter 6 MBR553 Spring 2
J-32 (SER-I) Winter 6 MBR556 Spring 2
J-24 (SER-I) Winter 6 MBR557 Spring 2
J-9 (SER-I) Winter 6 MBR560 Spring 2
J-33 (SER-I) Winter 6 MBR562 Spring 2
Table 1b Name, country of origin, growth habit and row type of the 145 barley accessions used in the study derived from the Serbian Genbank
aSER-I Institute of Field and Vegetable Crops Novi Sad, Serbia; SER-II Small Grains Research centre, Kragujevac;
SERIII-Center for Agricultural and Technological Research; Zajecar; SER-IV Maize Research Institute, Zemun Polje, , SER-V Institute Science application in Agriculture, Belgrade; FRA-France; Deu Gemany;Cro Croatia; b Novosadski; cMBR number in gen bank of Yugoslavia/Serbia.
Genotype (origina) Growth type Row type Genotype(origina) Growth type Row type
MBR568 Spring 2 MBR1035 Facultative 6
MBR569 Spring 2 MBR1038 Spring 6
MBR574 Spring 2 MBR1039 Spring 6
MBR576 Spring 2 MBR1043 Spring 6
MBR580 Spring 2 MBR1046 Spring 6
MBR862 Spring 6 MBR1055 Spring 6
MBR901 Spring 6 MBR1056 Spring 6
MBR934 Spring 6 MBR1058 Spring 6
MBR941 Spring 6 MBR1061 Spring 6
MBR959 Spring 6 MBR1089 Spring 6
MBR970 Spring 6 MBR1092 Spring 6
MBR974 Spring 6 MBR1094 Spring 6
MBR980 Spring 6 MBR1104 Spring 6
MBR984 Spring 6 MBR1127 Spring 6
MBR991 Spring 6 MBR1129 Facultative 2
MBR992 Spring 6 MBR1140 Facultative 2
MBR995 Spring 6 MBR1163 Spring 2
MBR997 Spring 6 MBR1170 Spring 2
MBR998 Spring 6 MBR1183 Spring 2
MBR1001 Spring 6 MBR1189 Spring 2
MBR1003 Spring 6 MBR1190 Spring 2
MBR1011 Spring 6 MBR1197 Spring 2
MBR1012 Spring 6 MBR1205 facult. 2
MBR1014 Spring 6 MBR1209 Spring 6
MBR1015 Spring 6 MBR1210 Spring 6
MBR1016 Spring 6 MBR1211 Spring 2
MBR1017 Spring 6 MBR1213 Spring 6
MBR1023 Spring 6 MBR1215 Spring 6
MBR1024 Spring 6 MBR1216 Spring 6
MBR1025 Spring 6 MBR1218 Spring 6
MBR1026 Spring 6 MBR1248 Spring 6
MBR1027 Facultative 6 MBR1249 Spring 6
MBR1028 Spring 6 MBR1251 Spring 6
MBR1029 Spring 6 MBR1252 Spring 2
MBR1030 Spring 6 MBR1253 Spring 2
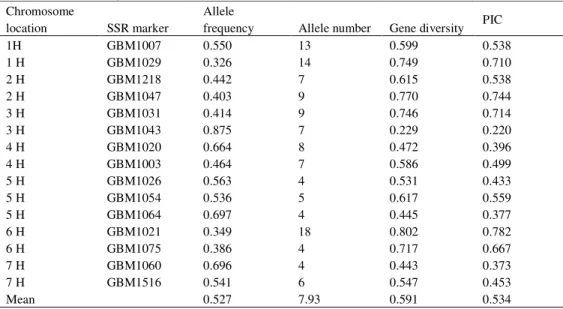
Table 2 Chromosome location, number of alleles, frequency of major alleles and polymorphism information content (PIC) for 15 EST SSR loci
Chromosome
location SSR marker
Allele
frequency Allele number Gene diversity PIC
1H GBM1007 0.550 13 0.599 0.538
1 H GBM1029 0.326 14 0.749 0.710
2 H GBM1218 0.442 7 0.615 0.538
2 H GBM1047 0.403 9 0.770 0.744
3 H GBM1031 0.414 9 0.746 0.714
3 H GBM1043 0.875 7 0.229 0.220
4 H GBM1020 0.664 8 0.472 0.396
4 H GBM1003 0.464 7 0.586 0.499
5 H GBM1026 0.563 4 0.531 0.433
5 H GBM1054 0.536 5 0.617 0.559
5 H GBM1064 0.697 4 0.445 0.377
6 H GBM1021 0.349 18 0.802 0.782
6 H GBM1075 0.386 4 0.717 0.667
7 H GBM1060 0.696 4 0.443 0.373
7 H GBM1516 0.541 6 0.547 0.453
Mean 0.527 7.93 0.591 0.534
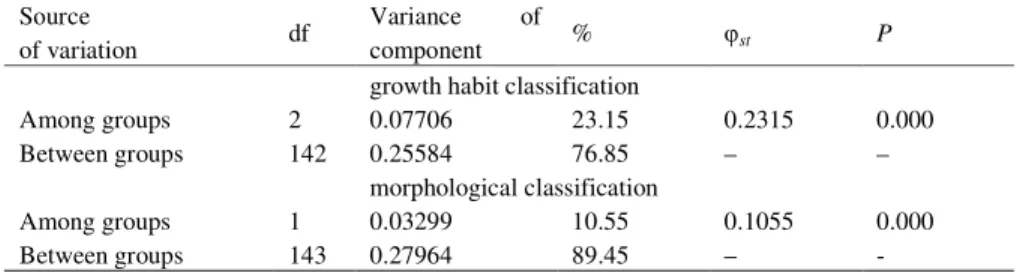
To characterize genetic diversity of barley germplasm related to the growth habit and morphological classification based on row type, the total number of alleles, mean alleles per locus, number of group specific alleles (hereafter referred to as unique alleles, i.e. alleles present in only one group and absent in the others) and gene diversity were calculated and expressed as mean (Table 3). Total number of alleles (106) and mean alleles per locus (7.07) were the highest for the spring barley group and were similar to those in the 6-rowed barley (95 and 6.33, respectively). Accessions from the facultative group had the lowest total number of alleles (44) and mean alleles per locus (2.93). The 2-rowed barley group had less total allele number (82) and mean alleles per locus (5.46) than the 6-rowed group. Regarding the growth habit and row type groups, gene diversity was comparatively higher for the spring (0.616) and six-rowed accessions (0.616) than for the winter and two-rowed accessions (0.322 and 0.478, respectively). The results of AMOVA for the growth habit and the ear type effects are shown in Table 4. All sources of variation were significant (P < 0.01), but the between-group component was
Table 3 Genetic diversity statistics related to the growth habit and morphological classification
Group Ng Na Nal Npa GD PIC
growth habit classification
spring 86 106 7.07 55 0.616 0.559
winter 52 53 3.53 8 0.322 0.286
facultative 7 44 2.93 5 0.494 0.439
morphological classification
two-row 65 82 5.46 27 0.478 0.431
six-row 80 95 6.33 37 0.616 0.557
Ng - number of genotypes; Na - number of alleles; Nal - number of alleles per loci; Npa - number of private alleles, GD -
gene diversity; PIC - polymorphic information content
Table 4 Analysis of molecular variance for the investigated barley germplasm related to the growth habit and morphological classification
Source
of variation df
Variance of
component % st P
growth habit classification
Among groups 2 0.07706 23.15 0.2315 0.000
Between groups 142 0.25584 76.85 – –
morphological classification
Among groups 1 0.03299 10.55 0.1055 0.000
Between groups 143 0.27964 89.45 – -
**P < 0.01
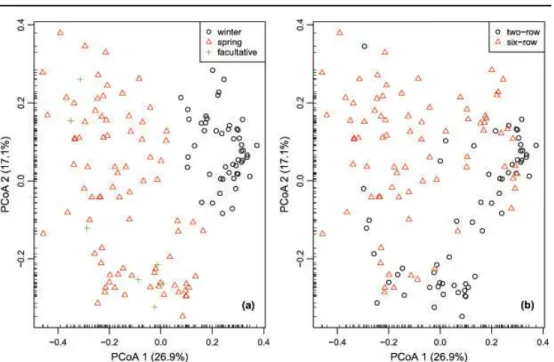
The first two PCoA axes explained a higher amount of variation (26.9 and 17.1%, respectively) (Fig. 2). Based on the projection of accessions in the Cartesian two-dimensional plane (Fig 2a) the winter growth habit group is separated from the facultative one conspicuously and from most accessions belonging to the spring growth habit group. Grouping of the accessions belonging to the different row type groups was not obvious neither along PCoA1 nor PCoA2 axes (Fig 2b). The estimated population structure adopting K = 2 for the model-based
Fig 1 Unweighted pair group method with arithmetic mean cluster dendrogram of 145 barley accessions based on shared allele distance (DSA) matrix
Fig 2 Plot of the first two principal coordinates (PCoA) based on shared allele distance (DSA) matrix for 145 barley accessions with respect to: growth habit grouping of accessions (a), and morphological grouping of accessions based on row type (b)
Fig 3 Bar plot of estimated population structure membership of 145 barley accessions. Each accession is represented by a thin vertical segment which is partitioned into K colored segments that represent
DISCUSSION
To this date molecular assessment of diversity of barley genotypes from the Serbian GenBank has not been conducted. The average number of alleles per SSR indicated a greater magnitude of diversity among the barley accessions included in this study. Much lower values for average number of alleles per locus were obtained for the 15 and 16 SSR primers, screened over 26 and 69 barley accessions in the reported studies, respectively (HAMZA et al., 2004;
JAISWAL et al., 2010). While in a worldwide set of 953 barley accessions, on average 16.7 alleles/marker were found, in the subset of 565 European accessions released over the century 11.3 alleles per locus were reported (MALYSHEVA-OTTOet al., 2007). In the six rowed accessions
the average number of alleles per locus was greater than in the two rowed accessions what is in accordance with the study of ORDONet al., (2005). The number of unique alleles was the highest
for the spring growth type. Therefore, these barley accessions can be considered as an important genetic reservoir for mainstream spring barley breeding in Serbia.
PIC value represented more than 50% of polymorphism, which confirms that SSR markers used in this study were highly informative and are generally extremely useful in distinguishing the polymorphic rate of a marker at a specific locus. PIC is also an estimate of the discriminatory power of an SSR marker locus (HAMZAet al., 2004). Our PIC values were higher
than the previously reported PIC values by HAMZAet al., (2004) and PANDEYet al., (2006) and
lower than those in the study of VARSNEYet al., (2010). Higher PIC values were obtained in the six-rowed group than in the two-rowed group in our study. The descending order of growth habit groups regarding PIC value in our study is spring, facultative and winter group. PIC showed strong significant correlation with the number of alleles per loci (r = 0.580) (not shown) but PANDEY et al., (2006) reported stronger correlation (r = 0.760) obtained in the study of barley
genetic diversity.
Molecular analysis among the three growth habit groups showed that genetic diversity was higher in the spring growth habit group than in the facultative and winter group, and can be possibly related to adaptation of spring growth habit accessions to a broad range of environmental conditions. The lower level of polymorphism in the winter growth habit group may be attributed to the narrower genetic diversity of this group, as 48 of 52 originated from the same country (Serbia). MIKEL and KOLB (2008) showed that genetic diversity estimated with coefficient of parentage was substantially lower for six-row malting barley versus two row malting barley, but among feed types a greater diversity was present within six-rowed than within two-rowed types. For German winter barley cultivars, a slight decrease of genetic diversity over time was found for six-rowed cultivars; whereas in two-rowed cultivars a considerable increase was detected according to ORDON et al. (2005). Contrary to our results MALYSHEVA-OTTO et al. (2007) between-group component accounted only for 19.48% and
16.98% of the total variation for row type and growth habit groups, respectively. Also
SOLEIMANIet al. (2005) reported for barley grown in the USA and Canada, a 22.6% and 23.2%
variance component between two-rowed versus six-rowed and spring versus winter cultivars. Subcluster IIIa and IIIc included only spring types both 2-rowed and 6-rowed, IVb included only winter types both 6- rowed and 2-rowed; IIa, IIIb and IVa included spring and facultative types both 6- rowed and 2-rowed. According to HAMZA et al. (2004) two-rowed
using PCoA revealing separation of the winter growth habit group from the facultative group. Acording to PILLENet al., (2000) the first principal coordinate clearly differentiated winter and
spring barley forms. Model-based estimates hold an advantage over distance-based estimates because structural membership proportions are quantitatively assigned, which account for admixture in individuals that may be assigned to more than one sub-population. Of the 145 accessions 83.33% were assigned to one of the two sub-populations, the remainder was of mixed-origin. This procedure has been used for clustering of collections of barley genotypes and for evidence of population substructure (ORDONet al., 2005; PANDEY et al., 2006; SUNet al.,
2011).
From the study conducted it was concluded, that barley accessions fingerprinting with 15 EST SSR primers were sufficient enough to distinguish between 145 genotypes from the Serbian barley GenBank. Marker based identification and selection of the diverse genotypes could be helpful both for the development of new barley varieties. Usability of this collection regarding detection of novel resistance genes (PEROVIC et al., 2001; KÖNIG et al., 2012) was
already confirmed but current results enable more efficient screening procedures in the future. Although some of the accessions named MBR contains very useful genes, their passport data could not be found in the GeneBank documentation.
ACKNOWLEDGEMENT
This study was funded by the German Academic Exchange Service (DAAD)and was conducted at the Julius Kühn-Institut, Quedlinburg, Germany. This work was supported by the Ministry of Education and Science of the Republic of Serbia (Grant No. TR31092).
Received November 09th, 2012
Accepted March 12th, 2013
REFERENCES
DODIG, D., M. ZORIC, D. KNEZEVIC, S.R. KING, G. SURLAN-MOMIROVIC (2008): Genotype × environment interaction for wheat yield in different drought stress conditions and agronomic traits suitable for selection. Aust. J. Agric. Res. 59(6): 536-545
DODIG, D., M. ZORIC, B. KOBILJSKI, G. SURLAN-MOMIROVIC, S. QUARRIE (2010): Assessing drought tolerance and regional patterns of genetic diversity among spring and winter bread wheat using simple sequence repeats and phenotypic data. Crop Pasture Sci, 61(10): 812-824
DODIG, D., M. ZORI , V. KANDI , D. PEROVI , G. ŠURLAN-MOMIROVI (2012): Comparison of responses to drought stress of 100 wheat accessions and landraces to identify opportunities for improving wheat drought resistance. Plant Breeding, 131(3): 369-379
FALUSH, D., M. STEPHENS, J.K. PRITCHARD (2003): Inference of population structure using multilocus genotype data: linked loci and correlated allele frequencies. Genetics 164: 1567-1587
GOUDET, J. (2002): FSTAT: a program to estimate and test gene diversities and fixation indices, Version 2.9.3.2. Institute of Ecology and Evolution, University of Lausanne, Lausanne, Switzerland http://www.unil.ch/izea/softwares/fstat.html
HAMZA, S., W. BEN HAMIDA, A. REBAÏ, M. HARRABI (2004): SSR-based genetic diversity assessment among Tunisian winter barley and relationship with morphological traits.Euphytica 135: 107–118
HAYES, P.M., A. CASTRO, L. MARQUEZ-CEDILLO, A. COREY, C. HENSON, B. JONES, J. KLING, D. MATHER, I. MATUS, C. ROSSI,
In: R. Von Bothmer, H. Knupfeer, T. van Hintum, K. Sato (eds.) Diversity barley, Elsevier Science Publishers, Amsterdam
JAISWAL, S.K., S.P. PANDEY, S. SHARMA, R. PRASAD, L.C. PRASAD, R.P.S. VERMA, A.K. JOSHI (2010): Diversity in Indian barley (Hordeum vulgare) cultivars and identification of genotype-specific fingerprints using microsatellite markers. J. Genet. 89: 46-54
KNÜPFFER, H., L. MAGGIONI, M. JALLI, A. KOLODINSKA BRANTESTAM, D. FASOULA, E. LIPMAN (2011): Report of a Working Group on Barley-Seventh Meeting 10-12th May 2011 at the Nicosia Cyprus, Bioversity International, Rome
http://www.bioversityinternational.org/nc/publications/publication/issue/report_of_a_working_group_on_barley.html KÖNIG, J., B. STEFFENSON, D. KOPAHNKE, N. PRZULJ, T. ROMEIS, F. ORDON, D. PEROVIC (2012): Genetic mapping of novel
leaf rust (Puccinia hordei Otth) resistance in barley landrace MBR1012. Mol. Breed. 30:1253–1264
LEWIS, P.O.and D. ZAYKIN (2001): Genetic data analysis-Computer program for the analysis of allelic data. Version 1.0 (d16c). Free program distributed by the authors over the internet from http://lewis.eeb.uconn.edu/lewishome/software.html
MALYSHEVA-OTTO, L., M.W. GANAL, J.R. LAW, J.C. REEVES, M.S. RÖDER (2007):Temporal trends of genetic diversity in European barley cultivars (Hordeum vulgare L.). Mol. Breed. 20: 309-322
MATUS, I.A. and P.M. HAYES (2002): Genetic diversity in three groups of barley germplasm assessed by simple sequence repeats. Genome 45: 1095–1106
MIKEL, MA. and F.L. KOLB (2008): Genetic Diversity of Contemporary North American Barley. Crop Sci. 48:1399–1407
ORDON, F., J. AHLEMEYER, K. WERNER, W. KÖHLER, W. FRIEDT (2005): Molecular assessment of genetic diversity in winter barley and its use in breeding. Euphytica 146: 21-28
PANDEY, M., C. WAGNER, W. FRIEDT, F. ORDON (2006): Genetic relatedness and population differentiation of Himalayan hulless barley (Hordeum vulgare L.) landraces inferred with SSRs. Theor. Appl. Genet. 113: 715-729
PAVLOVI , N., J. ZDRAVKOVI , D. CVIKI , M. ZDRAVKOVI , S. ADŽI , S. PAVLOVI , G. ŠURLAN-MOMIROVI (2012): Characterization of onion genotypes by use of RAPD markers. Genetika-Belgrade, 44(2): 269-278
PEROVIC, D., N. PRZULJ, M. MILOVANOVIC, S. PRODANOVIC, J. PEROVIC, D. KOPHANKE, F. ORDON, A. GRANER (2001): Characterisation of spring barley genetic resources in Yugoslavia. In: Proceedings of a symposium dedicated to the 100th birthday of Rudolf Mansfeld, Band 22: 301-306
PEROVIC, J., C. SILVAR, J. KOENIG, N. STEIN, D. PEROVIC, F ORDON (2013) A versatile fluorescence-based multiplexing assay for CAPS genotyping on capillary electrophoresis systems. Mol. breed. DOI 10.1007/s11032-013-9852-x
PILLEN, K., A. BINDER, B. KREUZKAM, L. RAMSAY, R. WAUGH, J. FÖRSTER, J. LÉON (2000): Mapping new EMBL-derived barley microsatellites and their use in differentiating German barley cultivars. Theor. Appl. Genet. 101: 652–660
PRITCHARD, J.K., M. STEPHENS, P. DONNELLY (2000): Inference of population structure using multilocus genotype data. Genetics 155: 945–959
SALEM AHSYEE, R., O. AL-SLOGE, I. ALI , G. BRANKOVI , M. ZORI , U. MOMIROVI, S. VASILJEVI , G. ŠURLAN
-MOMIROVI (2013): Genetic diversity of alfalfa domesticated varietal populations from Libyan genbank revealed by the RAPD markers. Arch. Biol. Sci., 65(2): 595-602 DOI: 10.2298/ABS1302595A
SCHNEIDER, S., D. ROESSLI, L. EXCOFFIER (2000): ARLEQUIN Version 2.000: software for population genetic data analysis. Genetics and Biometry Laboratory, University of Geneva, Geneva
SOLEIMANI, V.D., B.R. BAUM, D.A. JOHNSON (2005): Genetic diversity among barley cultivars assessed by sequence-specific amplification polymorphism. Theor. Appl. Genet. 110: 1290-1300
STEIN, N., G. HERREN, B. KELLER (2001): A new DNA extraction method for high-throughput marker analysis in a large-genome species such as Triticum aestivum. Plant Breed. 120: 354–356
TAMURA, K, J. DUDLEY, M. NEI, S. KAMURA (2007): MEGA4: Molecular Evolutionary Genetics Analysis (MEGA) software version 4.0. Mol. Biol. Evol. 24: 1596-1599
MOLEKULARNA KARAKTERIZACIJA GENOTIPOVA JE MA (Hordeum vulgare L.) IZ GEN BANKE SRBIJE SSR MARKERIMA
Gordana ŠURLAN-MOMIROVI 1, Ilona KRÄMER2, Kamenko BRATKOVI 3, Miroslav ZORI 4, Una MOMIROVI 5, Gordana BRANKOVI 1, Irena ALI 1, Vesna KANDI 6, Novo
PRŽULJ4, Frank ORDON2, Dragan PEROVI 2*
1 Univerzitet u Beogadu, Poljoprivredni fakultet, Beograd, Srbija 2 Julius Kühn-Institut (JKI), Quedlinburg, Nema ka
3 Centar za strna žita, Kragujevac, Srbija 4 Institut za ratarstvo i povrtarstvo, Novi Sad, Srbija 5
Državni Univerzitet u Novom Pazaru, Beograd, Srbija 6 Institut za kukuruz “Zemun Polje”, Zemun, Srbija
Izvod
Molekularni diverzitet 145 genotipova je ma (Hordeum vulgare subsp. vulgare L.) iz Gen Banke
Srbije je procenjen SSR markerima. Koriš eno je SSR markera sa svih hromozoma diploidnog genoma je ma u proseku 2-3 markera po hromozomu i sa 4-18 alela po lokusu. Utvr eno je 15 lokusa i 119 alela sa prosekom od 7.93 alela po lokusu. PIC je bio u opsegu od 0.220 do 0.782 sa prosekom 0.534. Genski diverzitet je bio ve i za jare (0.616) i šestorede genotipove (0.616) u odnosu na ozime i dvorede (0.322 i 0.478). Analizom molekularne varijanse utvr ena je zna ajnost svih izvora variranja (P < 0.01), ali je me ugrupna komponenta dominirala.
Primenom metoda UPGMA analize zasnovane na zajedni koj distanci alela (DSA) na osnovu
SSR podataka dobijeno je grupisanje genotipove u dva klastera-jedan manji koji sadrži šest šestoredih jarih genotipova je ma i drugi koji je obuhvatao šest podklastera. Genotip MBR1012 je bio odvojen od svih ostalih genotipova. Koriš enjem metoda Osnovna Analiza Koordinata dobijeno je razdvajanje ozimih genotipova je ma od fakultativnih. Utvr eno je postojanje dve podpopulacije genotipova primenom algoritma grupisanja STRUCTURE.