Cop
yright
© ABE&M t
odos os dir
eit
os r
eser
vados
.
1 Unit of Endocrinology, School of Medicine, Universidade de Brasília (UnB), DF, Brazil 2 School of Physical Education, Centro Universitário de Brasília (UniCEUB), Brasília, DF, Brazil
Correspondence to:
Luciana Ansaneli Naves SQS 111, bloco B, ap. 23 70374-020 – Brasilia, DF, Brazil draluciananaves@gmail.com
Received on Nov/2/2012 Accepted on Mar/25/2013
Physical activities in daily life and
functional capacity compared
to disease activity control in
acromegalic patients: impact
in self-reported quality of life
Avaliação da atividade física na prática de vida diária
comparada com o nível de atividade da doença em pacientes acromegálicos: impacto na percepção da qualidade de vida
Renata Aparecida Elias Dantas1,2, Karine Elias Passos1, Lara Benigno Porto1,
Juliano Coelho Oliveira Zakir1, Marcia Cristina Reis1, Luciana Ansaneli Naves1
ABSTRACT
Objective: To evaluate the quality of life and its association with daily physical activity and disease control in acromegalic patients. Subjects and methods: A cross-sectional, case series study, com-posed of 42 patients recruited from the Neuroendocrinology Unit of the University Hospital of Brasi-lia. Level of physical activity was accessed by the International Physical Activity Questionnaire (IPAQ 6-short-form), which evaluates the weekly time spent on physical activity of moderate to vigorous intensity in different contexts of life. Quality of life was evaluated by The Medical Outcome Study Ques-tionnaire Short Form (SF-36). Data was compared to growth hormone (GH) and insulin-like growth factor (IGF-1) levels. Students’ t test and Fisher test were used, p < 0.05, SPSS 17.0. Results: Twenty--two women, aged 51.33 ± 14.33 and 20 men, aged 46.2 ± 13.18 were evaluated. Arthralgia was present in 83% of cases. In men, the most common sites of pain were the knees (73%), spine (47% lumbar, and 53% thoracic and cervical segments), hands and wrists (40%). Higher scores on SF-36 were observed in patients with intermediate or high levels of physical activity, in the domains social functioning (75 CI 57.3-92.6), general health (75.5 CI 60.4-90.5), mental health (70 CI 57.8-82.1). Conclusions: In this study, the presence and severity of physical disability and pain were not associated with initial GH and IGF-1 levels or time of exposure to GH excess. However, the patients considered controlled, with normal a normal age-adjusted IGF-1, presented higher scores in SF-36, in physical and emotional domains, compared with patients with persistent hypersomatotrophism. These indings suggest beneits of me-tabolic control in self-reported quality of life. Arq Bras Endocrinol Metab. 2013;57(7):550-7
Keywords
Acromegaly; quality of life; functional capacity; activities in daily life
RESUMO
Objetivo: Avaliar a qualidade de vida e sua associação com a prática de vida diária e controle metabóli-co em pacientes portadores de acromegalia. Sujeitos e métodos: Estudo seccional de série de casos, composto por 42 pacientes recrutados na Unidade de Neuroendocrinologia do Hospital Universitário de Brasília. O nível de atividade física foi estimado pelo Questionário Internacional de Atividade Física (IPAQ-6), que avalia o tempo gasto semanalmente em atividades físicas que variam de intensidade em diferentes contextos de vida. A qualidade de vida foi avaliada pelo questionário SF-36. Os dados obtidos foram comparados aos níveis de hormônio do crescimento (GH) e fator de crescimento semelhante à insulina (IGF-1). Os testes t Students e Fisher foram aplicados e p < 0,05 foram considerados
signiicati-vos, SPSS 17.0. Resultados: Avaliaram-se 22 mulheres com idades de 51,33 ± 14,33 e 20 homens com idades de 46,2 ±13,18. Artralgia foi relatada em 83% dos pacientes. Em homens, os sítios de dor mais comuns foram os joelhos (73%), coluna vertebral (47% lombar, 53% segmentos torácico e cervical), mãos e quadris (40%). Os maiores escores no SF-36 foram observados em pacientes com níveis inter-mediário ou alto de atividade física, sobretudo nos domínios social (75 CI 57,3-92,6), saúde geral (75,5 CI 60,4-90,5), saúde mental (70 CI 57,8-82,1). Conclusões: A presença e a severidade do prejuízo no desempenho físico e dor não se associaram com Gh e IGF-1 no diagnóstico, tempo de exposição prévio à doença. Todavia, pacientes considerados controlados apresentaram melhores escores nos domínios físico e emocional, comparados com pacientes com hipersomatotroismo persistente. Tais achados su-gerem benefícios do controle metabólico na qualidade de vida. Arq Bras Endocrinol Metab. 2013;57(7):550-7 Descritores
Cop
yright
© ABE&M t
odos os dir
eit
os r
eser
vados
.
INTRODUCTION
A
cromegaly is a rare chronic disease, due to growth hormone (GH) and insulin-like growth factor (IGF-1) oversecretion (1). The estimated prevalence is 40-70 patients for one million inhabitants, and the age of diagnosis occurs in most cases in the third to ifth decade of life. The disease is associated with reduced expectancy of life and high mortality related to cardio-vascular and metabolic co-morbidities. (2,3).The disease results in most cases from a somatotro-pic pituitary tumor (4), but is rarely associated to neu-roendocrine ectopic tumors and uncommon genetic familial syndromes (5,6). The behavior is insidious and the delay in diagnosis may be more than 10 years after the tumor development (7).
The most prevalent clinical manifestations are soft tissue enlargement, organomegaly, and metabolic complications. The cardiovascular disease is related to more than 60% of mortality in acromegalic pa-tients (8). Hypertension occurs in more than 46% of patients with acromegaly and a higher frequency of classic and non-classic cardiovascular risk factors was described (9,10).
The articular manifestations are frequent and may be present as the earliest symptom of acromegaly (11). Arthropathy can affect both axial and peripheral joints; the most involved are hips, shoulders, knees, hands, and elbows. It is frequently irreversible despite treat-ment, and may contribute to decreased quality of life (Qol) (12). Musculoskeletal impairment is related to articular damage and its prevalence and severity wors-ens with the duration of uncontrolled disease, resulting in signiicant physical disability (13).
Some studies compared the quality of life in patients with several types of pituitary tumors, treated for long periods of time, using questionnaires to evaluate Qol, anxiety and depression. The authors concluded that patients treated for acromegaly reported more impair-ment in physical ability and more pain compared to pa-tients treated for nonfunctioning macroadenomas and prolactinomas (14). The questionnaire SF-36 has been described as an important tool to evaluate the self-re-ported quality of life, and may be useful in patients with acromegaly (15-17).
The impairment in quality of life in acromegalic pa-tients may be related to depression, poor self-image, pain, mood swings, impaired physical activity and men-tal health (15,18). This study evaluated postural
de-fects, physical disability in daily life activities, and the consequences in quality of life in a cohort of Brazilian acromegalic patients.
AIM OF THIS STUDY
The aims of this study were to describe the impairment in physical ability for daily life activities and functioning, and compare it with the quality of life and its relation with the type of treatment and activity of the disease in acromegalic patients.
SUBJECTS AND METHODS
This is a cross-sectional, case series study that enro lled 42 patients with conirmed diagnosis of acromegaly (19,20), recruited from outpatient clinics of the Neu-roendocrine Unit of the University Hospital of Brasi-lia. Before beginning the study, a structured anamne-sis, medical record review, physical evaluation of each participant were put together to document symptoms, co-morbidities, current medications, and previous treatments. All patients were submitted to GH and IGF-1 determinations, using standardized chemilumi-nescence methods (Immulite 2000-IS 98/574). The patients were categorized by gender, tumor size and invasiveness, previous treatments (surgery, radiothera-py, medical treatment), and activity of disease (control-led and not control(control-led). All patients answered speciic questionnaires to evaluate the level of physical activity and quality of life. All procedures used in this study were in accordance with the resolution 196/96 from the Brazilian Ministry of Health, and were approved by the ethics committee from our institution. All patients signed an informed consent form before the inclusion in the study.
Evaluation of level of physical activity and quality of life
The level of physical activity was evaluated by the In-ternational Physical Activity Questionnaire (IPAQ 6- short-form), which measures the weekly time spent on physical activity, from mild to vigorous intensity, in different contexts of life, such as work, housekeeping, transportation, and leisure (21).
quali-Cop
yright
© ABE&M t
odos os dir
eit
os r
eser
vados
.
ty of life, translated and validated for Brazil (18). This questionnaire is composed of 36 items, grouped in eight health domains: functional capacity, physical as-pects, pain, general health, vitality, social functioning, emotional aspects and mental health, and self-reported health status (18,22).
Clinical anamnesis and evaluation of pain
Clinical anamnesis was performed and an interview in the form of a questionnaire was used to assess the patients’ perception of the presence and intensity of headaches and osteoarticular pain. In this instrument, a map demonstrating a human igure to show sites of discomfort by a Visual Analogue Scale for pain was pre-sented to each patient (23). All patients were photogra-phed in front of a white background, at a distance of 3 meters, in anterior, posterior, right, and left position as proposed by Kendall (24). All patients were using bathing suits, and were in orthostatic position with the body relaxed. The data was inserted in the software Physical Test 6.3-Terrazul.
Statistical analysis
Student’s t test was performed for the comparative analysis of quantitative variables. Fisher exact test was used to compare frequencies and determine associa-tions between categorical variables. The distribuassocia-tions of all continuous variables were reviewed for normality using the Kolmogorov-Smirnov test. Relationships be-tween continuous variables were accessed by Spearman Rank or Pearson correlations. All statistical analyses were conducted using the Statistical Package for Social Sciences (SPSS 17.0) and p values < 0.05 were conside-red statistically signiicant.
RESULTS
Characteristics of the sample
The group was composed of 22 women and 20 men aged 53.63 ± 14.3 and 46.35 ± 13.18 years old, res-pectively. The delay between the irst symptoms and diagnosis for the whole cohort was 5.43 years, but no statistically signiicant differences were found between genders (p = 0.92). The women presented a tendency to have higher mean age at diagnosis than men at the inclusion in the study, but no statistical difference was found (Table 1).
Tumor size
By the time of diagnosis, 89.4% of women had macro-adenomas (17.05 mm; CI 95% 12.77-21.33), 36.8% with supra and parasellar invasion to cavernous sinus and carotids (Table 2). In men, 13.04% had microa-denomas and the frequency of invasive macroadeno-mas was 43.47% (21.35 mm; CI 95% 16.52-26.18) (p = 0.18 calculated by test t for difference between genders).
Table 1. Description of baseline characteristics of study subjects, categorized by gender
Age at diagnosis Age at the inclusion Delay symptoms and diagnosis
Time of exposure to GH excess
Women 44.95
(37.68-52.22)
53.63 (47.15-60.11)
5.37 (3.59-7.15)
12.95 (9.86-16.04)
Men 37.83
(32.59-43.07)
46.35 (41.20-51.50)
5.48 (3.74-7.22)
14.39 (11.34-17.44)
Total 41.05
(36.74-45.36)
49.64 (45,59-53,69)
5.43 (4.23-6.62)
13.74 (11.64-15.83)
p-value 0.09 0.07 0.93 0.49
p values calculated by the Student’s t test, statistically signiicant when < 0.05. Results are expressed in means of years, and conidence intervals (CI 95%).
N = 42 patients.
Table 2. Distribution of frequency of tumor size and invasion at the diagnosis, categorized by gender
Intrasellar microadenoma
(%)
Intrasellar macroadenoma
(%)
Invasive macroadenoma
(%)
Women 10.53 52.6 36.8
Men 13.04 56.5 43.47
p -value 0.09 0.93 0.18
p values calculated by the Fisher exact test, statistically signiicant when < 0.05. Results are
Cop
yright
© ABE&M t
odos os dir
eit
os r
eser
vados
.
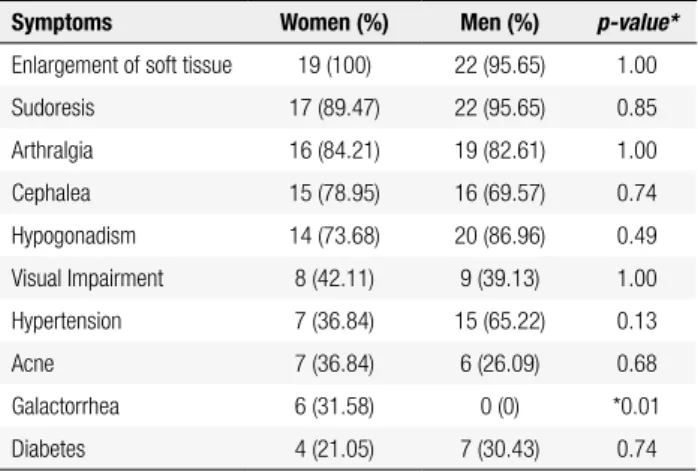
Frequency of symptoms reported at the diagnosis
The frequency of symptoms was categorized by gender (Table 3). Enlargement of soft tissue was the most valent complaint in both genders. Arthralgia was pre-sent in 84.21% of women and 82.61% of men. Sudore-sis and cephalea were very frequent, with no statistically signiicant differences between genders.
Table 3. Distribution of frequency of symptoms at the diagnosis, categorized by gender
Symptoms Women (%) Men (%) p-value*
Enlargement of soft tissue 19 (100) 22 (95.65) 1.00
Sudoresis 17 (89.47) 22 (95.65) 0.85
Arthralgia 16 (84.21) 19 (82.61) 1.00
Cephalea 15 (78.95) 16 (69.57) 0.74
Hypogonadism 14 (73.68) 20 (86.96) 0.49
Visual Impairment 8 (42.11) 9 (39.13) 1.00
Hypertension 7 (36.84) 15 (65.22) 0.13
Acne 7 (36.84) 6 (26.09) 0.68
Galactorrhea 6 (31.58) 0 (0) *0.01
Diabetes 4 (21.05) 7 (30.43) 0.74
* p values calculated by the Fisher exact test, statistically signiicant when < 0.05. Results are
expressed in percentage.
Treatment before the inclusion in the study
All patients were submitted to previous treatments, 76.19% were submitted to one surgery, 23.6% to two surgeries, and 34.37% of the operated patients were submitted to further radiotherapy. Primary treatment with somatostatin analogs was prescribed to 23.80% of patients and 11.30% of them was treated by combined cabergoline and octreotide.
Metabolic control at inclusion
Considering the current criteria for cure and control of Acromegaly (19,20), 26.32% of women and 4.35% of men were considered cured, 68.42% of women and 60.87% of men were considered controlled by medical treatment (p = 0.85), and the other patients were con-sidered with uncontrolled disease, despite the previous and current treatments as surgery, radiotherapy, and so-matostatin analogs (p = 0.11).
Distribution, frequency and intensity of pain symptoms
More than 80% of patients complained of arthralgia by time of inclusion in the study. In men, the most
com-mon sites of pain were the knees (73%), spine (47%), hands and wrists (40%). Most of the women presen-ted multiple sites of pain. The most frequent site was the spine (47% lumbar, and 53% thoracic and cervi-cal segments). The intensity of pain was evaluated by a Visual Analogue Scale and was reported as intense by 33.3% of women and 22.2% of men, moderate by 46.7% of women and 48.1% of men, and mild in 20% of women and 29.6% of men. Pain of severe intensity was reported more frequently on shoulders and spine. The frequency of pain was described as 3 to 5 days per week, in 53.3% of women and 7.4% of men, but 44.4% of men reported daily pain. There was no association between severity of pain and number of surgeries (r = 0.25, p = 0.19), or time to achieve metabolic control (r = 0.01, p = 0.08).
Postural defects
The analysis of the frequency of postural defects sho-wed that 53% of men and 45% of women presented
Genu varus, and Genu valgus was observed in 18% of women and 9% of men (Figure 1). Spine deviations (scoliosis, kyphosis or lordosis) were noted on 90% of patients, and 80% presented more than two deviations as asymmetry, scoliosis, cervical or lumbar lordosis, or hyperkyphosis (Figure 2). It was noted that 58% of pa-tients had abdominal protrusions. Shoulder deviations were frequent, and more than two deviations (unilate-ral or bilate(unilate-ral asymmetry, internal rotation) were ob-served in 35% of men and 45% of women (Figure 3). There was no correlation between postural defects and disease activity (r = 0.6 p = 0.12), nor between postu-ral defects and time of exposure to growth hormone hypersecretion (r = 0.3 p = 0.47).
0. 10. 20. 30. 40. 50. 60.
None
Men Women
Genu varus Genu valgus
Figure 1. Frequency of knee deviations according to gender. Gray columns represent women, and black columns represent men. There was no statistical difference between genders for Genu varus (p = 0.46), Genu
valgus (p = 1.0) or absence of abnormalities (p = 0.44). P-value calculated
Cop
yright
© ABE&M t
odos os dir
eit
os r
eser
vados
.
activity, we observed a tendency to present higher sco-res on SF-36 (Table 4), concerning the domains social functioning (75 CI 57.3-92.6), general health (75.5 CI 60.4-90.5), and mental health (70 CI 57.8-82.1), although no signiicant statistical differences were ob-served comparing to patients with low physical activity level (p = 0.23, p = 0.11, p = 0.62,respectively).
The scores obtained on SF-36 domains were com-pared with the normal population, and were lower than Jenkinson and cols. data for all domains (35). In Role Physical and Pain, the study population obtained scores 56.67 ± 40.44 and 55.67 ± 23.59, but previously pu-blished data showed that in the healthy population, the scores were respectively 80.1 ± 34,9 and 84.8 ± 31.3 (Table 6). Patients with intermediate or high levels of physical activity frequently reported pain in anamnesis, but presented a tendency to have higher mean score in the domain pain on SF-36 (65.5, 48.61 ± 82.39) than patients with mild level of physical activity (52.27, 41.60 ± 62.95) (p = 0.06).
Domains of SF-36 categorized by level of disease activity
The patients were categorized in two groups by the level of activity of disease: controlled, when GH and IGF-1 were normal for age and gender; and uncon-trolled, when GH or IGF-1 were higher than reference ranges. The scores for all domains of SF-36 presented a tendency to be higher in patients with controlled le-vels of GH and IGF-1, and statistical differences were found in the domains Role Physical (p = 0.02), Pain (p
= 0.03), Vitality (p = 0.02), Role Emotional (p = 0.03) (Figure 4).
0. 10. 20. 30. 40. 50. 60.
None Hyper lordosis Hyperkyfosis Scoliosis
Men Women
Figure 2. Frequency of spine deviations according to gender. Gray columns represent women, and black columns represent men. There was no difference between groups concerning hyperlordosis (p = 1.0), hyperkyfosis (p = 1.0), absence of abnormalities (p = 0.67), scoliosis (p = .0.9). P-value calculated by Fisher test, p < 0.05 were considered statistically signiicant.
Men Women 0.
10. 20. 30. 40. 50.
Intern rotation of shoulders
Right assymmetry
Left assymmetry
More than 2 deviations
Figure 3. Frequency of shoulder deviations according to gender. There was no difference between genders on internal rotation (p = 0.44), right asymmetry (p = 0.39), right asymmetry (p = 0.43), more than 2 deviations right asymmetry (p = 0.70). Results are expressed in percentage. P-value calculated by Fisher test, p < 0.05 was considered statistically signiicant.
Level of physical activity and quality of life
The level of Physical Activity is expressed by weekly time spent on physical activity, from mild to vigorous intensity, in different contexts of life, and was compared with functional capacity score and emotional aspects. In patients with intermediate or high levels of physical
Table 4. Level of Physical Activity (IPAQ-6) and Dimensions of the Analysis of Quality of Life (SF-36)
Domains (SF-36)
Physical Activity Level (IPAQ-6)
Low Intermediate/High
Mean CI (95) Mean CI (95) p value
Physical functioning 47.95 37.65‐58.25 63.13 44.84‐81.41 0.12
Role physical 52.27 34.20‐70.34 53.13 15.34‐90.91 0.96
Pain 52.27 41.60‐62.95 65.5 48.61‐82.39 0.06
General health 62.36 52.64‐72.09 75.5 60.49‐90.51 0.11
Vitality 55.45 45.76‐65.15 59.38 46.85‐71.90 0.59
Social functioning 63.07 50.44‐75.69 75.00 57.34‐92.66 0.23
Role emotional 51.52 32.86‐70.17 58.33 25.87‐90.80 0.68
Mental health 66.73 5838‐75.07 70.00 57.88‐82.12 0.62
Cop
yright
© ABE&M t
odos os dir
eit
os r
eser
vados
.
Table 6. Scores found in the domains of SF-36 in acromegalic patients compared with the normal population (Jenkinson and cols., 1996)
Domains (SF-36) Study cohort n = 42
Normal population (Jenkinson and cols.,
1996) n = 712
Physical functioning 67.17 ± 23.88 79.4 ± 23.88
Role physical 56.67 ± 40.44 80.1 ± 34.90
Pain 55.67 ± 23.59 84.8 ± 31.30
General health 67.67 ± 17.03 86.9 ± 21.90
Vitality 56.50 ± 20.09 75.9 ± 17.40
Social functioning 68.13 ± 25.84 60.3 ± 20.50
Role emotional 58.73 ± 40.81 76.6 ± 25.0
Mental health 68.00 ± 17.60 68.4 ± 21.6
Results are expressed as means and standard deviations.
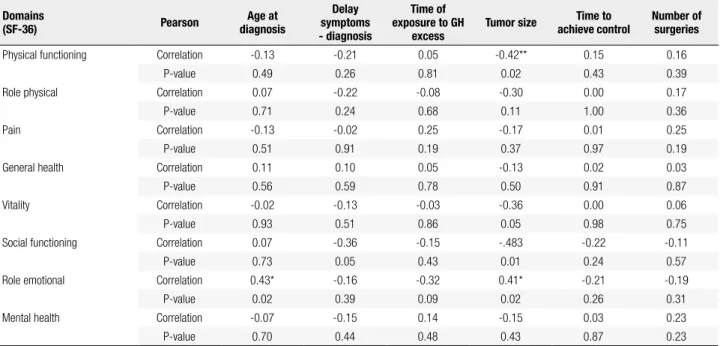
Table 5. Dimensions of the Analysis of Quality of Life (SF-36) compared with clinical aspects
Domains
(SF-36) Pearson
Age at diagnosis
Delay symptoms - diagnosis
Time of exposure to GH
excess
Tumor size Time to achieve control
Number of surgeries
Physical functioning Correlation -0.13 -0.21 0.05 -0.42** 0.15 0.16
P-value 0.49 0.26 0.81 0.02 0.43 0.39
Role physical Correlation 0.07 -0.22 -0.08 -0.30 0.00 0.17
P-value 0.71 0.24 0.68 0.11 1.00 0.36
Pain Correlation -0.13 -0.02 0.25 -0.17 0.01 0.25
P-value 0.51 0.91 0.19 0.37 0.97 0.19
General health Correlation 0.11 0.10 0.05 -0.13 0.02 0.03
P-value 0.56 0.59 0.78 0.50 0.91 0.87
Vitality Correlation -0.02 -0.13 -0.03 -0.36 0.00 0.06
P-value 0.93 0.51 0.86 0.05 0.98 0.75
Social functioning Correlation 0.07 -0.36 -0.15 -.483 -0.22 -0.11
P-value 0.73 0.05 0.43 0.01 0.24 0.57
Role emotional Correlation 0.43* -0.16 -0.32 0.41* -0.21 -0.19
P-value 0.02 0.39 0.09 0.02 0.26 0.31
Mental health Correlation -0.07 -0.15 0.14 -0.15 0.03 0.23
P-value 0.70 0.44 0.48 0.43 0.87 0.23
Correlations calculated by Pearson test and p-values statistically signiicant when < 0.05.
Table 7. Analysis of domains of SF-36 in patients categorized by activity of the disease, as cured or active acromegaly
Domains (SF-36) Cured Mean ± SD Standard
error P value
Physical functioning
Yes 71.25 ± 29.55 14.77
0.72 No 66.54 ± 23.53 4.61
Role physical
Yes 6.25 ± 12.5 6.25
0.01* No 64.42 ± 37.53 7.36
Pain
Yes 54.75 ± 28.37 14.19
0.94 No 55.81 ± 23.42 4.59
General health
Yes 57.00 ± 14.74 7.37
0.18 No 69.31 ± 17.01 3.34
Vitality
Yes 58.75 ± 30.65 15.33
0.81 No 56.15 ± 18.83 3.69
Social functioning
Yes 68.50 ± 26.26 13.13
0.98 No 68.08 ± 26.30 5.16
Role emotional
Yes 49.75 ± 42.99 21.50
0.66 No 60.12 ± 41.17 8.07
Mental Health
Yes 66.00 ± 31.07 15.53
0.81 No 68.31 ± 15.01 2,94
Results are expressed in means and standard deviations (SD). p-values statistically signiicant when < 0.05.
74.74
54.0960.5350.00
62.63
43.64 70.16
63.36 62.89
45.45 72.84
60.0066.53
45.27 68.63 66.91
Yes No
* *
*
Physical functioning
Role physical
Pain General health
Vitality Social functioning
Role emotional
Mental health
Figure 4. Dimensions of the Analysis of Quality of Life (SF-36) categorized in two groups, controlled and uncontrolled patients. Results are expressed as means and standard deviations (SD); P-value calculated by Fisher test,
* p < 0.05 was considered statistically signiicant.
DISCUSSION
per-Cop
yright
© ABE&M t
odos os dir
eit
os r
eser
vados
.
centage of postural defects in one or more regions in this cohort of patients. The patients reported pain in different muscle and joint groups and the most affected regions were knees and upper spine. The complaints about pain were daily in almost half of patients, and were proportional and more severe in patients with hi-gher levels of physical activity. These results are in agre-ement with other authors and may be related to the overload in joints that may worsen previous articular disease (16,17,25).
The assessment of perception of the presence and intensity of pain was previously evaluated by a Visual Analogue Scale of discomfort, in other groups of sub-jects without chronic diseases, as healthy students (29), and women (31) submitted to mild or intermediate and high levels of physical activities. The group of acro-megalic patients in our study reported multiple sites of discomfort, and also greater intensity of pain than nor-mal subjects published in other studies (24,27,31).
The chronic exposure to GH oversecretion can be associated with osteoarticular damage and may lead to disability in daily life activities (DLA), with consequen-ces in time spent on physical activities and quality of life. The patients evaluated in this study presented lo-wer level of physical activities than age-matched control subjects, and data published in elderly populations. The problem can be worsened by the daily life activities, with constant changes in posture and the adoption of antalgic positions, postural errors and habits over time (32,33).
The pathogenesis of arthropathy in acromegaly may involve two mechanisms: initial endocrine and subse-quent mechanical changes (12,13). At the initial sta-ge, GH and IGF-1 lead to hyperfunction of articular chondrocytes and increased matrix synthesis, resulting in growth of periarticular structures. Synovial hyper-trophy further exacerbates the abnormal mechanical loading in the joints, which is reversible by hormone control. In advanced cases, the ulceration of the joint cartilage promotes the osteoarthritis, which cannot be improved by GH and IGF-1 normalization (26).
Some authors have previously described that the in-luence of GH and IGF-1 in the osteoarticular system exposes the morphofunctional structure of the indivi-dual to possible hazards (16,17). In this study, the pre-sence and severity of physical disability and pain were not correlated to initial GH and IGF-1 levels, time of previous exposure to GH excess, nor to metabolic control by the inclusion. A recent study investigated
the clinical course of arthropathy and its relationship with radiographic progression in long-term controlled acromegaly patients, and suggested that joint func-tion deteriorates during prolonged follow-up, despite biochemical control of the disease (36). It is currently unknown whether GH and IGF-1 control can reverse arthropathy in patients with acromegaly. However, im-provement in signs and symptoms was demonstrated (34).
In our cohort, the patients considered controlled, with normal a normal age-adjusted IGF-1, presented higher scores in SF-36 in physical and emotional do-mains compared with patients with persistent hyperso-matotrophism despite previous treatments and use of somatostatin analogs or dopamine agonists. These in-dings suggest beneits of metabolic control in quality of life. Studies have been published seeking to demonstra-te that the improvement or possible extinction of chro-nic pain could improve the quality of life in different diseases (14,25,32). Other authors described that the impairment of quality of life may persist despite succes-sful treatment in endocrine diseases (17,36).
In conclusion, the impairment in physical ability for daily life activities was shown in our study, and was not related to the type of treatment and activity of the dise-ase in acromegalic patients. The data suggests beneits of acromegaly disease control in quality of life, based on better scores regarding emotional and physical domains of SF-36. Many unanswered questions about the bene-its of controlled compared with uncontrolled disease regarding reversibility of articular co-morbidities have to be better evaluated in further studies.
Acknowledgements: we would like to acknowledge the Instituto and Laboratorio Sabin-Brasilia, that performed all hormonal tests and UniCEUB for all support.
Disclosure: no potential conlict of interest relevant to this article was reported.
REFERENCES
1. Melmed S. Medical progress: acromegaly. N Engl J Med. 2006;355(24):2558-73.
2. Saccà L, Cittadini A, Fazio S. Growth hormone and the heart. Endocr Rev. 1994;15(5):555-73.
3. Kauppinen-Mäkelin R, Sane T, Reunanen A, Välimäki MJ, Niskanen L, Markkanen H, et al. A Nationwide survey of acromegaly. J Clin Endocrinol Metab. 2005;90(7):4081-6. Epub 2005 May 10. 4. Melmed S. Pathogenesis of pituitary tumors. Nat Rev Endocrinol.
2011;7(5):257-66.
Cop
yright
© ABE&M t
odos os dir
eit
os r
eser
vados
.
responses in patients with germ-line AIP mutations and pituitary adenomas: an international collaborative study. J Clin Endocrinol Metab. 2010;95(11):E373-83.
6. Naves LA, Daly AF, Vanbellinghen JF, Casulari LA, Spilioti C, Magalhães AV, et al. Variable pathological and clinical features of a large Brazilian family harboring a mutation in the aryl hydrocarbon receptor-interacting protein gene. Eur J Endocrinol. 2007;157(4):383-91.
7. Rajasoorya C, Holdaway IM, Wrightson P, Scott DJ, Ibbertson HK. Determinants of clinical outcome and survival in acromegaly. Clin Endocrinol (Oxf). 1994;41(1):95-102.
8. Scacchi M, Cavagnini F. Acromegaly. Pituitary. 2006;9(4):297-303. 9. Vitale G, Pivonello R, Auriemma RS, Guerra E, Milone F,
Savastano S, et al. Hypertension in acromegaly and in the normal population: prevalence and determinants. Clin Endocrinol (Oxf). 2005;63(4):470-6.
10. Vilar L, Naves LA, Costa SS, Abdalla LF, Coelho CE, Casulari LA. Increase of classic and nonclassic cardiovascular risk factors in patients with acromegaly. Endocr Practice 2007;13(4):363-72. 11. Colao A, Pivonello R, Scarpa R, Vallone G, Ruosi C, Lombardi
G. The acromegalic arthropathy. J Endocrinol Invest. 2005;28 (Suppl. 8):24-31.
12. Killinger Z, Payer J, Lazurova I, Imrich R, Homerova Z, Homerova Z, et al. Arthropathy in acromegaly. Rheum Dis Clin North Am. 2010;36(4):713-20.
13. Killinger Z, Kuzma M, Sterančáková L, Payer J. Osteoarticular changes in acromegaly. Int J Endocrinol. 2012;2012:839282. 14. Van der Klaauw AA, Kars M, Biermasz NR, Roelfsema F, Dekkers
OM, Corssmit EP et al. Disease-speciic impairments in Quality of Life during long-term follow up of patients with different pituitary adenomas. Clin Endocrinol (Oxf). 2008;69(5):775-84.
15. Biermasz NR, van Thiel SW, Pereira AM, Hoftijzer HC, van Hemert AM, Smit JW, et al. Decreased quality of life in patients with acromegaly despite long-term cure of growth hormone excess. J Clin Endocrinol Metab. 2004;89(11):5369-76.
16. Biermasz NR, Pereira AM, Smit JW, Romijn JA, Roelfsema F. Morbidity after long-term remission for acromegaly: persisting joint-related complaints cause reduced quality of life. J Clin Endocrinol Metab. 2005;90:2731-9.
17. Miller A, Doll H, David J, Wass J. Impact of musculoskeletal disease on quality of life in long-standing acromegaly. Eur J Endocrinol. 2008(158):587-93.
18. Ciconelli RM, Ferraz MB, Santos W, Meinão I, Quaresma MR. Tradução para a língua portuguesa e validação do questionário genérico de avaliação de qualidade de vida SF-36 (Brasil SF 36). Rev Bras Reumatol. 1999;39 (3):143-50.
19. Giustina A, Chanson P, Bronstein MD, Klibansly A, Lamberts S, Casanueva F, et al. A consensus on criteria for cure of acromegaly. J Clin Endocrinol Metab. 201095(7):3141-8.
20. Vieira Neto L, Abucham J, Araujo LA, Boguszewski CL, Bronstein MD, Czepielewski M, et al. [Recommendations of
Neuroendocrinology Department from Brazilian Society of Endocrinology and Metabolism for diagnosis and treatment of acromegaly in Brazil]. Arq Bras Endocrinol Metabol. 2011;55(2):91-105.
21. Matsudo SMM, Araújo TL, Matsudo VKR, Andrade DR, Oliveira LC, Braggion GF. Questionário Internacional de Atividade Física (IPAQ): estudo de validade e reprodutibilidade no Brasil. Rev Bras Ativ Fís Saúde. 2001;6(2):5-18.
22. Franceschini J, Santos A, Mouallen I, Jamnik S, Uehara C, Fernandes A, et al. [Assessment of the quality of life of patients with lung cancer using the Medical Outcomes Study 36-item Short-Form Health Survey]. J Bras Pneumol. 2008;34(6):387-93. 23. Corlett N, Wilson, J, Manenika I. The ergonomics of working
postures. London: Taylor & Francis; 1986.
24. Kendall FP, McCreary EK, Provance PG. Postura: alinhamento e equilíbrio muscular. In: Kendall FP, McCreary EK, Provance PG. Músculos provas e funções. 4.ed., São Paulo: Manole, 1995, p. 69-118.
25. Charlton E (ed.). Pain measurement in humans: core curriculum for professional education in pain. IASP Press; 2005. p. 25-53. 26. Colao A, Ferone D, Marzullo P, Lombardi G. Systemic
complications of acromegaly: epidemiology, pathogenesis, and management. Endocrine Reviews. 2004;25(1):102-52.
27. Jensen MP Caroli P, Braver S. The measurement of clinical pain intensity: a comparison of six methods. Pain; 1986. v. 27. p. 117-26. 28. Kerns RD, Turk DC, Rudy TE. The west haven-yale multidimensional
pain inventory (WHYMPI). Pain; 1985. v. 23. p. 345-56.
29. Toscano JJ, Egypto EP. A inluência do sedentarismo na prevalência de lombalgia. Rev Bras Med Esporte. 2001;7(4):56-62. 30. Sociedade Brasileira para o Estudo da Dor (SBED). Hospital
sem dor: diretrizes para implantação da dor como 5º sinal vital. Disponível em: www.dor.org.b.r
31. Gervasio FM, Braga AKP, Fortunato CN, Magalhães DC, Resende KP, Santos RN. Alterações posturais clássicas e suas correlações em mulheres saudáveis na cidade de Goiânia – Goiás. Rev Movimenta. 2009;2(3):74-83.
32. Oliveira P, Monteiro P, Coutinho M, Salvador J, Costa ME, Malcata A. Qualidade de vida e vivência da dor crônica nas doenças reumáticas. Sociedade Portuguesa de Reumatologia. Acta Reumatol Port. 2009;34(3):511-9.
33. Kissner C, Colby LA. Exercícios terapêuticos – Fundamentos e Técnicas. 4. ed. São Paulo: Manole; 2005. p. 591-635.
34. Santos A, Resmini E, Martinez MA, Marti C, Ybarra J, Webb SM. Quality of life in patients with pituitary tumors. Curr Opin Endocrinol Diabetes Obes. 2009;16(4):299-303.
35. Jenkinson C, Layte R, Coulter A, Wright L. Evidence for the sensitivity of the SF-36 health status measure to inequalities in health: results from the Oxford healthy lifestyles survey. J Epidemiol Community Health. 1996;50(3):377-80.