Hyperplasia of Interstitial Cells of Cajal in
Sprouty Homolog 4 Deficient Mice
An Thys1, Pierre Vandenberghe1, Perrine Hague1, Ophir D. Klein2,3, Christophe Erneux4, Jean-Marie Vanderwinden1*
1Laboratory of Neurophysiology, Faculty of Medicine, Université Libre de Bruxelles, Brussels, Belgium, 2Department of Orofacial Sciences and Program in Craniofacial and Mesenchymal Biology, University of California, San Francisco, California, United States of America,3Department of Pediatrics and Institute for Human genetics, University of California, San Francisco, California, United States of America,4IRIBHM, Faculty of Medicine, Université Libre de Bruxelles, Brussels, Belgium
Abstract
Gastrointestinal stromal tumors, which are thought to derive from interstitial cells of Cajal or their precursors, often harbor an oncogenic mutation of the KIT receptor tyrosine kinase. Sprouty homolog 4, a known negative regulator of ERK pathway, has been identified in the interstitial cells of Cajal in theKitK641Emurine model of gastrointestinal stromal tumors. Sprouty homolog 4 was upregulated both at the mRNA and protein level in these cells, sug-gesting that Sprouty homolog 4 is downstream of oncogenic KIT activation and potentially engaged in the negative feedback loop of ERK activation in this model. Here, we used
KitK641Eheterozygous andSprouty homolog 4knock out animals to quantify interstitial cells of Cajalin situ, using quantitative immunofluorescence for the receptor tyrosine kinase Kit and for phosphodiesterase 3a (PDE3A). In the antrum ofSprouty homolog 4knock out mice, hyperplasia of interstitial cells of Cajal was reminiscent of theKitK641Eheterozygous mice antrum. Additionally, the density of interstitial cells of Cajal was higher in the colon of adultSprouty homolog 4knock out mice than in WT littermates, although hyperplasia seemed more severe inKitK641Eheterozygous mice. Functional transit studies also show similarities betweenSprouty homolog 4knock out andKitK641Eheterozygous mice, as the total transit time in 9 month old animals was significantly increased in both genotypes com-pared to WT littermates. We concluded that the lack ofSprouty homolog 4expression leads to hyperplasia of the interstitial cells of Cajal and is functionally associated with a de-layed transit time.
Introduction
Gastrointestinal stromal tumors (GIST) are the most common sarcoma of the gastrointestinal tract. They are thought to derive from the interstitial cells of Cajal (ICC), or an ICC precursor, and are highly resistant to conventional chemotherapy and radiotherapy [1,2]. Approximately
OPEN ACCESS
Citation:Thys A, Vandenberghe P, Hague P, Klein OD, Erneux C, Vanderwinden J-M (2015) Hyperplasia of Interstitial Cells of Cajal in Sprouty Homolog 4 Deficient Mice. PLoS ONE 10(4): e0124861. doi:10.1371/journal.pone.0124861
Academic Editor:Anette Duensing, University of Pittsburgh Cancer Institute, UNITED STATES
Received:August 14, 2014
Accepted:March 11, 2015
Published:April 29, 2015
Copyright:© 2015 Thys et al. This is an open access article distributed under the terms of the Creative Commons Attribution License, which permits unrestricted use, distribution, and reproduction in any medium, provided the original author and source are credited.
Data Availability Statement:All relevant data are within the paper and its Supporting Information files
85% of GIST harbor oncogenic KIT mutations [3]. KIT (a.k.a. c-kit) belongs to the family of re-ceptor tyrosine kinases (RTK) and is a well-established ICC marker [4].
RTK play central roles in multiple biological processes such as proliferation, survival, differ-entiation and migration [5]. Activation of KIT by its ligand, Stem Cell Factor (SCF), is required for the development of ICC, hematopoietic stem cells, melanocytes, mast cells and germ cells. A number of downstream signaling cascades are activated by the SCF/KIT pathway, including RAS/ERK, PI3K/AKT/mTOR, JAK/STAT and PLC pathway [6,7]. Aberrant activation of these KIT signaling pathway has been linked to various human cancers, including GIST, as well as with developmental disorders [3]. Under normal circumstances, RTK signaling pathways are tightly controlled by negative-feedback loops, such as those mediated by Sprouty homolog pro-teins (SPRYs), in order to prevent excessive signaling that could lead to abnormal cellular be-havior and disease [8].
Imatinib mesylate (Gleevec, STI571), a pharmacological inhibitor of KIT, has proven to be effective in patients with GIST. However, resistance often emerges and remains a major con-cern [9–11]. Hence, further studies of the signaling pathways downstream of KIT and its onco-genic mutant forms are important for further development of innovative targeted therapies.
Sprouty genes encode highly conserved negative feedback modulators of growth factor-me-diated extracellular signal-regulated kinase (ERK) activation [12]. They were originally identi-fied in Drosophila (dSprouty) as a feedback inhibitor of fibroblast growth factor (FGF) signaling during tracheal branching [13]. In mammals, there are four Sprouty isoforms (SPRY1-4), which are expressed in an ERK-dependent manner. SPRY modulation of ERK acti-vation can be induced by various stimuli, including EGF, FGF, VEGF, PDGF, and SCF [14]. In-appropriate activation of the Ras/Erk pathway has been reported in various human cancers, including GIST [15–18].
We have previously reported an increase of bothSpry4mRNA and SPRY4 immunoreactivi-ty (-ir) inKitK641Ehomozygous (KitK641E/K641E) mice [19], a mouse model of human GIST har-boring a K-to-E substitution of the KIT receptor at amino acid 642 [20–22]. These mice had a pronounced hyperplasia of ICC in the antrum [22]. Stable expression of KITK641Ein BaF3 cells showed that this receptor is constitutively tyrosine phosphorylated [20] and leads to an upregu-lation of pERK and pAKT [23].Spry1andSpry4were among the genes upregulated identified by microarray analysis in human GIST patients [24]. Furthermore,Spry4was one of the most significant downregulated imatinib-responsive genes [25]. This implies that SPRY4 lies down-stream of KIT activation and is potentially engaged in the negative feedback loop of ERK acti-vation in ICC.
Therefore, we hypothesized that loss of SPRY4 could cause increased phosphorylation of ERK upon KIT RTK activation, leading to hyperplasia of the ICC in antrum, and possibly in other parts of the gut. Hence, we investigated the role of SPRY4 in the ICCin vivousing a
Spry4knockout (KO) mouse model in which the open reading frame ofSpry4has been re-moved. In this model, abnormal dental development has previously been reported [26]. In an-otherSpry4KO model, in which exon 2 was removed, growth retardation and polysyndactyly were described [27]. To the best of our knowledge,Spry4KO mice have not been used so far to study the influence of SPRY4 deficiency in ICC.KitK641Eheterozygous (KitWT/K641Emice) were used to compare the phenotype betweenSpry4KO mice and oncogenic KIT mutant mice. We show thatSpry4deficiency leads to hyperplasia of the ICC in antrum, which is reminiscent to the phenotype of the KitWT/K641Emice. Furthermore,Spry4KO mice also showed an increase of ICC in colon. Functional transit studies showed that the total transit time was significantly increased both inSpry4KO and in KitK641Eheterozygous mice.
Materials and Methods
Ethics statement
Study of KitK641EandSpry4KO mice was approved by the ethics committee for animal well-being of the Faculty of Medicine, Université Libre de Bruxelles (Protocol number 491N).
Animals
Generation ofSpry4KO andKitK641Eanimals have been described by Klein et al. 2006 [26] and Rubin et al. 2005 [22], respectively. In our colony,KitK641E/K641EandKitK641E/K641E-Spry4KO mice died around 12 days after birth. Therefore, only WT, KitWT/K641EandSpry4KO geno-types could be investigated in adult (3 and 9 month old) mice. Genotyping was performed as described [22,26], with primers listed inTable 1. Body weight was determined before mice were sacrificed by cervical dislocation and decapitation. Small intestine, colon and stomach were promptly removed. The gastric antrum was delineated from corpus based on visual land-marks on the serosa. Luminal content was gently emptied and surrounding tissues (e.g. mesen-teric fat) were carefully removed by sharp dissection without damaging the serosa.
Real time quantitative PCR (qPCR)
A minimum of three different RNA samples from P10 WT,KitK641E/K641EandSpry4KO mice antrum were used. Total RNA was extracted using RNeasy MiniKit (Qiagen, Valencia, CA, USA) according to manufacturer’s instructions. Genomic DNA was removed using the RNase-Free DNase set (Qiagen). RNA was reverse transcribed with 200 units of M-MLV Reverse Transcriptase (Invitrogen, Eugene, Oregon, USA) in a reaction containing 1μg of random
primers (Amersham Bioscience, Piscataway, NJ, USA), 10mM each dNTP, 1x First-Strand buffer and 100mM dithiothreitol followed by heat deactivation. The cDNA reverse transcrip-tion product was amplified with specific primers (Table 2) by qPCR using SYBR Green chemis-try on a 7500 Real-time PCR system (Applied Biosystems, Foster City, CA, USA). Identical thermal profile conditions, namely 95°C for 10min, then 40 cycles of 95°C for 15sec and 60°C for 1min were used for all primer sets. Emitted fluorescence was measured during annealing/ extension phase and amplification plots were generated using the Sequence Detection System. Transcriptional quantification relative to GAPDH andβ-actin reference genes was performed using qBase+ software (Biogazelle, Zwijnaarde, Belgium).
Immunofluorescence (IF)
Tissues were fixed for 24h in fresh 4% paraformaldehyde, pH 7.4, and cryopreserved in sucrose solutions (10%, 20%, 30% w/v in water), overnight (o/n) each, embedded in OCT (Sakura Fine-tec Europe, Leiden, the Netherlands) and frozen at -80°C. Circumferential sections (16μm
Table 1. Primers used for genotyping.
Primers for genotyping
SPRY4 (Flox and KO)
Sense CAG GAC TTG GGA GTG CTT CCT TAG
Antisense (Flox) CCT AGT ACC TTT TTG GGG AGA G
Antisense (KO) TAC AGC AGG AAT GGC TAC GGT G
KitK641E
Sense AGT TGG CAG GGT TAG CAG AA
Antisense AGA CTC ACC TCC CAC CGT
thick) were cut on a CM 3050S cryostat (Leica Microsystems GmbH, Wetzlar, Germany), col-lected on Superfrost Plus glass slides (Thermo Scientific, Waltham, MA, USA) and stored at -20°C until use.
IF was carried out as described [28]. Briefly, slides were brought to room temperature (RT), permeabilized and blocked for 1 hour in 10mM TBS pH 8.2 containing 0.1% Triton X-100 (Sigma, Saint Louis, MO, USA) and 10% normal horse serum (NHS). Primary antibodies were diluted in a TBS-Triton X-100 0.1% and 1% NHS solution and incubated overnight at RT in a humid chamber. Slides were washed in TBS and incubated at RT for 1 hour in TBS containing the secondary antibodies. Slides were washed and mounted using Glycergel (Dako, Glostrup, Denmark) + 2.5% DABCO (Sigma). SPRY4 antibody specificity was assessed by preabsorption with the antigenic peptide. In short, SPRY4 antibody was incubated in the presence of 0.1μg/
ml or 1μg/ml SPRY4 immunogenic peptide (Santa Cruz Biotechnology, Inc., Dallas, TX, USA,
sc-18607P) for 30 min at 4°C. Subsequently, IF was carried out as described above. Primary and secondary antibodies used for IF are summarized inTable 3.
Table 2. Primers used for qPCR.
Primers Sequence
GAPDH Fw TGTGTCCGTCGTGGATCTGA
GAPDH Rev CCTGCTTCACCACCTTCTTGA
B-Actin Fw AACCGTGAAAAGATGACCCAGAT
B-Actin Rev GCCTGGATGGCTACGTACATG
SPRY4 Fw TGACTCTGCAGCTCCTCAAAGA
SPRY4 Rev TCACAGGGACGCTGCTCTG
SPRY1 Fw CCAGATGATTGCTAACAAGGTCAG
SPRY1 Rev GTGAATGAAACEACCATGACCTACAT
SPRY2 Fw AAAGCCGCGATCACGGA
SPRY2 Rev GGCTGCGACCCGTTGC
SPRED1 Fw GGAGACGGCGACTTCTGACA
SPRED1 Rev GACAGTGACGCTGCTCAGTCC
doi:10.1371/journal.pone.0124861.t002
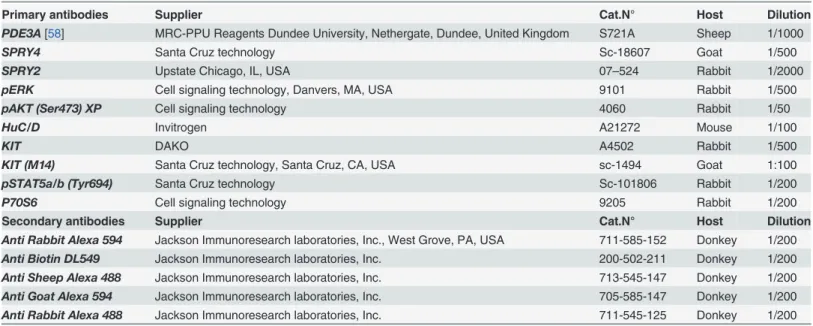
Table 3. Primary and secondary antibodies used for immunofluorescence.
Primary antibodies Supplier Cat.N° Host Dilution
PDE3A[58] MRC-PPU Reagents Dundee University, Nethergate, Dundee, United Kingdom S721A Sheep 1/1000
SPRY4 Santa Cruz technology Sc-18607 Goat 1/500
SPRY2 Upstate Chicago, IL, USA 07–524 Rabbit 1/2000
pERK Cell signaling technology, Danvers, MA, USA 9101 Rabbit 1/500
pAKT (Ser473) XP Cell signaling technology 4060 Rabbit 1/50
HuC/D Invitrogen A21272 Mouse 1/100
KIT DAKO A4502 Rabbit 1/500
KIT (M14) Santa Cruz technology, Santa Cruz, CA, USA sc-1494 Goat 1:100
pSTAT5a/b (Tyr694) Santa Cruz technology Sc-101806 Rabbit 1/200
P70S6 Cell signaling technology 9205 Rabbit 1/200
Secondary antibodies Supplier Cat.N° Host Dilution
Anti Rabbit Alexa 594 Jackson Immunoresearch laboratories, Inc., West Grove, PA, USA 711-585-152 Donkey 1/200
Anti Biotin DL549 Jackson Immunoresearch laboratories, Inc. 200-502-211 Donkey 1/200
Anti Sheep Alexa 488 Jackson Immunoresearch laboratories, Inc. 713-545-147 Donkey 1/200
Anti Goat Alexa 594 Jackson Immunoresearch laboratories, Inc. 705-585-147 Donkey 1/200
Slides were observed and imaged on an AxioImager Z1 fluorescent microscope (Zeiss, Jena, Germany), using a Plan Apochromat 20x/0.8 or EC Plan NeoFluar 40x/0.75 objective. Excita-tion was provided by a HBO 105W lamp. Band pass filters sets #49, #38; and #43 (Zeiss) were used to detect blue, green and red fluorochromes respectively. Images (1388 by 1040 pixels, pixel size (x-y): 0.32 micron by 0.32 micron) were acquired sequentially with an Axio-CamMRm camera (Zeiss) as 3 x 12 bit RBG proprietary.zvi files. Files were processed with
AxioVision (4.6) software (Zeiss). Images were displayed in linear mode with manual contrast adjustment and exported as uncompressed. TIF files. Figures were prepared with Adobe Illustrator.
Quantification of PDE3A-ir, KIT-ir and HuC/D-ir was performed using the Fiji software [29]. The plugin“Stich grid of images”[30] was used to assemble images covering the entire circumference of the sample. The boundaries of the muscularis propria were delineated to ex-tract the region of interest (ROI). The area of immunoreactivity for the ICC or neural body markers, KIT-ir and PDE3A-ir or HuC/D-ir, respectively, was determined by thresholding within the ROI of the muscularis propria.
Confocal microscopy
High resolution confocal imaging was performed using a Zeiss LSM780 system fitted on an Observer Z1 inverted microscope equipped with a LD LCI C-Apochromat 40x/1.1 W objective (Zeiss). The 488 nm excitation wavelength of the Argon/2 laser, a main dichroic HFT 488 and a band-pass emission filter (BP500-550 nm) were used for selective detection of the green fluo-rochrome. The 543nm excitation wavelength of the HeNe1 laser, a main dichroic HFT 488/ 543/633 and a long-pass emission filter (BP565-605 nm) were used for selective detection of the red fluorochrome. A 405 nm blue diode, a main dichroic HFT 405 and a band-pass emis-sion filter (BP435-485 nm) were used for selective detection of the DNA counterstain.
Z-stacks of images were acquired sequentially with a zoom factor of 2 and optimal (1 Airy unit) pinhole (scaling (x-y-z): 0.21 x 0.21 x 0.53 micron) and stored as 8-bit proprietary.czi
files. Single plane images were displayed using Zen2010 software (Zeiss) and exported as 8 bits uncompressed.TIF images. Figures were prepared as above.
Total gastrointestinal transit time
Total gastrointestinal transit time was carried out as described [31]. Briefly, 200μl of 6% (w/v)
carmine red (Sigma) suspended in 0.5% methylcellulose (Sigma) was administered by gavage through a 20 gauge round-tip feeding needle (n = 4–11 in each genotype). The time at which gavage took place was recorded as T0. After gavage, fecal pellets were monitored for the pres-ence of carmine red at 10 min intervals. The interval between T0and the time of first obser-vance of carmine red in stool was considered as total gastrointestinal transit time.
Statistics
Results
SPRY4 immunostaining in antrum of Kit
K641E/K641Eand Kit
WT/K641Emice
This study was based on our previous observation of elevatedSpry4expression inKitK641E/K641E
antrum as compared to WT mice [19]. Here, we confirmed, in 10-day-old animals (P10), strong
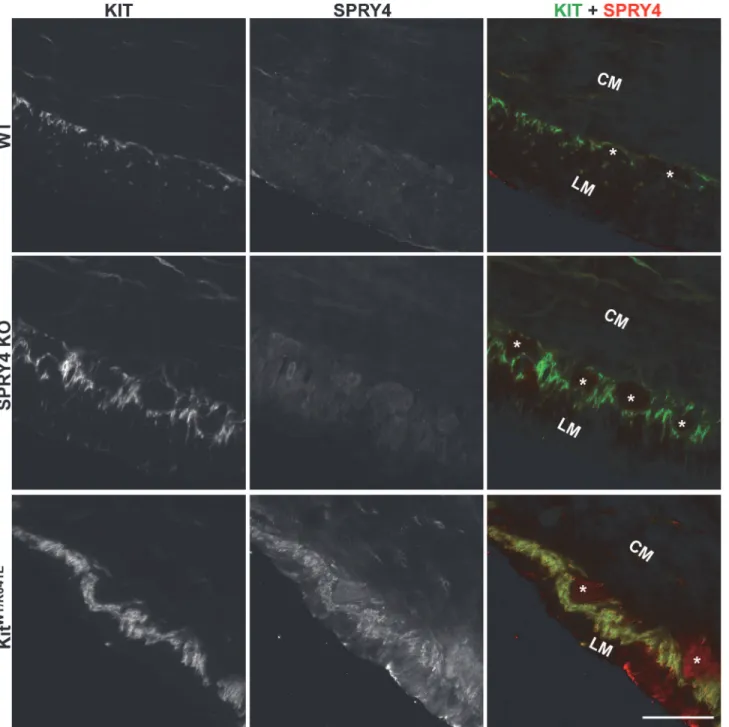
Spry4expression inKitK641E/K641Eantrum compared to WT littermates, while noSpry4 expres-sion could be detected inSpry4KO orKitK641E/K641E-Spry4KO antrum (S1A Fig). In 3-month-old animals, SPRY4-ir was detected in the ICC ofKitWT/K641Eanimals, but not in WT nor in
Spry4KO animals (Fig 1). These data are in line with our previous observations [19]. SPRY4 immunoreactivity (-ir) was also detected in the ICC of P10KitK641E/K641Emice, in contrast to WT andSpry4KO mice (S1B Fig).
To validate the SPRY4 antibody used in this study (Table 3), preabsorption with an immu-nogenic peptide was performed on P10KitK641E/K641Eantrum to assess the disappearance of SPRY4-ir signal after preabsorption (S2 Fig). Furthermore, SPRY4-ir was undetectable in
KitK641E/K641E-Spry4 KOmice (S1B Fig), establishing it’s specific and suitability for IF.
Confirmation of dwarfism and polysyndactyly in our Spry4 KO model
Spry4 KO mice had a significantly lower weight compared to WT littermates at both P10 and 3 month old (S3A and S3B Fig). Furthermore, someSpry4KO animals presented with polysyn-dactily (S3C Fig).
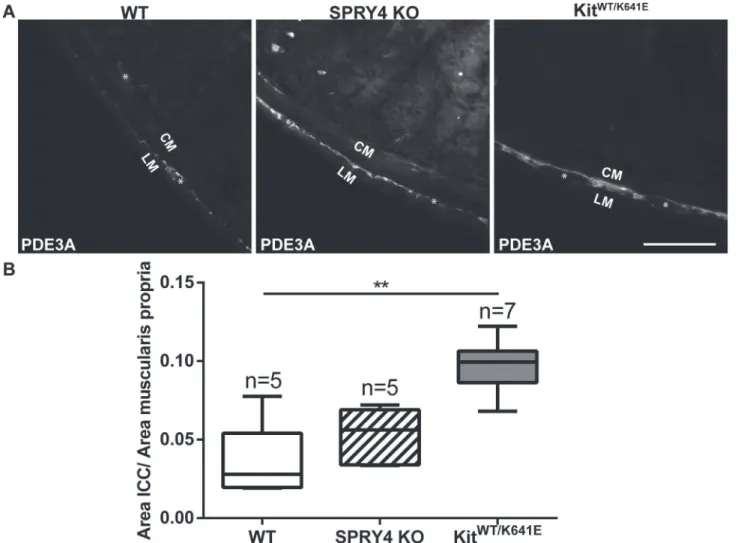
Significant increase of ICC area in antrum of 3-month-old Spry4 KO mice
Phosphodiesterase 3A (PDE3A) has previously been identified as an ICC marker [19,32]. Dou-ble immunofluorescence staining using KIT (rabbit) and PDE3A (sheep) antibodies (Table 3) confirmed the concordance of these markers in 3-month-old antrum (S4 Fig). PDE3A-ir filled in the cytoplasm while KIT-ir was to a large extend present at the cell membrane but the two clearly labelled the very same cells (S4 Fig). Since many antibodies used in this study (Table 3) have been raised in rabbit, the sheep PDE3A antibody was preferred as ICC marker for subse-quent double immunofluorescence studies.
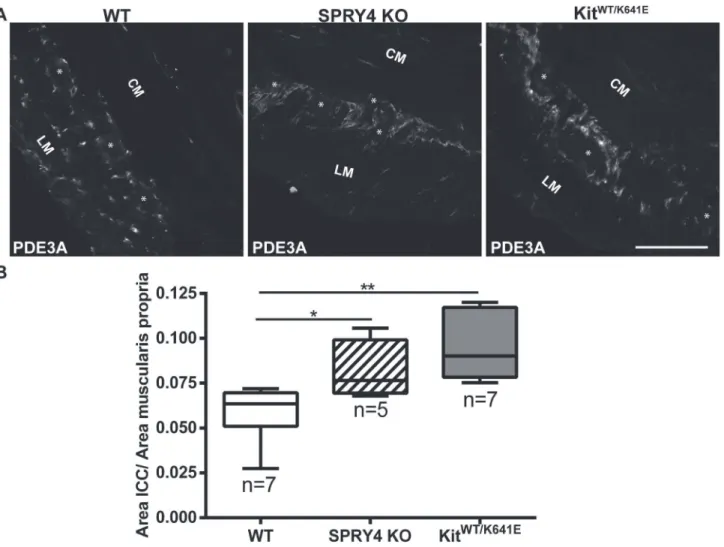
Quantification of the PDE3A-ir ICC density in the musculature was performed on the entire circumference of the antrum, by normalizing the area of PDE3A-ir positive signal to the total muscularis propria area. Compared to WT littermates, 3-month-oldSpry4KO animals showed a significant increase in PDE3A-ir ICC area, similar toKitWT/K641Emice (Fig 2) while in P10
Spry4KO animals, no difference was observed in the PDE3A-ir ICC area compared to their WT littermates (S5 Fig). In contrast, P10 homozygousKitK641E/K641Ealready exhibited a mas-sive PDE3A-ir ICC hyperplasia (S5 Fig), replacing the entire longitudinal muscle layer in the antrum. As these homozygous mice died before weaning, heterozygousKitWT/K641Emice, which display a milder phenotype of ICC hyperplasia, were used for subsequent comparative studies in adult animals.
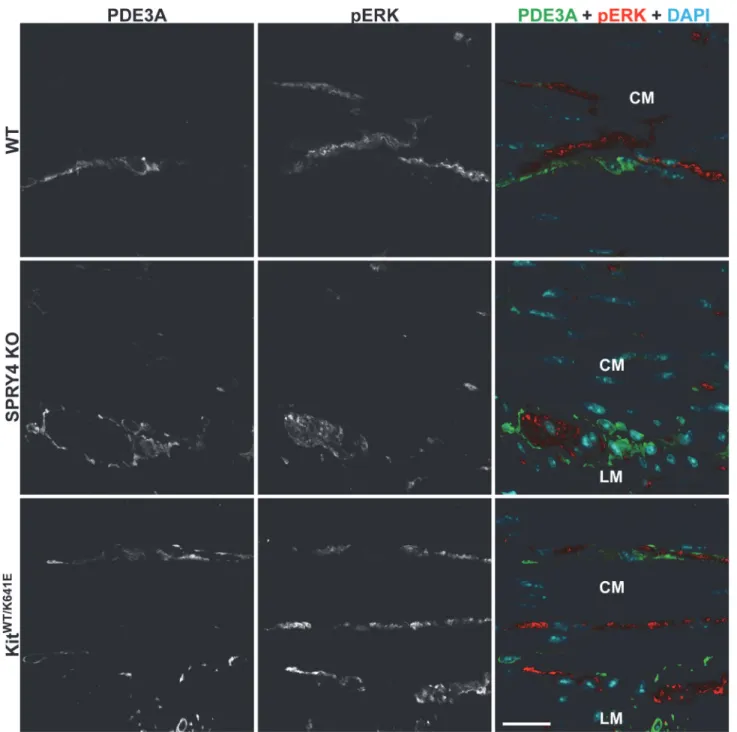
No change detected in pERK in antrum ICC of Spry4 KO mice at P10
and 3 months
With Sprouty proteins being known as negative regulators of the ERK pathway [14], we hypothesized that phosphorylation of ERK might be elevated in the hyperplastic ICC of the
Spry4KO animals compared to WT mice. We observed pERK-ir in PDE3A-ir ICC of P10
plexus and in intramuscular nerve fibers adjacent to PDE3A-ir ICC in the same field of view (Fig 3) and was thus regarded as an internal positive control.
Fig 1. SPRY4-ir in the ICC of 3-month-oldKitWT/K641Eantrum.
Widefield microscopy, sequential channels acquisitions. Left column: KIT immunoreactivity (-ir) ICC in WT, Spry4 KO and KitWT/K641E. Middle column: SPRY4-ir in the 3 genotypes. Right column: merged images: KIT-ir and SPRY4-ir displayed in green and in red, respectively. SPRY4-ir was detected in the KIT-ir ICC solely in KitWT/K641E mice. Abbreviations: LM: longitudinal muscle layer, CM: circular muscle layer,*: location of myenteric plexus, scale bar: 100μm.
No compensation by other SPRYS for the loss of SPRY4 in antrum
We next wondered if compensation mechanisms for the loss of SPRY4 would be present. Therefore, we tested by qPCR the expression levels of SPRY1, SPRY2 and SPRED1 but none of these genes showed any upregulation inSpry4KO antrum (Fig 4A). Additionally, SPRY2-ir was detected only in the smooth muscle cells of antrum and not adjacent PDE3A-ir ICC (Fig 4B,S7 Fig).
No change in other signaling pathways in ICC of 3-month-old antrum
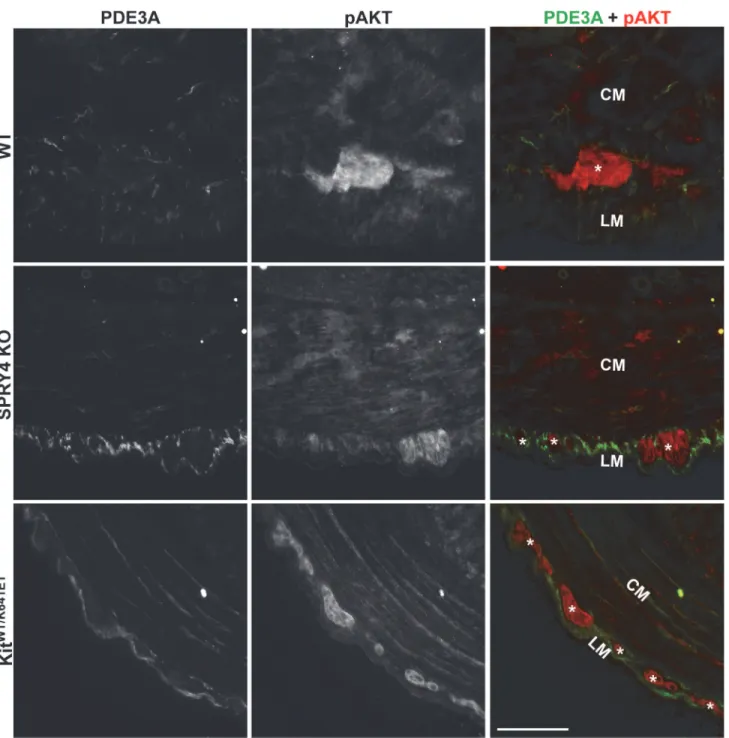
A role of SPRY4 in PI3K/AKT/mTOR signaling has been established in other models [33,34]. pAKT-ir has previously been reported in the hyperplastic ICC layer in P10KitK641E/K641E an-trum [35] and (S8 Fig). In 3 month old animals of all genotypes, pAKT-ir was detected only in the myenteric plexus but not in PDE3A-ir ICC (Fig 5).
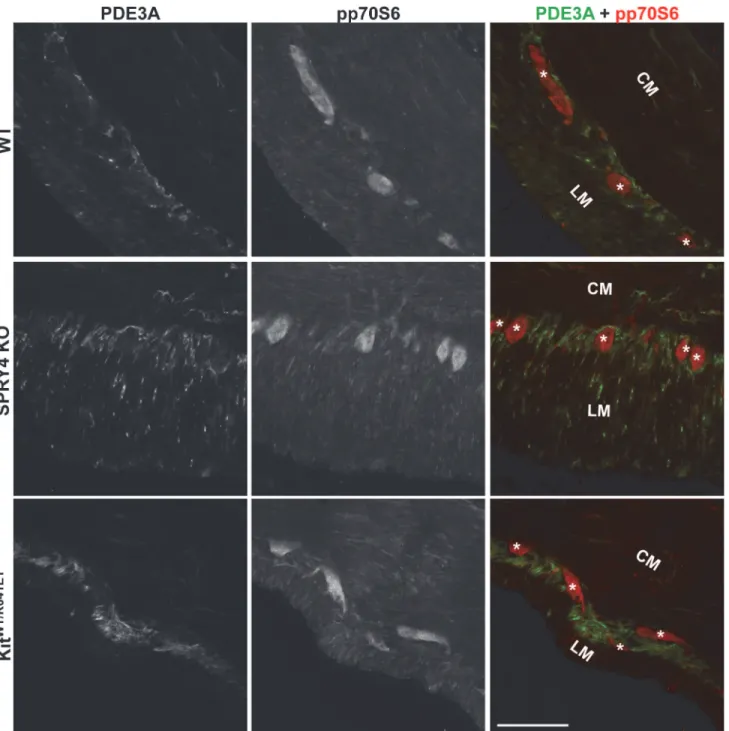
To further investigate a possible involvement of mTOR pathway, we performed IF for the active form of p70S6, a protein downstream of mTOR, phospho-p70S6 (pp70S6). pp70S6-ir. Was detected in the hyperplastic PDE3A-ir ICC layer of P10KitK641E/K641Eanimals (S9 Fig)
Fig 2. ICC hyperplasia in the antrum of 3-month-oldSpry4KO andKitWT/K641E.A) Widefield microscopy acquisitions. PDE3A immunoreactivity (-ir) highlights ICC in the antrum of 3-month-old WT,Spry4KO andKitWT/K641Emice. B) Ratio of PDE3A-ir ICC area in the antrum muscularis propria. Abbreviations: LM: longitudinal muscle layer, CM: circular muscle layer,*: location of myenteric plexus, scale bar: 100μm. P-values (Kruskal-Wallis with
Dunn’s post hoc)*: p<0.05,**: p<0.01
but, in all other genotypes, at both P10 and 3 month old, pp70S6-ir was detected only in the myenteric plexus of the antrum but not in PDE3A-ir ICC (Fig 6).
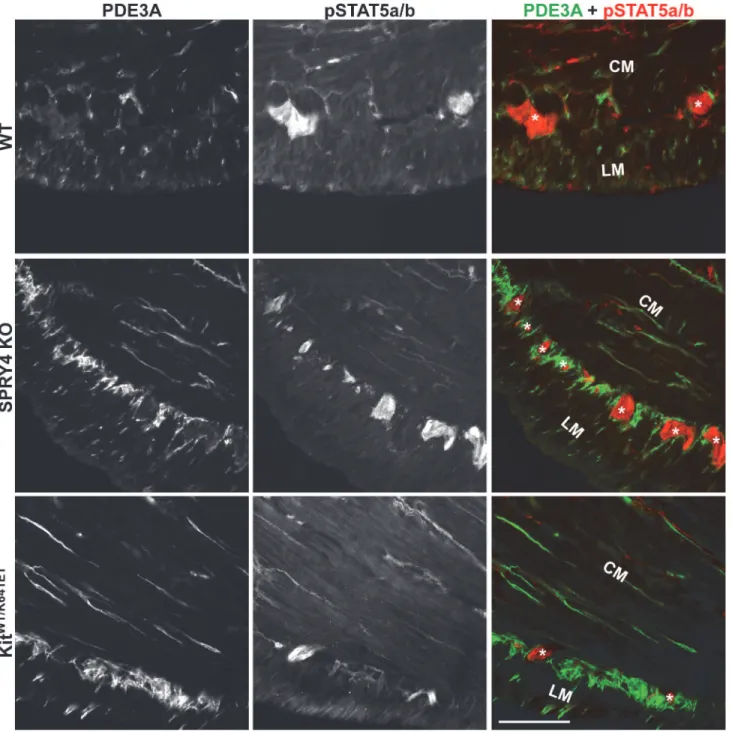
Although SPRY4 has not been directly implicated in the JAK/STAT pathway, this pathway is also involved upon KIT receptor activation [35–38]. Immunoreactivity for the active (phos-phorylated) form of STAT5 (pSTAT5-ir) was detected in the hyperplastic PDE3A-ir ICC layer
Fig 3. pERK-ir in nerve fibers but undetectable in ICC of 3-month-old WT,Spry4KO andKitWT/K641Eantrum.
Confocal microscopy, sequential channels acquisitions.Left column: grey scale images of PDE3A immunoreactivity (-ir) ICC.Middle column: grey scale images of pERK-ir.Right column: merged images. PDE3A-ir and pERK-ir are displayed in green and in red, respectively, with nuclear counterstain (DAPI) in blue. pERK-ir (red) was consistently detected in myenteric plexus and in nerve fibers in the muscularis propria but not in PDE3A-ir ICC (green). Abbreviations: LM: longitudinal muscle layer, CM: circular muscle layer, scale bar: 20μm
Fig 4. No compensation mechanism detected inSpry4KO animals.A) qPCR of WT andSpry4KO P10 antrum forSpred1,Spry1andSpry2. B) Widefield microscopy, sequential channels acquisitions. Immunofluorescence of 3-month-old antrum.Left column: PDE3A-ir ICC in WT,Spry4KO and
KitWT/K641E.Middle column: SPRY2-ir in in the 3 genotypes.Right column: merged images: PDE3A-ir and SPRY2-ir displayed in green and in red, respectively. SPRY2-ir was consistently detected in smooth muscle cells of the muscularis propria but not in PDE3A-ir ICC. Abbreviations: LM: longitudinal muscle layer, CM: circular muscle layer,*: location of myenteric plexus, scale bar: 100μm.
doi:10.1371/journal.pone.0124861.g004
Fig 5. No detectable pAKT-ir in ICC of WT,Spry4KO andKitWT/K641Eantrum.Widefield microscopy, sequential channels acquisitions.Left column: PDE3A immunoreactivity (-ir) ICC in WT,Spry4KO andKitWT/K641E.Middle column: pAKT-ir in the 3 genotypes.Right column: merged images: PDE3A-ir and pAKT displayed in green and in red, respectively. pAKT (red) was consistently detected in myenteric plexus and nerve fibers in the muscularis propria but not in PDE3A-ir ICC (green). Abbreviations: LM: longitudinal muscle layer, CM: circular muscle layer,*: myenteric plexus, scale bar: 100μm.
of P10 KitK641E/K641Eantrum (S10 Fig). Conversely, pSTAT5a/b-ir was not detected in the PDE3A-ir ICC of P10 and 3 month old antrum of WT,Spry4KO orKitWT/K641E
(Figs7,S10).
Fig 6. No detectable pp70S6 in ICC of antrum of WT,Spry4KO orKitWT/K641E.Widefield microscopy, sequential channels acquisitions.Left column: PDE3A immunoreactivity (-ir) ICC in WT,Spry4KO andKitWT/K641E
antrum.Middle column: pp70S6-ir for each genotype.Right column: merged images: PDE3A and pp70S6-ir displayed in green and red, respectively. pp70S6 was consistently detected in myenteric plexus and nerve fibers in the muscularis propria but not in PDE3A-ir ICC. Abbreviations: LM: longitudinal muscle layer, CM: circular muscle layer,*: location of myenteric plexus, scale bar: 100μm
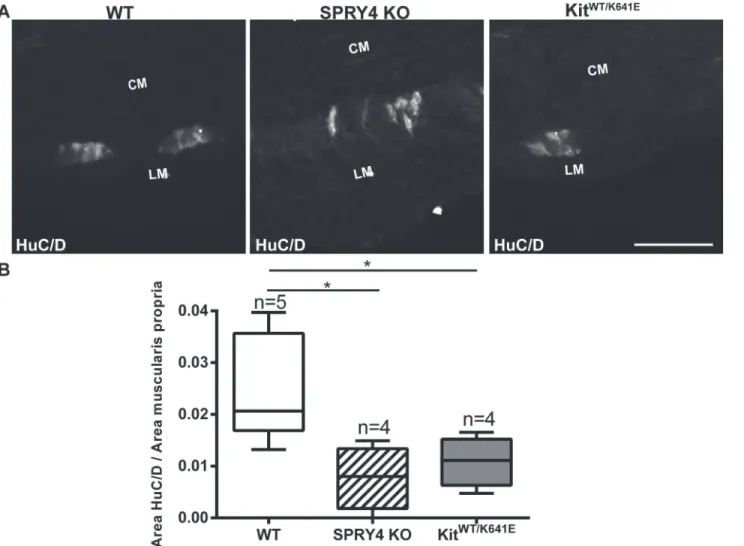
Hypoganglionosis in antrum of both Spry4 KO and Kit
WT/K641Emice
Hyperganglionosis has been reported in the colon ofSpry2KO mice [39]. We thus wondered whether the enteric nervous system (ENS) could similarly be affected inSpry4KO mice. HuC/ D-ir was used for the detection of myenteric neural bodies [40] in the antrum of 3-month-old mice (Fig 8A). HuC/D-ir positive area was normalized for the muscularis propria area. Both
Fig 7. No detectable pSTAT5a/b in ICC of antrum of WT,Spry4KO orKitWT/K641E.Widefield microscopy, sequential channels acquisitions.Left column: PDE3A immunoreactivity (-ir) ICC in WT,Spry4KO andKitWT/K641Eantrum.Middle column: pSTAT5a/b-ir for each genotype.Right column: merged images: PDE3A-ir and pSTAT5a/b-ir displayed in green and red, respectively. pSTAT5a/b was consistently detected in myenteric plexus and nerve fibers in the muscularis propria but not in PDE3A-ir ICC. Abbreviations: LM: longitudinal muscle layer, CM: circular muscle layer,*: location of myenteric plexus, scale bar: 100μm
Spry4KO andKitWT/K641Emice showed a decrease of neural bodies in antrum, compared to WT (Fig 8B).
No change in ICC or signaling pathways in small intestine of 3-month-old
Spry4 KO mice
Hyperplasia of ICC inKitK641Eanimals is not restricted to the antrum [22]. Hence, we also per-formed PDE3A immunostaining in order to quantify ICC in the small intestine (Fig 9, as de-scribed above). A trend towards an increase of PDE3A-ir ICC area in small intestine ofSpry4
KO mice did not reach statistical significance (n = 5–7 animals per group) while, the PDE3A-ir ICC area was significantly increased inKitWT/K641Esmall intestine (Fig 9).
In the small intestine, in all genotypes, pERK-ir was detected only in the myenteric plexus (S11 Fig), and SPRY2 solely in the smooth muscle layers (S12 Fig). Quantification of neuronal bodies using HuC/D IF in 3-month-old small intestine did not show significant difference for any genotype (S13 Fig).
Fig 8. Decrease in myenteric neurons area in antrum ofSpry4KO andKitWT/K641Emice.
A) Widefield microscopy acquisitions. HuC/D-ir highlights soma of myenteric neurons in antrum of 3-month-old WT,Spry4KO andKitWT/K641Emice. B) Ratio of HuC/D-ir area in antrum muscularis propria. Abbreviations: LM: longitudinal muscle layer, CM: circular muscle layer, scale bar: 100μm. P-values (Kruskal-Wallis with Dunn’s post hoc),*: p<0.05
Significant increase of ICC area in colon of 3-month-old Spry4 KO mice
Double immunofluorescence staining using KIT (rabbit) and PDE3A (sheep) antibodies (Table 3) indicated an increased ICC area in bothSpry4KO andKitWT/K641Ecolon (Fig 10A). Quantitative assessment of ICC area was performed by single IF staining using KIT-ir (two dif-ferent, rabbit and goat, KIT antibodies—Table 3) and PDE3A-ir on adjacent sections of colon for WT,Spry4KO andKitWT/K641Egenotypes (n = 5–7 animals per group). Within each geno-type, the 3 antibodies gave concordant results, with non-significant differences between anti-bodies. The 3 antibodies identified similarly a significant increase in ICC area inSpry4KO colon (p value<0.05 for each antibody) and inKitWT/K641Ecolon (KIT rabbit p value<0.001, KIT goat and PDE3A p value<0.01) compared to WT. Although ICC hyperplasia appeared more pronounced inKitWT/K641Ethan inSpry4KO, differences betweenKitWT/K641EandSpry4
KO were not significant (p value PDE3A = 0.2509, p value KIT rabbit = 0.2668, p value KIT goat = 0.3572).
Fig 9. ICC hyperplasia in small intestine ofKitWT/K641E.A) Widefield microscopy acquisitions. PDE3A immunoreactivity (-ir) highlights ICC in the small intestine of 3-month-old WT,Spry4KO andKitWT/K641E
mice. B) Ratio of PDE3A-ir ICC area in muscularis propria of small intestine. Abbreviations: LM: longitudinal muscle layer, CM: circular muscle layer,*: location of myenteric plexus, scale bar: 100μm. P-values (Kruskal-Wallis with Dunn’s post hoc)**: p<0.01
Similarly to antrum and small intestine, pERK-ir was only detected in the myenteric plexus (S14 Fig), and SPRY2-ir solely in the smooth muscle layers (S15 Fig). HuC/D-ir quantification in the colon did not show any difference between genotypes (S16 Fig).
Significant increase in total transit time in Spry4 KO and Kit
WT/K641Emice
ICC regulate the peristaltic movement of the gastrointestinal tract [41]. We wondered if ICC hyperplasia inSpry4KO andKitWT/K641Emice, could impact the gut propulsive function. We thus tested the transit time using the carmine red method in 3 and 9 month old animals. At 3 month of age, total transit time was similar between genotypes (Fig 11A). Conversely, at 9 months, total transit time was significantly increased in bothSpry4KO andKitWT/K641E, com-pared to their WT littermates (Fig 11B). Changes in total transit time were not related to the length of the small intestine since it did not differ between genotypes (S17 Fig).
Discussion
Here, we report a hyperplasia of ICC in both antrum and colon of SPRY4 KO mice. ICC were labeled using KIT-ir, the reference ICC marker [42] & (Fig 1andFig 10,S1 FigandS4 Fig), but also using PDE3A-ir.Pde3abelongs to the gene expression profile of KIT-ir ICC cell-sorted in the mouse small intestine [32].Pde3aalso appeared among the genes upregulated inKitK641E/
K641Eantrum, presenting massive hyperplasia of KIT-ir ICC, compared to WT littermate and
PDE3A-ir localized in KIT-ir ICC in the antrum of WT and KitK641E(homozygous and hetero-zygous) mice. PDE3A-ir was therefore regarded as a novel marker for the KIT-ir ICC in the mouse gut [19]. Although PDE3A-ir has not gained yet a wider acceptance as ICC marker, to the best of our knowledge, our original claim [19] remains so far unchallenged in the literature.
Fig 10. ICC hyperplasia in colon of 3-month-oldSpry4KO andKitWT/K641E.A) Widefield microscopy acquisitions. PDE3A immunoreactivity (-ir) and KIT-ir (rabbit) highlight ICC in the colon of 3-month-old WT,Spry4KO andKitWT/K641Emice. B) Quantification of PDE3A-ir, KIT-ir (rabbit) and KIT-ir (goat) ICC area in the muscularis propria of 3-month-old WT,Spry4 KOandKitWT/K641Ecolon (n = 5
–7 animals per group). Single IF staining performed on adjacent sections. The 3 antibodies identified similarly a significant increase in ICC area inSpry4KO (p value<0.05 for each staining) and inKitWT/K641E
colon (PDE3A a KIT goat p<0.01, KIT rabbit p value<0.001) compared to WT colon. No significant difference was observed betweenSpry4 KOandKitWT/K641E (p value PDE3A = 0.2509, p value KIT rabbit = 0.2668, p value KIT goat = 0.3572). Within each genotype, differences between the 3 antibodies were not significant. Abbreviations: LM: longitudinal muscle layer, CM: circular muscle layer,*: location of myenteric plexus, scale bar: 50μm. P-values (Kruskal-Wallis
with Dunn’s post hoc)*: p<0.05,**: p<0.01
doi:10.1371/journal.pone.0124861.g010
Fig 11. Total digestive transit time is delayed in 9 month oldSpry4KO andKitWT/K641Emice compared to WT animals.Total transit time was
determined using the Carmine red method. The delayed in transit time was not significant in 3-month-oldSpry4andKitWT/K641Eanimals (A) but delay became
significant by 9 months of age (B). P-values (Kruskal-Wallis test with Dunn’s post-hoc)*: p<0.05,**: p<0.01.
In the present study, we used high resolution confocal imaging to show, at the level of individu-ally identified cells, that PDE3A-ir decorates electively the KIT-ir ICC, inSpry4KO antrum, as well as in WT andKitWT/K641Eantrum (S4 Fig). We also quantitated the ICC area using KIT-ir (2 different antibodies) and PDE3A-ir inSPRY4KO colon, as well as in WT andKitWT/K641E
(Fig 10). Within each genotype, KIT-ir and PDE3A-ir values proved to be concordant and, both PDE3A-ir and KIT-ir similarly detected the well-established ICC hyperplasia in
KitWT/K641Ecolon and revealed a significant ICC hyperplasia inSpry4KO colon compared to WT. Although rare events, i.e. the possible occurrence of tiny populations of KIT negative PDE3A-ir cells or KIT-ir PDE3A negative cells, cannot be totally ruled out by these experi-ments, the presence of PDE3A-ir selectively in the KIT-ir ICC in the 3 genotypes studied and the ability of PDE3A-ir to detect, to the same extend as KIT-ir, the predicted ICC hyperplasia in the reference model for KIT-ir ICC hyperplasia,KitK641Emice, and in Spry4 KO colon com-fort our view [19] that PDE3A-ir represents globally a valuable marker for the Kit-ir ICC in the WT mouse gut and in ICC hyperplasia models.
Sprouty proteins are known negative regulators of the ERK pathway [14], a pathway in-volved in cell division, survival and transformation [43], we anticipated that ERK would play a critical role in the development of ICC hyperplasia. ICC represent less than 1% of the total cell population of the highly heterogeneous gut wall. Modifications in gene or protein expression occurring in ICC might thus vanish in the ambient‘noise’when using techniques which re-quire tissue homogenization, e.g. qPCR or Western blot. Therefore, immunoreactivity was used to study signaling pathways in situ with resolution of the different cell types. Surprisingly, pERK was undetectable in the ICC ofSpry4KO mice. In order to exclude compensatory upre-gulation of other Sprouty family members, we performed qPCR of the antrum forSpry1,Spry2, andSpred1. None of these genes were upregulated inSpry4KO antrum. No commercially available antibodies for SPRY1 and SPRED1 were fond suitable for IF on our material while SPRY2-ir showed no change between the different genotypes. Nevertheless, despite these limi-tations, our data suggest that no compensation by other SPRYs appears to occur. Recently, sev-eral papers indicated that SPRY4 can play a role in other signaling pathways [33,34,44,45]. Hence, pAKT and pp70S6 IF were performed in order to investigate the PI3K/AKT/mTOR and pSTAT5a/b for the JAK/STAT pathways, but no detectable differences in immunoreactivi-ty could be seen between the different genoimmunoreactivi-types.
Interestingly, the phenotype ofSpry4KO mice is reminiscent of the phenotype of heterozy-gousKitWT/K641Emice (Table 4). Both show hyperplasia of the ICC in antrum with no detect-able changes in signaling pathways tested in this study. This contrasts with the homozygous
KitK641E/K641Ephenotype, which shows complete replacement of the longitudinal layer of the antrum by a hyperplastic ICC layer in which pERK-ir, pAKT-ir, pp70S6-ir and pSTAT5a/b-ir is detectable. Rubin et al demonstrated elevated tyrosine phosphorylation of the KIT receptor inKitK641E/K641Emice [22]. Hence, strong KIT phosphorylation in homozygousKitK641E/K641E
mice may lead to a strong activation of the signaling pathways, while heterozygousKitWT/K641E Table 4. Summary of results in 3-month-old SPRY4 KO and Kitwr/K641Eanimals compared to controls.
Genotype Spry4KO KitWT/K641E
ICC antrum Increased Increased
ICC colon Increased Highly increased
ICC small intestine Comparable Increased
HuC/D antrum Decreased Decreased
Total transit time Increased Increased
mice would have lower levels of KIT phosphorylation and therefore lesser activation of the downstream signaling pathways thanKitK641E/K641Eanimals. In GIST882 cells, a human GIST cell line carrying the same K-to-E substitution as theKitK641Emice [10], the link between ERK phosphorylation and upregulation of SPRY4 has been established [25,46]. One can only specu-late that a small increase in ERK phosphorylation in the ICC of heterozygousKitWT/K641Emice might well fall below the detection threshold of immunohistochemistry which readily picks up the strong ERK phosphorylation in ICC inKitK641E/K641Emice and in the ENS in all genotypes. Despite the fact that SPRY4-ir was not detectable in ICC in the postnatal WT gut [19],Fig 1 &S1 Fig, this study revealed ICC hyperplasia inSpry4KO mice, raising the possibility that
Spry4might play a role during ICC embryonic development. Noteworthy,Spry4expression, detected by in situ hybridization, has been reported in mouse embryo, in stomach at embryonic day 11.5 (E11.5) and in intestine at E12.5 and E14.5 [47], i.e. around the time where ICC differ-entiation starts [48–50].
In a similar perspective, Taketomi et al reported that SPRY2 deficient mice exhibit hyper-ganglionosis in the colon, although the exact mechanism remains unclear [39]. Since, SPRY2 and SPRY4 belong to the same protein family [12,14], the ENS inSpry4KO mice was also in-vestigated. Surprisingly, the antrum ofSpry4KO mice presented a hypoganglionosis, while other parts of the gastrointestinal tract appeared normoganglionic. The same feature was also seen inKitWT/K641Eantrum, adding to the similarities betweenSpry4KO andKitWT/K641E
(Table 4). Migration of the neural crest cells forming the ENS is completed by E15 in mice [51]. Hence, the ENS alterations observed inSpry4null andKitWT/K64Eanimals after birth must originate during embryonic gut development.
The present study focused on the postnatal gut phenotype ofSpry4KO mice and further studies are clearly needed to unravel the time windows at whichSpry4is expressed in the differ-ent cell types and the underlying signaling pathways in the developing gut.
ICC are the pacemaker cells of the gastrointestinal tract, coordinating the contractility of the gastrointestinal muscle layers [41,52]. Bellier et al reported that PRM/Alf mice, which ex-hibit a higher number of ICC and increased intestine length, have a total gastrointestinal transit time similar to their WT littermates, implying a faster transit [53]. In contrast to PRM/Alf mice, the length of intestine inSpry4deficient andKitWT/K641Emice was similar to WT litter-mates and the increase in ICC was associated with a significantly delayed total gastrointestinal transit in aging (9 month old)—but not in younger (3-month-old) animals. This provides an original clue that, besides roles during development,Spry4andKitK641Emay play additional roles during the aging process. Digestive transit is a very complex, multifactorial, process, and further studies (e.g. electrophysiology, microbiome, etc.) will be required to unravel the precise mechanism underlying these observations. Noteworthy, constipation, albeit a fairly common and unspecific complain, is a frequent symptom in human adult GIST patients [54–57].
In summary, we have shown thatSPRY4loss of function was associated with ICC hyperpla-sia in antrum and colon. TheSpry4KO mice bear striking similarities with theKitWT/K641E on-cogenic mice, and in both models, ICC hyperplasia was associated with a delayed total gastrointestinal transit time in aging mice.
Supporting Information
S1 Fig.Spry4mRNA expression and immunoreactivity in P10 antrum.A) qPCR analysis of
Spry4mRNA levels in the postnatal (P10) mouse antrum showing a significant increase in
and SPRY4-ir in P10 antrum. Widefield microscopy, sequential channels acquisitions.Left col-umn: grey scale images of KIT-ir ICC.Middle column: grey scale images of SPRY4-ir.Right col-umn: merged images. KIT-ir and SPRY4-ir are displayed in green and in red, respectively. SPRY4-ir (red) was detected in the KIT-ir ICC (green) only inKitK641E/K641Emice but not in WT,Spry4 KOorKitK641E/K641E-Spry4KO antrum. Abbreviations: LM: longitudinal muscle layer, CM: circular muscle layer,: myenteric plexus, scale bar: 100μm.
(TIF)
S2 Fig. Preabsorption with SPRY4 antigenic peptide abolished SPRY4-ir signal in P10 KitK641E/K641Eantrum.A) Control SPRY4-ir (without peptide). SPRY4 antibody preabsorption with B) 1μg or C) 0.1μg immunogenic peptide wiped out the signal. D) Negative control
(omis-sion of primary antibody). Scale bar: 50μm.
(TIF)
S3 Fig. Dwarfism and polysyndactyly inSpry4KO mice.Female and maleSpry4KO animals showed a significantly lower body weight compared to their WT littermates at A) P10 and B) 3 months of age. C) An example of polysyndactyly inSpry4KO animals.
(TIF)
S4 Fig. PDE3A-ir in KIT-ir ICC of WT,Spry4KO andKitWT/K641Eadult mouse antrum.
Confocal microscopy, sequential channels acquisitions.Upper row: grey scale images of PDE3A immunoreactivity (-ir) ICC.Second row: grey scale images of KIT-ir ICC.Third row: merged images. PDE3A-ir is displayed in green, KIT-ir in red, with nuclear counterstain (DAPI) in blue.Bottom row: Immunofluorescence intensity plots for PDE3A-ir and KIT-ir along the lines drawn across individual cells above, demonstrating that PDE3A-ir and KIT-r were consistently found in the same cells. Abbreviations: LM: longitudinal muscle layer, CM: circular muscle layer, scale bar: 10μm
(TIF)
S5 Fig. ICC hyperplasia in antrum of P10KitK641E/K641Emice.A) Widefield microscopy ac-quisitions. PDE3A immunoreactivity (-ir) highlights ICC in the antrum of 10 days old WT,
Spry4KO andKitWT/K641Emice. B) Ratio of PDE3A-ir ICC area in antrum muscularis propria. Abbreviations: LM: longitudinal muscle layer, CM: circular muscle layer,: location of
myen-teric plexus, scale bar: 50μm. P-values (Kruskal-Wallis with Dunn’s post hoc),: p<0.05 (TIF)
S6 Fig. pERK present in ICC of P10KitK641E/K641Eantrum.Widefield microscopy, sequential channels acquisitions.Left column: PDE3A immunoreactivity (-ir) ICC in WT,Spry4KO and
KitWT/K641E.Middle column: pERK-ir in in the 3 genotypes.Right column: merged images: PDE3A-ir and pERK-ir displayed in green and in red, respectively. pERK-ir (red) was consis-tently detected in myenteric plexus and nerve fibers in the muscularis propria of all genotypes. PDE3A-ir ICC (green) which were also pERK-ir were solely detected inKitK641E/K641Emice—
and not in the other genotypes. Abbreviations: LM: longitudinal muscle layer, CM: circular muscle layer,: location of myenteric plexus, scale bar: 50μm.
(TIF)
S7 Fig. SPRY2-ir highlights the smooth muscle cells but not the ICC in P10 antrum. Wide-field microscopy, sequential channels acquisitions.Left column: PDE3A-ir ICC in WT,Spry4
myenteric plexus, scale bar: 50μm.
(TIF)
S8 Fig. pAKT-ir in ICC of P10KitK641E/K641Eantrum.Widefield microscopy, sequential channels acquisitions.Left column: PDE3A immunoreactivity (-ir) ICC in WT, SPRY4 KO and KitWT/K641E.Middle column: pAKT-ir in in the 3 genotypes.Right column: merged images: PDE3A-ir and pAKT displayed in green and in red, respectively. pAKT (red) was consistently detected in myenteric plexus and nerve fibers in the muscularis propria but solely in PDE3A-ir ICC (green) ofKitK641E/K641Eanimals. Abbreviations: LM: longitudinal muscle layer, CM: cir-cular muscle layer,: location of myenteric plexus, scale bar: 50μm.
(TIF)
S9 Fig. pp70S6-ir in ICC of antrum P10KitK641E/K641E.Widefield microscopy, sequential channels acquisitions.Left column: PDE3A immunoreactivity (-ir) ICC in WT,Spry4KO and
KitK641E/K641Eantrum.Middle column: pp70S6-ir for each genotype.Right column: merged im-ages: PDE3A and pp70S6-ir displayed in green and red, respectively. pp70S6 was consistently detected in myenteric plexus and nerve fibers in the muscularis propria but solely in PDE3A-ir ICC ofKitK641E/K641Eanimals. Abbreviations: LM: longitudinal muscle layer, CM: circular mus-cle layer,: myenteric plexus, scale bar: 50μm
(TIF)
S10 Fig. pSTAT5a/b-ir in ICC of antrum P10KitK641E/K641E.Widefield microscopy, sequen-tial channels acquisitions.Left column: PDE3A immunoreactivity (-ir) ICC in WT,Spry4KO andKitK641E/K641Eantrum.Middle column: pSTAT5a/b-ir for each genotype.Right column: merged images: PDE3A and pSTAT5a/b-ir displayed in green and red, respectively. pSTAT5a/ b was consistently detected in myenteric plexus and nerve fibers in the muscularis propria but solely in PDE3A-ir ICC ofKitK641E/K641Eanimals. Abbreviations: LM: longitudinal muscle layer, CM: circular muscle layer,: myenteric plexus, scale bar: 50μm.
(TIF)
S11 Fig. No detectable pERK-ir in ICC of WT,Spry4KO andKitWT/K641Esmall intestine of 3-month-old animals.Widefield microscopy, sequential channels acquisitions.Left column: PDE3A immunoreactivity (-ir) staining ICC in WT,Spry4KO andKitWT/K641E.Middle col-umn: pERK-ir in the 3 genotypes.Right column: merged images: PDE3A-ir and pERK-ir dis-played in green and in red, respectively. Abbreviations: LM: longitudinal muscle layer, CM: circular muscle layer,: location of myenteric plexus, scale bar: 100μm.
(TIF)
S12 Fig. SPRY2-ir highlights smooth muscle cells but not ICC in the small intestine of WT, Spry4KO orKitWT/K641Eadult mice.Widefield microscopy, sequential channels acquisitions.
Left column: PDE3A-ir ICC in WT,Spry4KO andKitWT/K641E.Middle column: SPRY2-ir in in the 3 genotypes.Right column: merged images: PDE3A-ir and SPRY2-ir displayed in green and in red, respectively. SPRY2-ir (red) was consistently detected in the smooth muscle cells of the muscularis propria but not in PDE3A-ir ICC (green). Abbreviations: LM: longitudinal muscle layer, CM: circular muscle layer,: location of myenteric plexus, scale bar: 100μm.
(TIF)
muscle layer, CM: circular muscle layer, scale bar: 100μm.
(TIF)
S14 Fig. No detectable pERK-ir in ICC of WT,Spry4KO andKitWT/K641Ecolon of 3 month old animals.Widefield microscopy, sequential channels acquisitions.Left column: PDE3A immunoreactivity (-ir) staining ICC in WT,Spry4KO andKitWT/K641E.Middle column: pERK-ir in the 3 genotypes.Right column: merged images: PDE3A-ir and pERK-ir displayed in green and in red, respectively. Abbreviations: LM: longitudinal muscle layer, CM: circular muscle layer,: location of myenteric plexus, scale bar: 100μm.
(TIF)
S15 Fig. SPRY2-ir highlights smooth muscle cells but not ICC in WT,Spry4KO or
KitWT/K641Ecolon at 3 months of age.Widefield microscopy, sequential channels acquisitions.
Left column: PDE3A-ir ICC in WT,Spry4KO andKitWT/K641E.Middle column: SPRY2-ir in in the 3 genotypes.Right column: merged images: PDE3A-ir and SPRY2-ir displayed in green and in red, respectively. SPRY2-ir (red) was consistently detected in the smooth muscle cells of the muscularis propria but not in PDE3A-ir ICC (green). Abbreviations: LM: longitudinal muscle layer, CM: circular muscle layer,: location of myenteric plexus, scale bar: 100μm.
(TIF)
S16 Fig. Myenteric plexus area is unaltered in the colon of 3 month oldSpry4KO and KitWT/K641E.A) Widefield microscopy acquisitions. HuC/D-ir highlights soma of myenteric neurons in colon of 3-month-old WT,Spry4KO andKitWT/K641Emice. B) Ratio of HuC/D-ir area in colon muscularis propria. Abbreviations: LM: longitudinal muscle layer, CM: circular muscle layer, scale bar: 100μm.
(TIF)
S17 Fig. No change is length of the small intestine between genotypes.Length in cm for 3-month-old (A) and 9 month old (B) WT,Spry4KO andKitWT/K641Eanimals.
(TIF)
Acknowledgments
We are grateful to Prof. Viviane de Maertelaer, Department of Biostatistics and Medical Com-puting, Université Libre de Bruxelles, Brussels, Belgium, for stimulating discussions on data analysis and to Prof. Brian Rubin, Anatomic Pathology and Molecular Genetics, Cleveland Clinic, Lerner Research Institute and Taussig Cancer Center, Cleveland, OH, USA, for provid-ing the KitK641Emice.
Author Contributions
Conceived and designed the experiments: AT JMV CE. Performed the experiments: AT PH PV. Analyzed the data: AT JMV CE. Contributed reagents/materials/analysis tools: ODK. Wrote the paper: AT JMV CE ODK.
References
1. Corless CL, Barnett CM, Heinrich MC. Gastrointestinal stromal tumours: origin and molecular oncology. Nat Rev Cancer. Nature Publishing Group; 2011; 11: 865–78. doi:10.1038/nrc3143PMID:22089421
2. Hirota S. Gain-of-Function Mutations of c-kit in Human Gastrointestinal Stromal Tumors. Science (80: -). 1998; 279: 577–580.
4. Hirota S, Isozaki K. Pathology of gastrointestinal stromal tumors. Pathol Int. 2006; 56: 1–9. PMID:
16398673
5. Schlessinger J. Cell signaling by Tyrosine kinases. Cell. 2000; 103: 211–225. PMID:11057895
6. Ali S, Ali S. Role of c-kit/SCF in cause and treatment of gastrointestinal stromal tumors (GIST). Gene. 2007; 401: 38–45. PMID:17659849
7. Lennartsson J, Jelacic T, Linnekin D, Shivakrupa R. Normal and oncogenic forms of the receptor tyro-sine kinase kit. Stem Cells. 2005; 23: 16–43. PMID:15625120
8. Ledda F, Paratcha G. Negative Regulation of Receptor Tyrosine Kinase (RTK) Signaling: A Developing Field. Biomark Insights. 2007; 2: 45–58. PMID:19662191
9. Joensuu H, Roberts PJ, Sarlomo-Rikala M, Andersson LC, Tervahartiala P, Tuveson D, et al. Effect of the tyrosine kinase inhibitor STI571 in a patient with a metastatic gastrointestinal stromal tumor. new Engl J Med. 2001; 344: 1052–1056. PMID:11287975
10. Tuveson DA, Willis NA, Jacks T, Griffin JD, Singer S, Fletcher CD, et al. STI571 inactivation of the gas-trointestinal stromal tumor c-KIT oncoprotein: biological and clinical implications. Oncogene. 2001; 20: 5054–8. PMID:11526490
11. Renouf DJ, Wilson L, Blanke CD. Successes and challenges in translational research: the development of targeted therapy for gastrointestinal stromal tumours. Clin Cancer Res. 2009; 15: 3908–11. doi:10. 1158/1078-0432.CCR-08-1622PMID:19509180
12. Cabrita MA, Christofori G. Sprouty proteins, masterminds of receptor tyrosine kinase signaling. Angio-genesis. 2008; 11: 53–62. doi:10.1007/s10456-008-9089-1PMID:18219583
13. Hacohen N, Kramer S, Sutherland D, Hiromi Y, Krasnow MA. sprouty encodes a novel antagonist of FGF signaling that patterns apical branching of the Drosophila airways. Cell. 1998; 92: 253–63. PMID:
9458049
14. Mason JM, Morrison DJ, Basson MA, Licht JD. Sprouty proteins: multifaceted negative-feedback regu-lators of receptor tyrosine kinase signaling. Trends Cell Biol. 2006; 16: 45–54. PMID:16337795
15. Montagut C, Settleman J. Targeting the RAF-MEK-ERK pathway in cancer therapy. Cancer Lett. Else-vier Ireland Ltd; 2009; 283: 125–34. doi:10.1016/j.canlet.2009.01.022PMID:19217204
16. Oka H, Chatani Y, Hoshino R, Carcinoma RC. Constitutive Activation of Mitogen-activated Protein (MAP) Kinases in Human Renal Cell Carcinoma Constitutive Activation of Mitogen-activated. Cancer Res. 1995; 55: 4182–4187. PMID:7664295
17. Hoshino R, Chatani Y, Yamori T, Tsuruo T, Oka H, Yoshida O, et al. Constitutive activation of the 41-/ 43-kDa mitogen-activated protein kinase signaling pathway in human tumors. Oncogene. 1999; 18: 813–22. PMID:9989833
18. Ríos-Moreno MJ, Jaramillo S, Díaz-Delgado M, Sánchez-León M, Trigo-Sánchez I, Padillo JP, et al. Differential activation of MAPK and PI3K/AKT/mTOR pathways and IGF1R expression in gastrointesti-nal stromal tumors. Anticancer Res. 2011; 31: 3019–25. PMID:21868553
19. Gromova P, Ralea S, Lefort A, Libert F, Rubin BP, Erneux C, et al. Kit K641E oncogene up-regulates Sprouty homolog 4 and trophoblast glycoprotein in interstitial cells of Cajal in a murine model of gastro-intestinal stromal tumours. J Cell Mol Med. 2009; 13: 1536–48. doi:10.1111/j.1582-4934.2009.00768.x
PMID:19453770
20. Isozaki K, Terris B, Belghiti J, Schiffmann S, Hirota S, Vanderwinden JM. Germline-activating mutation in the kinase domain of KIT gene in familial gastrointestinal stromal tumors. Am J Pathol. 2000; 157: 1581–5. PMID:11073817
21. Lux ML, Rubin BM, Biase TL, Chen CJ, Maclure T, Demetrii G, et al. KIT Extracellular and Kinase Do-main Mutations in Gastrointestinal Stromal Tumors. Am J Pathol. 2000; 156: 791–5. PMID:10702394
22. Rubin BP, Antonescu CR, Scott-Browne JP, Comstock ML, Gu Y, Tanas MR, et al. A knock-in mouse model of gastrointestinal stromal tumor harboring kit K641E. Cancer Res. 2005; 65: 6631–9. PMID:
16061643
23. Vanderwinden JM, Wang D, Paternotte N, Mignon S, Isozaki K, Erneux C. Differences in signaling pathways and expression level of the phosphoinositide phosphatase SHIP1 between two oncogenic mutants of the receptor tyrosine kinase KIT. Cell Signal. 2006; 18: 661–9. PMID:15990278
24. Nielsen TO, West RB, Linn SC, Alter O, Knowling MA, O’Connell JX, et al. Molecular characterisation of soft tissue tumours: a gene expression study. Lancet. Elsevier; 2002; 359: 1301–1307. PMID:
11965276
26. Klein O, Minowada G, Peterkova R, Kangas A, Yu BD, Lesot H, et al. Sprouty genes control diastema tooth development via bidirectional antagonism of epithelial-mesenchymal FGF signaling. Dev Cell. 2006; 11: 181–190. PMID:16890158
27. Taniguchi K, Ayada T, Ichiyama K, Kohno R-I, Yonemitsu Y, Minami Y, et al. Sprouty2 and Sprouty4 are essential for embryonic morphogenesis and regulation of FGF signaling. Biochem Biophys Res Commun. 2007; 352: 896–902. PMID:17156747
28. Vanderwinden J-M, Rumessen JJ, De Laet M-H, Vanderhaeghen J-J, Schiffmann SN. CD34 immuno-reactivity and interstitial cells of Cajal in the human and mouse gastrointestinal tract. Cell Tissue Res. 2000; 302: 145–153. PMID:11131126
29. Schindelin J, Arganda-Carreras I, Frise E, Kaynig V, Longair M, Pietzsch T, et al. Fiji: an open-source platform for biological-image analysis. Nat Methods. 2012; 9: 676–82. doi:10.1038/nmeth.2019PMID:
22743772
30. Preibisch S, Saalfeld S, Tomancak P. Globally optimal stitching of tiled 3D microscopic image acquisi-tions. Bioinformatics. 2009; 25: 1463–5. doi:10.1093/bioinformatics/btp184PMID:19346324
31. Li Z, Chalazonitis A, Huang Y-Y, Mann JJ, Margolis KG, Yang QM, et al. Essential roles of enteric ronal serotonin in gastrointestinal motility and the development/survival of enteric dopaminergic neu-rons. J Neurosci. 2011; 31: 8998–9009. doi:10.1523/JNEUROSCI.6684-10.2011PMID:21677183
32. Chen H, Ordög T, Chen J, Young DL, Bardsley MR, Redelman D, et al. Differential gene expression in functional classes of interstitial cells of Cajal in murine small intestine. Physiol Genomics. 2007; 31: 492–509. PMID:17895395
33. Taniguchi K, Ishizaki T, Ayada T, Sugiyama Y, Wakabayashi Y, Sekiya T, et al. Sprouty4 deficiency po-tentiates Ras-independent angiogenic signals and tumor growth. Cancer Sci. 2009; 100: 1648–54. doi:
10.1111/j.1349-7006.2009.01214.xPMID:19493272
34. Yang X, Gong Y, Tang Y, Li H, He Q, Gower L, et al. Spry1 and Spry4 Differentially Regulate Human Aortic Smooth Muscle Cell Phenotype via Akt/FoxO/Myocardin Signaling. PLoS One. 2013; 8: e58746. doi:10.1371/journal.pone.0058746PMID:23554919
35. Deneubourg L, Ralea S, Gromova P, Parsons R, Vanderwinden J-M, Erneux C. Abnormal elevated PTEN expression in the mouse antrum of a model of GIST Kit(K641E/K641E). Cell Signal. Elsevier Inc.; 2011; 23: 1857–68. doi:10.1016/j.cellsig.2011.06.023PMID:21757001
36. Iemura A, Tsai M, Ando A, Wershil BK, Galli SJ. The c-kit ligand, stem cell factor, promotes mast cell survival by suppressing apoptosis. Am J Pathol. 1994; 144: 321–8. PMID:7508684
37. Yang J, Ikezoe T, Nishioka C, Takezaki Y, Hanazaki K, Taguchi T, et al. Long-term exposure of gastro-intestinal stromal tumor cells to sunitinib induces epigenetic silencing of the PTEN gene. Int J Cancer. 2012; 130: 959–66. doi:10.1002/ijc.26095PMID:21445973
38. Linnekin D. Early signaling pathways activated by c-Kit in hematopoietic cells. Int J Biochem Cell Biol. 1999; 31: 1053–74. PMID:10582339
39. Taketomi T, Yoshiga D, Taniguchi K, Kobayashi T, Nonami A, Kato R, et al. Loss of mammalian Spro-uty2 leads to enteric neuronal hyperplasia and esophageal achalasia. Nat Neurosci. 2005; 8: 855–7. PMID:15937482
40. Swaminathan M, Kapur RP. Counting myenteric ganglion cells in histologic sections: An empirical ap-proach. Hum Pathol. 2010; 41: 1097–1108. doi:10.1016/j.humpath.2009.12.012PMID:20346481
41. Thomsen L, Robinson TL, Lee JC, Farraway LA, Hughes MJ, Andrews DW, et al. Interstitial cells of Cajal generate a rhythmic pacemaker current. Nat Med. 1998; 4: 848–851. PMID:9662380
42. Rumessen JJ, Vanderwinden JM. Interstitial cells in the musculature of the gastrointestinal tract: Cajal and beyond. International Review of Cytology. 2003. pp. 115–208.
43. Krishna M, Narang H. The complexity of mitogen-activated protein kinases (MAPKs) made simple. Cell Mol Life Sci. 2008; 65: 3525–44. doi:10.1007/s00018-008-8170-7PMID:18668205
44. Ayada T, Taniguchi K, Okamoto F, Kato R, Komune S, Takaesu G, et al. Sprouty4 negatively regulates protein kinase C activation by inhibiting phosphatidylinositol 4,5-biphosphate hydrolysis. Oncogene. 2009; 28: 1076–88. doi:10.1038/onc.2008.464PMID:19137008
45. Charles C, Hovorakova M, Ahn Y, Lyons DB, Marangoni P, Churava S, et al. Regulation of tooth num-ber by fine-tuning levels of receptor-tyrosine kinase signaling. Development. 2011; 138: 4063–73. doi:
10.1242/dev.069195PMID:21862563
46. Bauer S, Duensing A, Demetri GD, Fletcher JA. KIT oncogenic signaling mechanisms in imatinib-resis-tant gastrointestinal stromal tumor: PI3-kinase/AKT is a crucial survival pathway. Oncogene. 2007; 26: 7560–8. PMID:17546049
48. Klüppel M, Huizinga JD, Malysz J, Bernstein A. Developmental Origin and Kit-Dependent Development of the Interstitial Cells of Cajal in the Mammalian small intestine. Dev Dyn. 1998; 211: 60–71. PMID:
9438424
49. Young HM. Embryological Origin of Interstitial Cells of Cajal. Microsc Res Tech. 1999; 47: 303–308. PMID:10602289
50. Wu JJ, Rothman TP, Gershon MD. Development of the Interstitial Cell of Cajal: Origin, Kit Dependence and Neuronal and Nonneuronal Sources of Kit Ligand. J Neurosci Res. 2000; 59: 384–401. PMID:
10679775
51. Druckenbrod NR, Epstein ML. The pattern of neural crest advance in the cecum and colon. Dev Biol. 2005; 287: 125–33. PMID:16197939
52. Ward SM, Burns AJ, Torihashi S, Harney SC, Sanders KM. Impaired development of interstitial cells and intestinal electrical rhythmicity in steel mutants. Am J Physiol. 1995; 269: C1577–C1585. PMID:
8572188
53. Bellier S, Da Silva NR, AubHouzelstein G, Elbaz C, Vanderwinden J-M, Panthier J-J. Accelerated in-testinal transit in inbred mice with an increased number of interstitial cells of Cajal. Am J Physiol Gastro-intest Liver Physiol. 2005; 288: G151–8. PMID:15297259
54. Joensuu H, Hohenberger P, Corless CL. Gastrointestinal stromal tumour. Lancet. Elsevier Ltd; 2013; 382: 973–83. doi:10.1016/S0140-6736(13)60106-3PMID:23623056
55. Baik SH, Kim NK, Lee CH, Lee KY, Sohn SK, Cho CH, et al. Gastrointestinal stromal tumor of the rec-tum: an analysis of seven cases. Surg Today. 2007; 37: 455–9. PMID:17522761
56. Manouras A, Pappas A, Katergiannakis V, Filis K, Chrysikos J, Pattas M, et al. Gastrointestinal stromal tumors of the rectum: report of five cases. Acta Gastroenterol Belg. 2009; 72: 257–261. PMID:
19637785
57. Beltran MA, Cruces KS. Primary tumors of jejunum and ileum as a cause of intestinal obstruction: a case control study. Int J Surg. 2007; 5: 183–91. PMID:17509501