Mycobacterium tuberculosis
Strains Potentially Involved
in the TB Epidemic in Sweden a Century Ago
Ramona Groenheit1*, Solomon Ghebremichael1, Alexandra Pennhag1, Jerker Jonsson1, Sven Hoffner1, David Couvin2, Tuija Koivula1,3, Nalin Rastogi2, Gunilla Ka¨llenius3
1Department of Preparedness, Swedish Institute for Communicable Disease Control, Solna, Sweden,2Tuberculosis and Mycobacteria Unit, WHO Supranational TB Reference Laboratory, Institut Pasteur de la Guadeloupe, Guadeloupe, France,3Department of Clinical Science and Education, Karolinska Institutet, So¨dersjukhuset, Stockholm, Sweden
Abstract
A hundred years ago the prevalence of tuberculosis (TB) in Sweden was one of the highest in the world. In this study we conducted a population-based search for distinct strains ofMycobacterium tuberculosiscomplex isolated from patients born in Sweden before 1945. Many of these isolates represent the M. tuberculosis complex population that fueled the TB epidemic in Sweden during the first half of the 20thcentury.
Methods: Genetic relationships between strains that caused the epidemic and present day strains were studied by spoligotyping and restriction fragment length polymorphism.
Results:The majority of the isolates from the elderly population were evolutionary recent Principal Genetic Group (PGG)2/3 strains (363/409 or 88.8%), and only a low proportion were ancient PGG1 strains (24/409 or 5.9%). Twenty-two were undefined. The isolates demonstrated a population where the Euro-American superlineage dominated; in particular with Haarlem (41.1%) and T (37.7%) spoligotypes and only 21.2% belonged to other spoligotype families. Isolates from the elderly population clustered much less frequently than did isolates from a young control group population.
Conclusions:A closely knit pool of PGG2/3 strains restricted to Sweden and its immediate neighbours appears to have played a role in the epidemic, while PGG1 strains are usually linked to migrants in todays Sweden. Further studies of these outbreak strains may give indications of why the epidemic waned.
Citation:Groenheit R, Ghebremichael S, Pennhag A, Jonsson J, Hoffner S, et al. (2012)Mycobacterium tuberculosisStrains Potentially Involved in the TB Epidemic in Sweden a Century Ago. PLoS ONE 7(10): e46848. doi:10.1371/journal.pone.0046848
Editor:Philip Supply, Institut Pasteur de Lille, France
ReceivedNovember 21, 2011;AcceptedSeptember 10, 2012;PublishedOctober 8, 2012
Copyright:ß2012 Groenheit et al. This is an open-access article distributed under the terms of the Creative Commons Attribution License, which permits unrestricted use, distribution, and reproduction in any medium, provided the original author and source are credited.
Funding:This work was financed by grants to Gunilla Ka¨llenius from Konung Gustaf V:s och Drottning Victorias Frimurarestiftelse, the Swedish Heart-Lung Foundation (http://www.hjart-lungfonden.se) and the Swedish Vetenskapsra˚det (http://www.vr.se). The funders had no role in study design, data collection and analysis, decision to publish, or preparation of the manuscript.
Competing Interests:The authors have declared that no competing interests exist. * E-mail: ramona.groenheit@smi.se
Introduction
Tuberculosis (TB) is globally a major cause of morbidity and mortality, with a majority of cases occurring in low income countries. As estimated by the WHO currently one third of the worlds population is infected with bacteria of the Mycobacterium tuberculosis complex, and ten million cases of active TB disease occur each year, resulting in almost two million deaths annually. The increasing spread of TB has also been paralleled by a rapid increase in multi-drug resistant TB in many parts of the world, making the disease in several instances practically incurable.
DistinctM. tuberculosis strains have been associated with large outbreaks of TB. Also in the Nordic countries there are outbreaks of specific strains of M. tuberculosis. During the last decades, a specific strain ofM. tuberculosishas emerged rapidly in Denmark [1], another outbreak has been recorded in Norway [2] and one of the largest outbreaks ever recorded in a low endemic country is ongoing in Sweden [3,4,5]. Little is known about theM. tuberculosis population that dominated Sweden a hundred years ago. It does however appear that this bacterial population has been successfully
reduced from representing the major public health problem to its current level of near elimination.
Today the Nordic countries are high-income nations with low prevalence of TB. In 2011, the TB incidence in Sweden was 6.3/ 100,000 population and only 11% of the TB patients were born in Sweden. The number of cases is almost entirely dependent on migration from countries with high TB incidence and the group of elderly Swedish born patients with reactivated TB infection is decreasing [6]. However, less than a century ago the prevalence of TB in the Nordic countries (Denmark, Finland, Norway and Sweden) was among the highest in the world. In 1905 the overall estimated TB incidence in Sweden was 890/100,000 population [7] higher than in most high incidence countries of sub-Saharan Africa today.
Ten percent of otherwise healthy persons infected with M. tuberculosis are estimated to progress to active disease, with the highest risk during the first two years after infection. A combination of bacterial and patient factors influence the risk for induction of active disease in patients with latent infection, and many who were infected may develop TB after decades of
infection [8]. In the elderly population in Sweden many are still latently infected with TB, and some develop active TB. In the cohorts born before 1945 most subjects presumably have latent TB infection (LTBI). Using a TB incidence among newborns of
,1/100,000 population as an indicator of interrupted TB transmission must be interpreted with caution but by doing so one can estimate that since around 1967 [9,10] most active TB cases occurring in the elderly Swedish-born population can be seen as reactivation of LTBI.
In the past decades our understanding of the molecular genetics of M. tuberculosis has further expanded. One of the major achievements using DNA fingerprinting techniques has been the implementation of population based transmission surveillance. Geographically defined lineages of M. tuberculosis have been identified [11] and specific genetically highly conserved groups of strains of M. tuberculosis have attracted special attention.
Worldwide, few collections of isolates from the 20thcentury are available. At the Swedish Institute for Communicable Disease Control (SMI) clinicalM. tuberculosisisolates have been preserved since the 1980s. This consequently provides us with an exceptional possibility to perform population-based studies of the transmission of TB. In this study we conduct the first systematic population-based search for distinct strains of M. tuberculosis isolated from elderly patients born in Sweden before 1945. The isolates represent strains most likely acquired in Sweden during the last 60–100 years, and many of these isolates may represent the M. tuberculosis population that fueled the TB epidemic in Sweden during the first half of the 20thcentury.
Materials and Methods
Ethics Statement
At the SMI, clinicalM. tuberculosiscomplex strains are routinely collected for disease surveillance. The current study describes a bacterial collection and the bacterial genotypes could only be combined with the sex, age, and country of birth for the patients from which the strains were isolated. Ethical approval was therefore not required.
Bacterial Isolates
M. tuberculosiscomplex isolates obtained from all six Swedish TB laboratories in Gothenburg, Linko¨ping, Malmo¨/Lund, Stockholm and Umea˚ during the years 1994–2009 were studied. They represent all strains from patients born in Sweden before 1945 that have been preserved at SMI during the sampling period and that did not cluster with any patients born after 1945 and/or were foreign born. During the same sampling period all isolates that had been preserved at SMI from patients born in Sweden in 1985 or later were also analysed as a control group. The patients were identified as born in Sweden through the national TB Register. The isolates had been stored at270Cu.
Drug Susceptibility Testing
In Sweden, all isolates are tested for susceptibility to the first-line drugs isoniazid (INH), rifampicin (RIF), ethambutol (EMB) and pyrazinamide (PZA) using the BACTEC 460TB or the MGIT 960 liquid culture and drug susceptibility testing systems according to the instructions of the manufacturer. During the major part of the study all isolates were also tested for susceptibility to streptomycin (SM), except for the years 2004–2009, when the Linko¨ping and Stockholm laboratories stopped testing for SM-resistance, since SM no longer was used for treatment of TB patients in Sweden. All laboratories had taken part in the external quality assurance
program for drug susceptibility testing ofM. tuberculosisoffered by the Swedish TB reference laboratory at SMI.
Spoligotyping
All isolates were characterized by spoligotyping, which charac-terizes the polymorphic direct repeat region of theM. tuberculosis chromosome [12]. The patterns obtained by spoligotyping were compared by visual examination and computer assisted analyses by use of the BioNumerics version 6.6 software (Applied Maths, Kortrijk, Belgium). The spoligotypes were also compared with those contained in the international database SITVIT2, an updated version of the previously published SpolDB4 database [11] (http://www.pasteur-guadeloupe.fr:8081/SITVITDemo) which defines 62 spoligotype families/subfamilies ofM. tuberculosis complex isolates. The SITVIT2 database contains to date genotyping data on more than 86,000 clinical isolates from 160 countries of origin, with more than 3,000 spoligo-international-types (SITs; a pattern shared by two or more patient isolates). The BioNumerics software version 3.5 was used to build spoligotyping-based minimum spanning trees (MST). MST is an undirected network in which all of the samples are linked together with the fewest possible linkages between nearest neighbors. Using this approach, one considers that all intermediate stages are present within the sample analyzed by first including the individual that shows the greatest number of possible linkages to other individuals in the population studied. We used this method to highlight the links between the spoligotype families differing by changes observed in their direct variable repeats. To evaluate the distribution of orphan strains in order to get information on their specific evolution two trees were generated - one for SITs, and another for all patterns, i.e. SITs and orphans pooled together. We also created spoligoforest trees [13] to illustrate probable strain evolutionary relationships between spoligotypes. Contrarily to the MSTs the spoligoforest trees are directed and only evolve by loss of spacers. Lastly, the majorM. tuberculosis genotypic families were also linked to ‘‘ancient’’ and ‘‘modern’’ lineages of tubercle bacilli as defined by Principal Genetic Groups (PGG) defined by katG463-gyrA95polymorphism [14], and inferred from the reported linking of specific spoligotype patterns to PGG1, 2 or 3 grouping [15,16,17,18,19]. For statistical analyses the isolates were catego-rised into three groups, modern [consisting of the Haarlem (H), T, Latin-American and Mediterranean (LAM), X and S families], ancient [consisting of Beijing, East-African-Indian (EAI) and Central-Asian (CAS) families] and [M. bovis/M. bovis like and Manu].
IS6110RFLP
The isolates were cultured on Lo¨wenstein Jensen medium, DNA was extracted and RFLP typing was performed using the insertion sequence IS6110as a probe andPvuII as the restriction enzyme [20]. Visual bands were analyzed using the BioNumerics version 6.6 software. On the basis of the molecular sizes of the hybridizing fragments and the number of IS6110 copies of each isolate, fingerprint patterns were compared by the un-weighted pair-group method of arithmetic averaging using the Jaccard coefficient. Dendrograms were constructed to show the degree of relatedness among strains according to a previously described algorithm [21] and similarity matrixes were generated to visualize the relatedness between the banding patterns of all isolates. The RFLP patterns were entered into the RFLP database at SMI, which at the time of this study contained 3951 isolates that had been isolated in Sweden. Strains with identical RFLP-patterns (100% similarity) were judged to belong to a cluster.
Statistical Method
Mean and standard deviation (SD) were calculated for age of the patient at diagnosis and year of birth by isolate group. Age and year of birth were not normally distributed and therefore possible differences in these variables for isolate group and gender were investigated with the non-parametric Kruskal-Wallis test. Post-hoc tests for isolate group were performed for the three pairs using the Kruskal-Wallis test (Mann-Whitney U test). The chi2-test was used to test for association between two categorical variables. The level of significance was set to 0.05 (two-sided) and all analyses were performed using R v 2.9.2 (R Foundation for Statistical Computing, Vienna, Austria).
Results
In total, 409 isolates from 242 (59.2%) men and 167 (40.8%) women born in Sweden before 1945 were analysed. These patients were born in Sweden between the years 1908–1945 (Table S1). A total of 9.8% were born before 1914, 19.6% were born in 1915– 1919, 27.1% were born in 1920–1924, 17.1% were born in 1925– 1929, 11.0% were born in 1930–1934, 7.3% were born in 1935– 1939 and 8.1% were born in 1940–1945. At diagnosis the patients were 52–98 years old, with a mean age of 78.1 years. The 58 patients in the young Swedes control group were born between the years 1985–2008 (Tabel S2). A total of 24.1% were born in 1985– 1989, 37.9% were born in 1990–1994, 17.2% were born in 1995– 1999, 8.6% were born in 2000–2004 and 12.1% were born in 2005–2008. At diagnosis the patients were 0–23 years old, with a mean age of 10.9 years.
Drug Resistance
Among the elderly Swedes, information on drug resistance was obtained for 404/409 isolates. Of those, 38 isolates (9.3%) were resistant to one or more of the drugs SM (n = 3), INH (n = 14), RIF (n = 4), EMB (n = 1) and PZA (n = 22). The large number of isolates resistant to PZA is explained by the inclusion ofM. bovis isolates in the study. Five isolates were resistant to more than one drug, and of those four isolates were multidrug resistant. Among the 58 young Swedes in the control group, 17 isolates (29.3%) were resistant to one or more of the drugs SM (n = 5), INH (n = 16), RIF (n = 2), EMB (n = 1) and PZA (n = 1). Five isolates were resistant to more than one drug, and of those two were multidrug resistant. As some laboratories during the study period stopped testing for SM resistance, only 207/409 and 17/58 of the isolates were analysed for SM resistance.
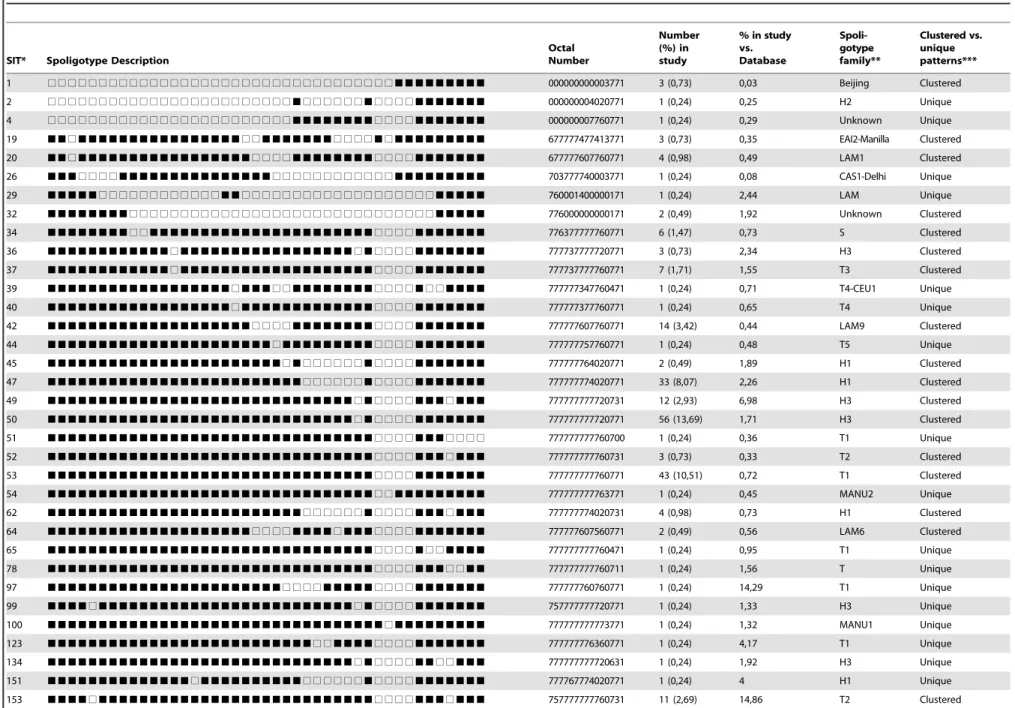
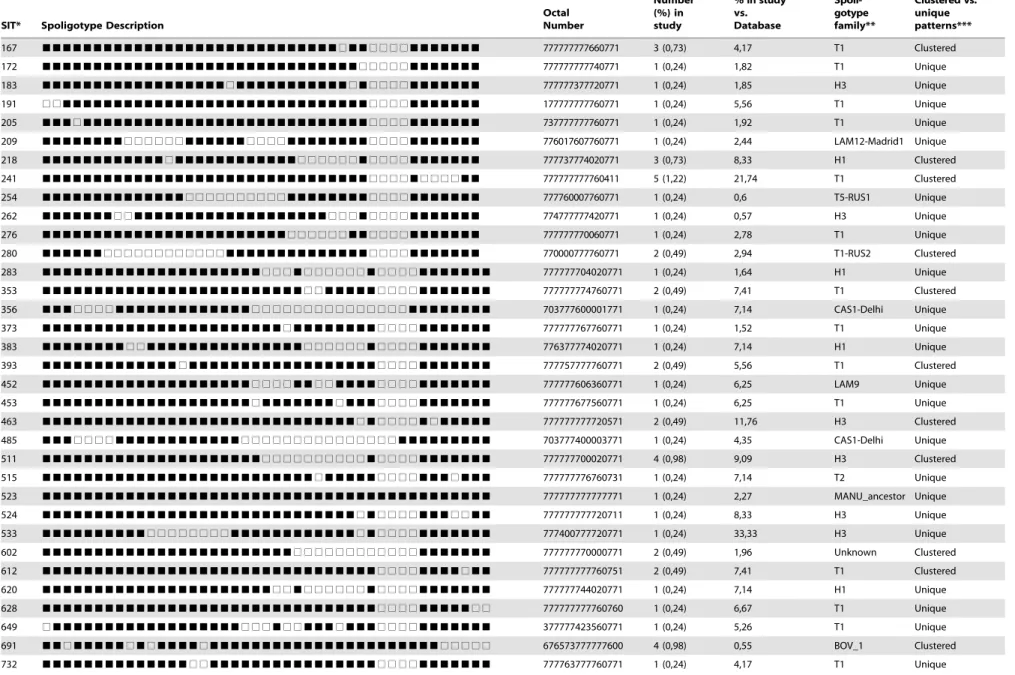
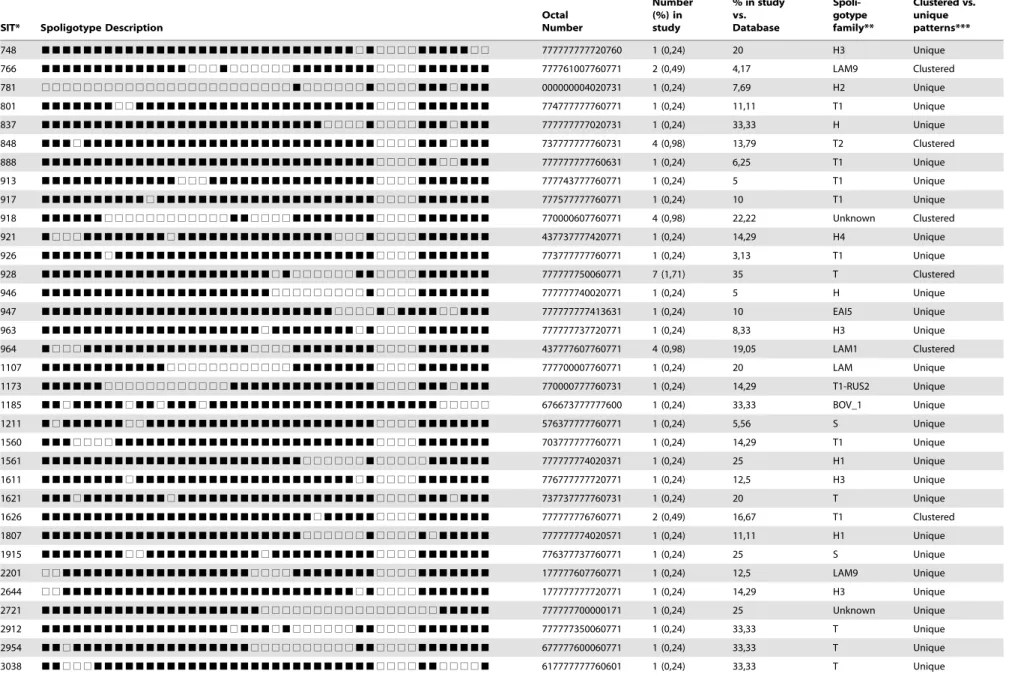
Spoligotyping
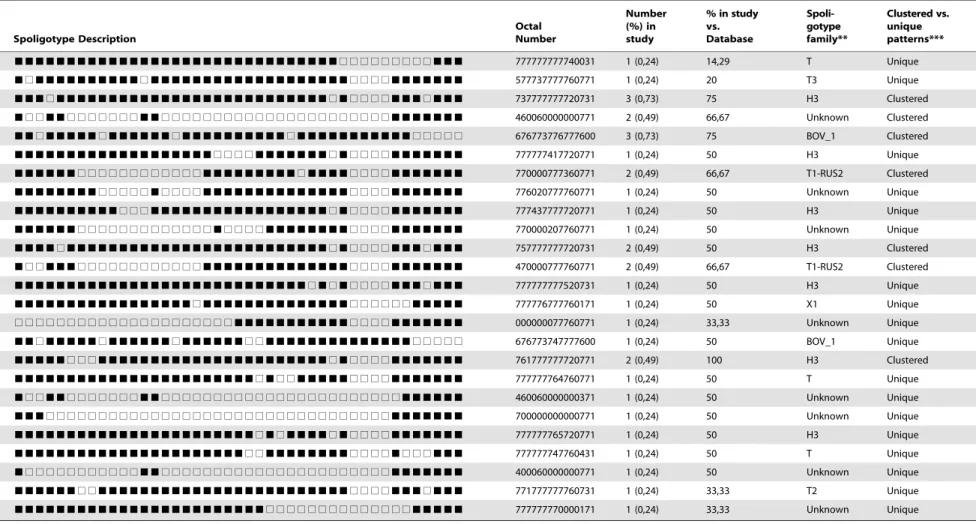
Out of 409 isolates, 173 different spoligo patterns were obtained, of which 277 (67.7%) were clustered in 41 spoligo clusters comprising 2–56 strains per cluster. The remaining 132 (32.3%) spoligo patterns were unique i.e. the isolates did not cluster with other patient isolates. When compared with SITVIT2, the majority, 364 clinical isolates, were shared-types (Table 1), i.e. had an identical pattern shared by two or more isolates worldwide (within this study, or matching another strain in the SITVIT2 database). A SIT number was attributed to each pattern according to the SITVIT2 database. Forty-five patterns corresponded to orphan strains that were unique among the 86,000 strains recorded in the SITVIT2 database (Table 2). The isolates demonstrated a highly homogenous population where the modern H and T clades dominated. The absolute majority (n = 363, 88.8%) were evolutionary recent PGG2/3 strains, including H (n = 168, 41.1%), T (n = 154, 37.7%), LAM (n = 32), S (n = 8) and X (n = 1) isolates (Table 1 and S3). Only 24 (5.9%) were
evolutionary ancient PGG1 strains (3 Beijing, 3 CAS1-Delhi, 4 EAI, 3 Manu and 11M. bovis/M. bovislike isolates) (Table 1 and S4). Twenty-two spoligotyping signatures that are not yet associated to a well-defined spoligotype familiy in SITVIT2 were designated as ‘‘Unknown’’ (Table 1 and 2). The most common spoligotypes were SIT50 (n = 56, 13.7%) of the H3 subfamily, SIT53 (n = 43, 10.5%) of the T1 subfamily, SIT47 (n = 33, 8.1%) of the H1 subfamily and SIT42 (n = 14, 3.4%) of the LAM9 subfamily (Table S3). In addition to the T1 subfamily prototype, SIT53, two more T clade SITs, SIT153 (n = 11, 2.7%) and SIT37 (n = 7, 1.7%) were among the seven predominant SITs. Four of the M. bovis isolates (SIT691) lacked spacer 11, in addition to spacers 3, 9, 16, and 39 to 43. Of the 45 orphan strains, 22 were of the T spoligotype family, 17 of the H family, 2M. bovis/M. bovis like, 1 LAM family and 3 of unknown family. Significant for all except the twoM. bovisstrains was that they all lacked spacers 33– 36 (signature of SIT53).
The 168 patients with H family isolates were born between 1908–1945 (median 1924), with a mean age of 77.8 years at diagnosis (range 52–98), the 154 patients with T family isolates were born between 1910–1945 (median 1923), with a mean age of 78.5 years at diagnosis (range 53–97), and the 32 patients with LAM family isolates were born between 1913–1943 (median 1923), with a mean age of 78.9 years at diagnosis (range 63–93). The three CAS1-Delhi strains were isolated from patients born in 1921, 1938, and 1943 with a mean age of 67.7 years (57, 71, and 75 years). The four patients with EAI isolates were born later than the patients with H, T and LAM isolates. They were all except one born in the 1940s: three EAI2-Manilla isolates from patients born 1911, 1943 and 1943 and one EAI5 isolate from a patient born 1943. The patients were also younger (mean age 68.0) than average at diagnosis (57, 62, 66 and 87 years). The three patients with Beijing isolates were all diagnosed between 2007 and 2008, i.e. in the later part of the study, at a mean age of 80.7 years. We tested the hypothesis that the 363 ‘‘modern’’ isolates of the H, T, LAM, X and S families differed in patient characteristics compared to the 24 ‘‘ancient’’ isolates split into two groups [group one (n = 10): Beijing, EAI and CAS and group two (n = 14): M. bovis/M. bovislike and Manu] with regard to the age of the patients at diagnosis and date of birth. Patients with ‘‘modern’’ isolates of the H, T, LAM, X and S families were significantly older at diagnosis and were born significantly earlier than patients with ‘‘ancient’’ isolates.
For phylogenetical analyses, we drew two separate MSTs (Figure 1) to summarize the possible evolutionary relationships between all the genotypes obtained. Figure 1A is based only on SITs, while Figure 1B shows combined data for both SITs and orphan patterns pooled together. The SIT-based MST (Figure 1A) shows a tree split into distinct families: the top section displays the ancient PGG1 strains (EAI, Bovis, Manu and CAS1-Delhi families) whereas the bottom shows the evolutionary modern PGG2/3 strains belonging to the H, T and LAM families. As summarized in Table 2, it should be noticed that only 2/47 orphan strains were PGG1 (1 BOV-1, and 1 BOV_LIKE), the rest being evolutionary modern PGG2/3. The spoligoforests generated (see Figures S1 and S2, and legends for detailed comments) highlighted the predominance of PGG2/3 group which are well represented (as large, visible nodes). The rare ancestral PGG1 strains (belonging to the EAI, Manu, and CAS families) were mostly located in the top layer of the hierarchical layout as isolated strains without interconnections with others (Figure S1).
Interestingly, the MST shown after combining orphans with SITs in Figure 1B is overlapping with the tree shown in Figure 1A in the sense that the two ancestral PGG1 orphans were grouped
TB Strains in the Swedish Epidemic a Century Ago
Table 1.Description of 127 shared-types (SITs; n = 364 isolates, 2–56 isolates per cluster) and corresponding spoligotyping families/subfamilies starting from a total of 409M. tuberculosiscomplex strains isolated from Swedish patients born before 1945.
SIT* Spoligotype Description
Octal Number
Number (%) in study
% in study vs. Database
Spoli-gotype family**
Clustered vs. unique patterns***
1 %%%%%%%%%%%%%%%%%%%%%%%%%%%%%%%%%%&&&&&&&&& 000000000003771 3 (0,73) 0,03 Beijing Clustered
2 %%%%%%%%%%%%%%%%%%%%%%%%&%%%%%%&%%%%&&&&&&& 000000004020771 1 (0,24) 0,25 H2 Unique
4 %%%%%%%%%%%%%%%%%%%%%%%%&&&&&&&&%%%%&&&&&&& 000000007760771 1 (0,24) 0,29 Unknown Unique
19 &&%&&&&&&&&&&&&&&&&%%&&&&&&&%%%%&%&&&&&&&&& 677777477413771 3 (0,73) 0,35 EAI2-Manilla Clustered
20 &&%&&&&&&&&&&&&&&&&&%%%%&&&&&&&&%%%%&&&&&&& 677777607760771 4 (0,98) 0,49 LAM1 Clustered
26 &&&%%%%&&&&&&&&&&&&&&&%%%%%%%%%%%%&&&&&&&&& 703777740003771 1 (0,24) 0,08 CAS1-Delhi Unique
29 &&&&&%%%%%%%%%%%%&&%%%%%%%%%%%%%%%%%%%&&&&& 760001400000171 1 (0,24) 2,44 LAM Unique
32 &&&&&&&&%%%%%%%%%%%%%%%%%%%%%%%%%%%%%%&&&&& 776000000000171 2 (0,49) 1,92 Unknown Clustered
34 &&&&&&&&%%&&&&&&&&&&&&&&&&&&&&&&%%%%&&&&&&& 776377777760771 6 (1,47) 0,73 S Clustered
36 &&&&&&&&&&&&%&&&&&&&&&&&&&&&&&%&%%%%&&&&&&& 777737777720771 3 (0,73) 2,34 H3 Clustered
37 &&&&&&&&&&&&%&&&&&&&&&&&&&&&&&&&%%%%&&&&&&& 777737777760771 7 (1,71) 1,55 T3 Clustered
39 &&&&&&&&&&&&&&&&&&%&&&%%&&&&&&&&%%%%&%%&&&& 777777347760471 1 (0,24) 0,71 T4-CEU1 Unique
40 &&&&&&&&&&&&&&&&&&%&&&&&&&&&&&&&%%%%&&&&&&& 777777377760771 1 (0,24) 0,65 T4 Unique
42 &&&&&&&&&&&&&&&&&&&&%%%%&&&&&&&&%%%%&&&&&&& 777777607760771 14 (3,42) 0,44 LAM9 Clustered
44 &&&&&&&&&&&&&&&&&&&&&&%&&&&&&&&&%%%%&&&&&&& 777777757760771 1 (0,24) 0,48 T5 Unique
45 &&&&&&&&&&&&&&&&&&&&&&&%&%%%%%%&%%%%&&&&&&& 777777764020771 2 (0,49) 1,89 H1 Clustered
47 &&&&&&&&&&&&&&&&&&&&&&&&&%%%%%%&%%%%&&&&&&& 777777774020771 33 (8,07) 2,26 H1 Clustered
49 &&&&&&&&&&&&&&&&&&&&&&&&&&&&&&%&%%%%&&&%&&& 777777777720731 12 (2,93) 6,98 H3 Clustered
50 &&&&&&&&&&&&&&&&&&&&&&&&&&&&&&%&%%%%&&&&&&& 777777777720771 56 (13,69) 1,71 H3 Clustered
51 &&&&&&&&&&&&&&&&&&&&&&&&&&&&&&&&%%%%&&&%%%% 777777777760700 1 (0,24) 0,36 T1 Unique
52 &&&&&&&&&&&&&&&&&&&&&&&&&&&&&&&&%%%%&&&%&&& 777777777760731 3 (0,73) 0,33 T2 Clustered
53 &&&&&&&&&&&&&&&&&&&&&&&&&&&&&&&&%%%%&&&&&&& 777777777760771 43 (10,51) 0,72 T1 Clustered
54 &&&&&&&&&&&&&&&&&&&&&&&&&&&&&&&&%%&&&&&&&&& 777777777763771 1 (0,24) 0,45 MANU2 Unique
62 &&&&&&&&&&&&&&&&&&&&&&&&&%%%%%%&%%%%&&&%&&& 777777774020731 4 (0,98) 0,73 H1 Clustered
64 &&&&&&&&&&&&&&&&&&&&%%%%&&&&%&&&%%%%&&&&&&& 777777607560771 2 (0,49) 0,56 LAM6 Clustered
65 &&&&&&&&&&&&&&&&&&&&&&&&&&&&&&&&%%%%&%%&&&& 777777777760471 1 (0,24) 0,95 T1 Unique
78 &&&&&&&&&&&&&&&&&&&&&&&&&&&&&&&&%%%%&&&%%&& 777777777760711 1 (0,24) 1,56 T Unique
97 &&&&&&&&&&&&&&&&&&&&&&&%%%%&&&&&%%%%&&&&&&& 777777760760771 1 (0,24) 14,29 T1 Unique
99 &&&&%&&&&&&&&&&&&&&&&&&&&&&&&&%&%%%%&&&&&&& 757777777720771 1 (0,24) 1,33 H3 Unique
100 &&&&&&&&&&&&&&&&&&&&&&&&&&&&&&&&&%&&&&&&&&& 777777777773771 1 (0,24) 1,32 MANU1 Unique
123 &&&&&&&&&&&&&&&&&&&&&&&&&&%%&&&&%%%%&&&&&&& 777777776360771 1 (0,24) 4,17 T1 Unique
134 &&&&&&&&&&&&&&&&&&&&&&&&&&&&&&%&%%%%&&%%&&& 777777777720631 1 (0,24) 1,92 H3 Unique
151 &&&&&&&&&&&&&&%&&&&&&&&&&%%%%%%&%%%%&&&&&&& 777767774020771 1 (0,24) 4 H1 Unique
153 &&&&%&&&&&&&&&&&&&&&&&&&&&&&&&&&%%%%&&&%&&& 757777777760731 11 (2,69) 14,86 T2 Clustered
TB
Strains
in
the
Swedish
Epidemic
a
Century
Ago
ONE
|
www.ploson
e.org
4
October
2012
|
Volume
7
|
Issue
10
|
Table 1.Cont.
SIT* Spoligotype Description
Octal Number
Number (%) in study
% in study vs. Database
Spoli-gotype family**
Clustered vs. unique patterns***
167 &&&&&&&&&&&&&&&&&&&&&&&&&&&&&%&&%%%%&&&&&&& 777777777660771 3 (0,73) 4,17 T1 Clustered
172 &&&&&&&&&&&&&&&&&&&&&&&&&&&&&&&%%%%%&&&&&&& 777777777740771 1 (0,24) 1,82 T1 Unique
183 &&&&&&&&&&&&&&&&&&%&&&&&&&&&&&%&%%%%&&&&&&& 777777377720771 1 (0,24) 1,85 H3 Unique
191 %%&&&&&&&&&&&&&&&&&&&&&&&&&&&&&&%%%%&&&&&&& 177777777760771 1 (0,24) 5,56 T1 Unique
205 &&&%&&&&&&&&&&&&&&&&&&&&&&&&&&&&%%%%&&&&&&& 737777777760771 1 (0,24) 1,92 T1 Unique
209 &&&&&&&&%%%%%%&&&&&&%%%%&&&&&&&&%%%%&&&&&&& 776017607760771 1 (0,24) 2,44 LAM12-Madrid1 Unique
218 &&&&&&&&&&&&%&&&&&&&&&&&&%%%%%%&%%%%&&&&&&& 777737774020771 3 (0,73) 8,33 H1 Clustered
241 &&&&&&&&&&&&&&&&&&&&&&&&&&&&&&&&%%%%&%%%%&& 777777777760411 5 (1,22) 21,74 T1 Clustered
254 &&&&&&&&&&&&&&%%%%%%%%%%&&&&&&&&%%%%&&&&&&& 777760007760771 1 (0,24) 0,6 T5-RUS1 Unique
262 &&&&&&&%%&&&&&&&&&&&&&&&&&&&%%%&%%%%&&&&&&& 774777777420771 1 (0,24) 0,57 H3 Unique
276 &&&&&&&&&&&&&&&&&&&&&&&&%%%%%%&&%%%%&&&&&&& 777777770060771 1 (0,24) 2,78 T1 Unique
280 &&&&&&%%%%%%%%%%%%&&&&&&&&&&&&&&%%%%&&&&&&& 770000777760771 2 (0,49) 2,94 T1-RUS2 Clustered
283 &&&&&&&&&&&&&&&&&&&&&%%%&%%%%%%&%%%%&&&&&&& 777777704020771 1 (0,24) 1,64 H1 Unique
353 &&&&&&&&&&&&&&&&&&&&&&&&&%%&&&&&%%%%&&&&&&& 777777774760771 2 (0,49) 7,41 T1 Clustered
356 &&&%%%%&&&&&&&&&&&&&%%%%%%%%%%%%%%%&&&&&&&& 703777600001771 1 (0,24) 7,14 CAS1-Delhi Unique
373 &&&&&&&&&&&&&&&&&&&&&&&%&&&&&&&&%%%%&&&&&&& 777777767760771 1 (0,24) 1,52 T1 Unique
383 &&&&&&&&%%&&&&&&&&&&&&&&&%%%%%%&%%%%&&&&&&& 776377774020771 1 (0,24) 7,14 H1 Unique
393 &&&&&&&&&&&&&%&&&&&&&&&&&&&&&&&&%%%%&&&&&&& 777757777760771 2 (0,49) 5,56 T1 Clustered
452 &&&&&&&&&&&&&&&&&&&&%%%%&&%%&&&&%%%%&&&&&&& 777777606360771 1 (0,24) 6,25 LAM9 Unique
453 &&&&&&&&&&&&&&&&&&&&%&&&&&&&%&&&%%%%&&&&&&& 777777677560771 1 (0,24) 6,25 T1 Unique
463 &&&&&&&&&&&&&&&&&&&&&&&&&&&&&&%&%%%%&%&&&&& 777777777720571 2 (0,49) 11,76 H3 Clustered
485 &&&%%%%&&&&&&&&&&&&%%%%%%%%%%%%%%%&&&&&&&&& 703777400003771 1 (0,24) 4,35 CAS1-Delhi Unique
511 &&&&&&&&&&&&&&&&&&&&&%%%%%%%%%%&%%%%&&&&&&& 777777700020771 4 (0,98) 9,09 H3 Clustered
515 &&&&&&&&&&&&&&&&&&&&&&&&&&%&&&&&%%%%&&&%&&& 777777776760731 1 (0,24) 7,14 T2 Unique
523 &&&&&&&&&&&&&&&&&&&&&&&&&&&&&&&&&&&&&&&&&&& 777777777777771 1 (0,24) 2,27 MANU_ancestor Unique
524 &&&&&&&&&&&&&&&&&&&&&&&&&&&&&&%&%%%%&&&%%&& 777777777720711 1 (0,24) 8,33 H3 Unique
533 &&&&&&&&&&%%%%%%%%&&&&&&&&&&&&%&%%%%&&&&&&& 777400777720771 1 (0,24) 33,33 H3 Unique
602 &&&&&&&&&&&&&&&&&&&&&&&&%%%%%%%%%%%%&&&&&&& 777777770000771 2 (0,49) 1,96 Unknown Clustered
612 &&&&&&&&&&&&&&&&&&&&&&&&&&&&&&&&%%%%&&&&%&& 777777777760751 2 (0,49) 7,41 T1 Clustered
620 &&&&&&&&&&&&&&&&&&&&&&%%&%%%%%%&%%%%&&&&&&& 777777744020771 1 (0,24) 7,14 H1 Unique
628 &&&&&&&&&&&&&&&&&&&&&&&&&&&&&&&&%%%%&&&&&%% 777777777760760 1 (0,24) 6,67 T1 Unique
649 %&&&&&&&&&&&&&&&&&&%%%&%%&&&%&&&%%%%&&&&&&& 377777423560771 1 (0,24) 5,26 T1 Unique
691 &&%&&&&&%&%&&&&%&&&&&&&&&&&&&&&&&&&&&&%%%%% 676573777777600 4 (0,98) 0,55 BOV_1 Clustered
732 &&&&&&&&&&&&&&%%&&&&&&&&&&&&&&&&%%%%&&&&&&& 777763777760771 1 (0,24) 4,17 T1 Unique
TB
Strains
in
the
Swedish
Epidemic
a
Century
Ago
PLOS
ONE
|
www.ploson
e.org
5
October
2012
|
Volume
7
|
Issue
10
|
Table 1.Cont.
SIT* Spoligotype Description
Octal Number
Number (%) in study
% in study vs. Database
Spoli-gotype family**
Clustered vs. unique patterns***
748 &&&&&&&&&&&&&&&&&&&&&&&&&&&&&&%&%%%%&&&&&%% 777777777720760 1 (0,24) 20 H3 Unique
766 &&&&&&&&&&&&&&%%%&%%%%%%&&&&&&&&%%%%&&&&&&& 777761007760771 2 (0,49) 4,17 LAM9 Clustered
781 %%%%%%%%%%%%%%%%%%%%%%%%&%%%%%%&%%%%&&&%&&& 000000004020731 1 (0,24) 7,69 H2 Unique
801 &&&&&&&%%&&&&&&&&&&&&&&&&&&&&&&&%%%%&&&&&&& 774777777760771 1 (0,24) 11,11 T1 Unique
837 &&&&&&&&&&&&&&&&&&&&&&&&&&&%%%%&%%%%&&&%&&& 777777777020731 1 (0,24) 33,33 H Unique
848 &&&%&&&&&&&&&&&&&&&&&&&&&&&&&&&&%%%%&&&%&&& 737777777760731 4 (0,98) 13,79 T2 Clustered
888 &&&&&&&&&&&&&&&&&&&&&&&&&&&&&&&&%%%%&&%%&&& 777777777760631 1 (0,24) 6,25 T1 Unique
913 &&&&&&&&&&&&&%%%&&&&&&&&&&&&&&&&%%%%&&&&&&& 777743777760771 1 (0,24) 5 T1 Unique
917 &&&&&&&&&&%&&&&&&&&&&&&&&&&&&&&&%%%%&&&&&&& 777577777760771 1 (0,24) 10 T1 Unique
918 &&&&&&%%%%%%%%%%%%&&%%%%&&&&&&&&%%%%&&&&&&& 770000607760771 4 (0,98) 22,22 Unknown Clustered
921 &%%%&&&&&&&&%&&&&&&&&&&&&&&&%%%&%%%%&&&&&&& 437737777420771 1 (0,24) 14,29 H4 Unique
926 &&&&&&%&&&&&&&&&&&&&&&&&&&&&&&&&%%%%&&&&&&& 773777777760771 1 (0,24) 3,13 T1 Unique
928 &&&&&&&&&&&&&&&&&&&&&&%&%%%%%%&&%%%%&&&&&&& 777777750060771 7 (1,71) 35 T Clustered
946 &&&&&&&&&&&&&&&&&&&&&&%%%%%%%%%&%%%%&&&&&&& 777777740020771 1 (0,24) 5 H Unique
947 &&&&&&&&&&&&&&&&&&&&&&&&&&&&%%%%&%&&&&%%&&& 777777777413631 1 (0,24) 10 EAI5 Unique
963 &&&&&&&&&&&&&&&&&&&&&%&&&&&&&&%&%%%%&&&&&&& 777777737720771 1 (0,24) 8,33 H3 Unique
964 &%%%&&&&&&&&&&&&&&&&%%%%&&&&&&&&%%%%&&&&&&& 437777607760771 4 (0,98) 19,05 LAM1 Clustered
1107 &&&&&&&&&&&&%%%%%%%%%%%%&&&&&&&&%%%%&&&&&&& 777700007760771 1 (0,24) 20 LAM Unique
1173 &&&&&&%%%%%%%%%%%%&&&&&&&&&&&&&&%%%%&&&%&&& 770000777760731 1 (0,24) 14,29 T1-RUS2 Unique
1185 &&%&&&&&%&&%&&&%&&&&&&&&&&&&&&&&&&&&&&%%%%% 676673777777600 1 (0,24) 33,33 BOV_1 Unique
1211 &%&&&&&&%%&&&&&&&&&&&&&&&&&&&&&&%%%%&&&&&&& 576377777760771 1 (0,24) 5,56 S Unique
1560 &&&%%%%&&&&&&&&&&&&&&&&&&&&&&&&&%%%%&&&&&&& 703777777760771 1 (0,24) 14,29 T1 Unique
1561 &&&&&&&&&&&&&&&&&&&&&&&&&%%%%%%&%%%%%&&&&&& 777777774020371 1 (0,24) 25 H1 Unique
1611 &&&&&&&&%&&&&&&&&&&&&&&&&&&&&&%&%%%%&&&&&&& 776777777720771 1 (0,24) 12,5 H3 Unique
1621 &&&%&&&&&&&&%&&&&&&&&&&&&&&&&&&&%%%%&&&%&&& 737737777760731 1 (0,24) 20 T Unique
1626 &&&&&&&&&&&&&&&&&&&&&&&&&&%&&&&&%%%%&&&&&&& 777777776760771 2 (0,49) 16,67 T1 Clustered
1807 &&&&&&&&&&&&&&&&&&&&&&&&&%%%%%%&%%%%&%&&&&& 777777774020571 1 (0,24) 11,11 H1 Unique
1915 &&&&&&&&%%&&&&&&&&&&&%&&&&&&&&&&%%%%&&&&&&& 776377737760771 1 (0,24) 25 S Unique
2201 %%&&&&&&&&&&&&&&&&&&%%%%&&&&&&&&%%%%&&&&&&& 177777607760771 1 (0,24) 12,5 LAM9 Unique
2644 %%&&&&&&&&&&&&&&&&&&&&&&&&&&&&%&%%%%&&&&&&& 177777777720771 1 (0,24) 14,29 H3 Unique
2721 &&&&&&&&&&&&&&&&&&&&&%%%%%%%%%%%%%%%%%&&&&& 777777700000171 1 (0,24) 25 Unknown Unique
2912 &&&&&&&&&&&&&&&&&&%&&&%&%%%%%%&&%%%%&&&&&&& 777777350060771 1 (0,24) 33,33 T Unique
2954 &&%&&&&&&&&&&&&&&&&&%%%%%%%%%%&&%%%%&&&&&&& 677777600060771 1 (0,24) 33,33 T Unique
3038 &&%%%&&&&&&&&&&&&&&&&&&&&&&&&&&&%%%%&&%%%%& 617777777760601 1 (0,24) 33,33 T Unique
TB
Strains
in
the
Swedish
Epidemic
a
Century
Ago
ONE
|
www.ploson
e.org
6
October
2012
|
Volume
7
|
Issue
10
|
Table 1.Cont.
SIT* Spoligotype Description
Octal Number
Number (%) in study
% in study vs. Database
Spoli-gotype family**
Clustered vs. unique patterns***
3091 &&&&&&&&&&&&&&&&&&&&&&&&&&&&&&&%%%%%%%%%&&& 777777777740031 1 (0,24) 14,29 T Unique
3139 &%&&&&&&&&&&%&&&&&&&&&&&&&&&&&&&%%%%&&&&&&& 577737777760771 1 (0,24) 20 T3 Unique
3168* &&&%&&&&&&&&&&&&&&&&&&&&&&&&&&%&%%%%&&&%&&& 737777777720731 3 (0,73) 75 H3 Clustered
3169* &%%&&%%%%%%%&&%%%%%%%%%%%%%%%%%%%%%%&&&&&&& 460060000000771 2 (0,49) 66,67 Unknown Clustered
3170* &&%&&&&&%&&&&&&%&&&&&&&&&&%&&&&&&&&&&&%%%%% 676773776777600 3 (0,73) 75 BOV_1 Clustered
3171* &&&&&&&&&&&&&&&&&&&%%%%&&&&&&&%&%%%%&&&&&&& 777777417720771 1 (0,24) 50 H3 Unique
3173* &&&&&&%%%%%%%%%%%%&&&&&&&&&%&&&&%%%%&&&&&&& 770000777360771 2 (0,49) 66,67 T1-RUS2 Clustered
3175* &&&&&&&&%%%%%&%%%%&&&&&&&&&&&&&&%%%%&&&&&&& 776020777760771 1 (0,24) 50 Unknown Unique
3176* &&&&&&&&&&%%%&&&&&&&&&&&&&&&&&%&%%%%&&&&&&& 777437777720771 1 (0,24) 50 H3 Unique
3177* &&&&&&%%%%%%%%%%%%%&%%%%&&&&&&&&%%%%&&&&&&& 770000207760771 1 (0,24) 50 Unknown Unique
3179* &&&&%&&&&&&&&&&&&&&&&&&&&&&&&&%&%%%%&&&%&&& 757777777720731 2 (0,49) 50 H3 Clustered
3180* &%%&&&%%%%%%%%%%%%&&&&&&&&&&&&&&%%%%&&&&&&& 470000777760771 2 (0,49) 66,67 T1-RUS2 Clustered
3181* &&&&&&&&&&&&&&&&&&&&&&&&&&&&%&%&%%%%&&&%&&& 777777777520731 1 (0,24) 50 H3 Unique
3182* &&&&&&&&&&&&&&&&&%&&&&&&&&&&&&&&%%%%%%&&&&& 777776777760171 1 (0,24) 50 X1 Unique
3183* %%%%%%%%%%%%%%%%%%%%%&&&&&&&&&&&%%%%&&&&&&& 000000077760771 1 (0,24) 33,33 Unknown Unique
3184* &&%&&&&&%&&&&&&%&&&&&&%%&&&&&&&&&&&&&&%%%%% 676773747777600 1 (0,24) 50 BOV_1 Unique
3185* &&&&&%%%&&&&&&&&&&&&&&&&&&&&&&%&%%%%&&&&&&& 761777777720771 2 (0,49) 100 H3 Clustered
3186* &&&&&&&&&&&&&&&&&&&&&&&%&%%&&&&&%%%%&&&&&&& 777777764760771 1 (0,24) 50 T Unique
3187* &%%&&%%%%%%%&&%%%%%%%%%%%%%%%%%%%%%%%&&&&&& 460060000000371 1 (0,24) 50 Unknown Unique
3188* &&&%%%%%%%%%%%%%%%%%%%%%%%%%%%%%%%%%&&&&&&& 700000000000771 1 (0,24) 50 Unknown Unique
3189* &&&&&&&&&&&&&&&&&&&&&&&%&%&&&&%&%%%%&&&&&&& 777777765720771 1 (0,24) 50 H3 Unique
3190* &&&&&&&&&&&&&&&&&&&&&&%%&&&&&&&&%%%%&%%%&&& 777777747760431 1 (0,24) 50 T Unique
3191* &%%%%%%%%%%%&&%%%%%%%%%%%%%%%%%%%%%%&&&&&&& 400060000000771 1 (0,24) 50 Unknown Unique
3199* &&&&&&%%&&&&&&&&&&&&&&&&&&&&&&&&%%%%&&&%&&& 771777777760731 1 (0,24) 33,33 T2 Unique
3276* &&&&&&&&&&&&&&&&&&&&&&&&%%%%%%%%%%%%%%&&&&& 777777770000171 1 (0,24) 33,33 Unknown Unique
A total of 104 SITs containing 332 isolates matched a preexisting shared type in the SITVIT2 database, whereas 23 SITs (n = 32 isolates) were newly-created either within the present study or after a match with an orphan in the database.
*SIT followed by an asterisk indicates ‘‘newly created shared-type’’ (n = 24 containing 34 isolates) due to two or more strains belonging to an identical new pattern within this study or after a match with an orphan in the database. SIT designations followed by number of strains: 3168* this study n = 3, PER n = 1; 3169* this study n = 2, USA n = 1; 3170* this study n = 3, SWE n = 1; 3171* this study n = 1, BRA n = 1; 3172* this study n = 1, VEN n = 1; 3173* this study n = 2, POL n = 1; 3174* this study n = 2; 3175 this study n = 1, USA n = 1; 3176* this study n = 1, ZAF n = 1; 3177* this study n = 1, GLP n = 1; 3178* this study n = 1, ALB n = 1; 3179* this study n = 2, FXX n = 2; 3180* this study n = 2, USA n = 1; 3181* this study n = 1, USA n = 1; 3182* this study n = 1, AUS n = 1; 3183* this study n = 1, FXX n = 1, ALB n = 1; 3184* this study n = 1, SWE n = 1; 3185* this study n = 2; 3186* this study n = 1, SWE n = 1; 3187* this study n = 1, SWE n = 1; 3188* this study n = 1, BEL n = 1; 3189* this study n = 1, DEU n = 1; 3190* this study n = 1, DEU n = 1; 3191* this study n = 1, SWE n = 1; 3199* this study n = 1, CHN n = 1, JPN n = 1; 3276* this study n = 1, COL n = 1, ITA n = 1. **Spoligotype family designations according to SITVIT2 using revised SpolDB4 rules; ‘‘Unknown’’ designates patterns with signatures that do not belong to any of the major clades described in the database.
***Clustered strains correspond to a similar spoligotype pattern shared by two or more strains ‘‘within this study’’; as opposed to unique strains harboring a spoligotype pattern that does not match with another strain from this study. Unique strains matching a preexisting pattern in the SITVIT2 database are classified as SITs, whereas in case of no match, they are designated as ‘‘orphan’’.
doi:10.1371/journal.pone.0046848.t001
TB
Strains
in
the
Swedish
Epidemic
a
Century
Ago
PLOS
ONE
|
www.ploson
e.org
7
October
2012
|
Volume
7
|
Issue
10
|
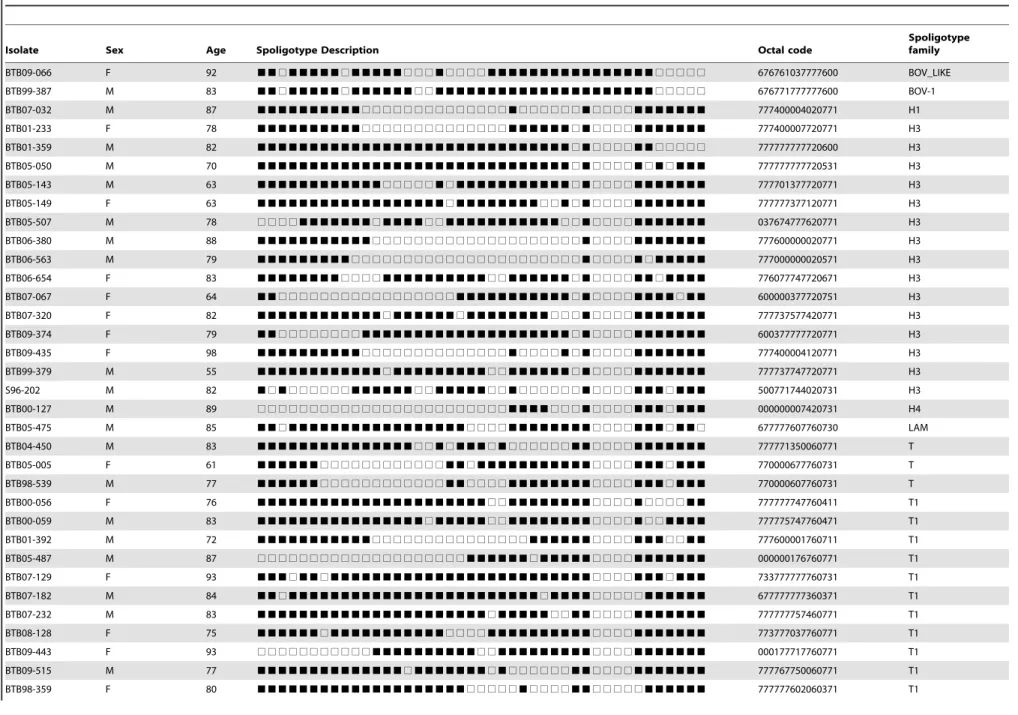
Table 2.Orphan strains (n = 45) and corresponding spoligotyping families/subfamilies found among a total of 409M. tuberculosiscomplex strains isolated from Swedish patients born before 1945.
Isolate Sex Age Spoligotype Description Octal code
Spoligotype family
BTB09-066 F 92 &&%&&&&&%&&&&&%%%&%%%%&&&&&&&&&&&&&&&&%%%%% 676761037777600 BOV_LIKE
BTB99-387 M 83 &&%&&&&&%&&&&&&%%&&&&&&&&&&&&&&&&&&&&&%%%%% 676771777777600 BOV-1
BTB07-032 M 87 &&&&&&&&&&%%%%%%%%%%%%%%&%%%%%%&%%%%&&&&&&& 777400004020771 H1
BTB01-233 F 78 &&&&&&&&&&%%%%%%%%%%%%%%&&&&&&%&%%%%&&&&&&& 777400007720771 H3
BTB01-359 M 82 &&&&&&&&&&&&&&&&&&&&&&&&&&&&&&%&%%%%&&%%%%% 777777777720600 H3
BTB05-050 M 70 &&&&&&&&&&&&&&&&&&&&&&&&&&&&&&%&%%%%&%&%&&& 777777777720531 H3
BTB05-143 M 63 &&&&&&&&&&&&%%%%%&%&&&&&&&&&&&%&%%%%&&&&&&& 777701377720771 H3
BTB05-149 F 63 &&&&&&&&&&&&&&&&&&%&&&&&&&&%%&%&%%%%&&&&&&& 777777377120771 H3
BTB05-507 M 78 %%%%&&&&&&&%&&&&%%&&&&&&&&&&&%%&%%%%&&&&&&& 037674777620771 H3
BTB06-380 M 88 &&&&&&&&&&&%%%%%%%%%%%%%%%%%%%%&%%%%&&&&&&& 777600000020771 H3
BTB06-563 M 79 &&&&&&&&&%%%%%%%%%%%%%%%%%%%%%%&%%%%&%&&&&& 777000000020571 H3
BTB06-654 F 83 &&&&&&&&%%%%&&&&&&&&&&%%&&&&&&%&%%%%&&%&&&& 776077747720671 H3
BTB07-067 F 64 &&%%%%%%%%%%%%%%%%%&&&&&&&&&&&%&%%%%&&&&%&& 600000377720751 H3
BTB07-320 F 82 &&&&&&&&&&&&%&&&&&&%&&&&&&&&%%%&%%%%&&&&&&& 777737577420771 H3
BTB09-374 F 79 &&%%%%%%%%&&&&&&&&&&&&&&&&&&&&%&%%%%&&&&&&& 600377777720771 H3
BTB09-435 F 98 &&&&&&&&&&%%%%%%%%%%%%%%&%%%%&%&%%%%&&&&&&& 777400004120771 H3
BTB99-379 M 55 &&&&&&&&&&&&%&&&&&&&&&%%&&&&&&%&%%%%&&&&&&& 777737747720771 H3
S96-202 M 82 &%&%%%%%%&&&&&&%%&&&&&%%&%%%%%%&%%%%&&&%&&& 500771744020731 H3
BTB00-127 M 89 %%%%%%%%%%%%%%%%%%%%%%%%&&&&%%%&%%%%&&&%&&& 000000007420731 H4
BTB05-475 M 85 &&%&&&&&&&&&&&&&&&&&%%%%&&&&&&&&%%%%&&&%&&% 677777607760730 LAM
BTB04-450 M 83 &&&&&&&&&&&&&&&%%&%&&&%&%%%%%%&&%%%%&&&&&&& 777771350060771 T
BTB05-005 F 61 &&&&&&%%%%%%%%%%%%&&%&&&&&&&&&&&%%%%&&&%&&& 770000677760731 T
BTB98-539 M 77 &&&&&&%%%%%%%%%%%%&&%%%%&&&&&&&&%%%%&&&%&&& 770000607760731 T
BTB00-056 F 76 &&&&&&&&&&&&&&&&&&&&&&%%&&&&&&&&%%%%&%%%%&& 777777747760411 T1
BTB00-059 M 83 &&&&&&&&&&&&&&&&%&&&&&%%&&&&&&&&%%%%&%%&&&& 777775747760471 T1
BTB01-392 M 72 &&&&&&&&&&&%%%%%%%%%%%%%%%&&&&&&%%%%&&&%%&& 777600001760711 T1
BTB05-487 M 87 %%%%%%%%%%%%%%%%%%%%&&&&&&%&&&&&%%%%&&&&&&& 000000176760771 T1
BTB07-129 F 93 &&&%&&%&&&&&&&&&&&&&&&&&&&&&&&&&%%%%&&&%&&& 733777777760731 T1
BTB07-182 M 84 &&%&&&&&&&&&&&&&&&&&&&&&&&&%&&&&%%%%%&&&&&& 677777777360371 T1
BTB07-232 M 83 &&&&&&&&&&&&&&&&&&&&&&%&&&&&%%&&%%%%&&&&&&& 777777757460771 T1
BTB08-128 F 75 &&&&&&%&&&&&&&&&&&%%%%&&&&&&&&&&%%%%&&&&&&& 773777037760771 T1
BTB09-443 F 93 %%%%%%%%%%%&&&&&&&&&&%%&&&&&&&&&%%%%&&&&&&& 000177717760771 T1
BTB09-515 M 77 &&&&&&&&&&&&&&%&&&&&&&%&%%%%%%&&%%%%&&&&&&& 777767750060771 T1
BTB98-359 F 80 &&&&&&&&&&&&&&&&&&&&%%%%%&%%%%&&%%%%%&&&&&& 777777602060371 T1
TB
Strains
in
the
Swedish
Epidemic
a
Century
Ago
ONE
|
www.ploson
e.org
8
October
2012
|
Volume
7
|
Issue
10
|
together with their own family (M. bovis), while evolutionary modern PGG2/3 (H, T, LAM) SITs grouped with their own orphans. Almost all of the evolutionary-recent orphan strains appeared at distant (terminal) positions within their respective genotypic families on the tree and not as the central nodes that were essentially defined by spoligotype family prototypes such as SIT50 for H3 and SIT53 for T1 subfamilies. This observation suggests that most of the orphan strains that existed in Sweden a century ago, when TB was highly endemic, probably underwent extinction because they evolved as terminal members within these families that were unfit to proliferate. Indeed, in the Fruchterman-Reingold spoligoforest tree, many PGG2/3 orphans are not linked to other nodes (Figure S2).
IS6110RFLP
Out of 409 isolates, 375 different RFLP patterns were obtained, of which 53 (13.0%) were clustered in 19 RFLP clusters comprising 2–9 isolates per cluster (Figure 2). Most clusters were small and the majority comprised only two individuals (n = 15). The remaining 356 (87.0%) RFLP patterns were unique i.e. the strains did not cluster with other patient strains in the SMI database. A clustering comparison was also made with isolates from patients born in Sweden in 1985 or later. It was found that present day isolates cluster much more frequently. Among 58 isolates from these young Swedes, 16 (27.6%) belonged to a cluster compared to 53/409 (13.0%) among the elderly Swedes (chi2-test p-value 0.0033). All clusters (n = 5) among the young Swedes also contained a foreign born patient with an isolation date prior to the young Swedish born patients.
Discussion
In this study of M. tuberculosis complex isolates from patients born in Sweden before 1945 the majority of the isolates should represent the epidemic strains circulating at the time of the down slope of the epidemic that took place in Sweden the last centuries. The shape of the epidemic curve for TB is the same as that for any other infectious disease, if one adjusts the time scale to allow for the roughly 300-year duration of a TB epidemic [22]. Rates of mortality, morbidity and latent infections increase rapidly, peak successively, and decline at a prolonged, exponentially decelerated pace [22]. In Europe the epidemic started over three centuries ago, and the TB morbidity and mortality began to fall well before introduction of BCG vaccine and effective treatment. It began in the late 16thcentury in England, where it peaked around the 1780s [10]. From England it spread rapidly eastwards, to developing cities on the continent, where the curves peaked in the first decades of the 19thcentury. In Scandinavia, the peaks in mortality were reached in the last decades of the 19thcentury [10], and the incidence declined to 147 per 100.000 population in 1950 and to 1.4 in 2009 in the Swedish-born population. A similar shape of the epidemic curve can be observed in the neighbouring Scandinavian countries. The present TB situation in Sweden is largely influenced by migration as only 11% of the patients diagnosed in 2011 were born in Sweden. Approximately 40% of all isolates typed in 2011 belonged to a cluster [6]. The low rate of isolates clustered by RFLP in the elderly population studied here supports the concept that most isolates represent reactivation cases, without active TB transmission, and thus represent the past epidemic. Indeed, a significant difference in clustering was found when this elderly Swedish population was compared to a young Swedish population.
We found a highly homogenous bacterial population with a domination of the H (41.1%), T (37.7%), and LAM (7.8%)
Table 2. Cont. Isolate Sex Age Spoligotype Description Octal code Spoligotype family BTB98-532 F 85 %&&&&&&&&&&%&&& &&&&&&&&&&&&&&& &&%%%%&&&&&&& 377677777760771 T1 BTB98-547 M 60 &&%%%%%&&&&&&&& &&&&&&&&&&&&&&& &&%%%%&&&&&&& 603777777760771 T1 BTB99-138 F 80 &&&%&&&&&&&&&&& &&&&&&&&&&&&&&& &&%%%%&&&%&%% 737777777760720 T1 BTB99-476 F 85 &&&&&&&&&&&&&&& &&&&&&&&&&&&%&& &&%%%%%&&&&&& 777777777360371 T1 S96-295 F 64 &&&&&&%%%%%%%%% %%%&&%&%%%&&&&& &&%%%%&&&&&&& 770000643760771 T1-RUS2 BTB08-174 F 89 &&&&%&&&&&&&&&& &&&&&&&&%&&&&&& &&%%%%&&&%&&& 757777767760731 T2 BTB07-190 M 77 &&&%%%&&&&&&&&& &&&%&&&%%&%%&%& &&%%%%&%%&&&& 707777344560471 T4-CEU1 BTB99-125 F 61 &&&&%&&&&&&&&&& &&&&&&&%&&&&&&& &&%%%%&&&%%&& 757777757760711 T5 BTB04-418 F 89 &&&&&&&&&&&&&&& &&&&&&&%%&&&&&& %%%%%%&&&&&&& 777777747700771 Unknown BTB09-069 F 80 &&&&%%%%%%%%%%% %%%%%%%%%%%%%%% %%%%%%%%%%&&& 740000000000031 Unknown BTB98-543 M 69 &&&&&&&&%%&&&&& &&&&&&&&&&&&&&& &%%%%%%%%%%%% 776377777740000 Unknown *Spoligotype family designations for o rphan p atterns w ere done manually as Expert-based interpretations using revised SpolDB4 rules. doi:10.1371/jo urnal.pone.0046848.t002
TB Strains in the Swedish Epidemic a Century Ago
families, which belong to the modern Euro-American group of strains and includes all the spoligotype families predominating in the Western world, such as H, LAM, the ill-defined T group, X and S. Only 24 isolates did not belong to modern families. This high prevalence of modern H, T and LAM strains is similar to the prevalence among isolates from patients born before 1950 in Norway, where a total of 40% of 213 isolates belonged to the T family and 35% to the H family [23]. As the Norwegian study, our study only included isolates displaying RFLP patterns not previously present in our database indicating an unlikely recent transmission. Both studies demonstrated that the isolates were of a highly homogenous population (T and H family) with low rate of diversity. The two major spoligotypes in our study were SIT50 of the H3 subfamily, and SIT53 of the T1 subfamily. Although they
have been designated to two different subfamilies, they only differ in one spacer. In addition to the lack of spacers 33–36 in both types SIT50 also lacks spacer 31. SIT53 is the prototype pattern of the T family and is widely spread in the world [11]. The T family defines a polyphyletic group of strains belonging to the Euro-American superlineage. It does not represent a lineage in a strict evolutionary sense since it was defined by default [11]. Although, some subfamilies belonging to the T group have a known phylogeographical specificity, i.e. T-Tuscany, T1-RUS2 (Russia), T2-Uganda, T3-ETH (Ethiopia), T3-OSA (Osaka), T4-CEU1 (Central Europe), T5-Madrid2, the remaining T1 to T5 spoligo-prototypes are not monophyletic [24]. In a molecular analysis of M. tuberculosisDNA from a family of 18th century Hungarians two spoligotypes were identified, corresponding to SIT50 and SIT53
Figure 1. A minimum spanning tree (MST) illustrating possible evolutionary relationships between the Swedish spoligotypes obtained forM. tuberculosiscomplex strains causing the TB epidemic a century ago.(A)SITs alone(B)all patterns (including the orphan patterns) pooled together.The tree connects each genotype based on degree of changes required to go from one allele to another. The structure of the tree is represented by branches (continuous vs. dotted lines) and circles representing each individual pattern. Note that the length of the branches represents the distance between patterns while the complexity of the lines (continuous, black dotted and gray dotted) denotes the number of allele/spacer changes between two patterns: solid lines, 1 or 2 change (thicker ones indicate a single change, while the thinner ones indicate 2 changes); dotted lines, three or more changes (black dotted for 3, and grey dotted for 4 or more changes). The color of the circles is proportional to the number of clinical isolates in our study, illustrating unique isolates (sky blue) versus clustered isolates (blue, 2–5 strains; dark blue, 6–9 strains; bordeaux, 10–19 strains; red, 20 and more). Abbreviation: PGG, Principal Genetic Group. Note that orphan patterns in Fig. 1B are circled in red while patterns marked by an asterisk (*) indicate an strain with an unknown signature (unclassified).
doi:10.1371/journal.pone.0046848.g001
[25]. As in our study SIT53 is found in elderly patients in other parts of the world: in a study from Venezuela, patients with SIT53 had a significantly higher mean age compared to all other patients [26], and in Mexico SIT53 was significantly more prevalent in elderly patients, especially in females [27]. Polymorphism in the direct repeat region in clinical isolates appears to be the result of successive deletions of single discrete direct variant repeats (DVRs) or of multiple contiguous DVRs from a primordial direct repeat region [28]. Thus the lack of spacer block 33–36 in SIT53 is a very
large signature that defines almost all evolutionary modern PGG2/3 M. tuberculosisstrains. It also corresponds to the large sequence polymorphism-based broader ‘‘Euro-American super-lineage’’. Thus it can be seen as the baseline structure among evolutionary-modern M. tuberculosis complex strains (defined by prototype SIT53). From it might have evolved most of other ‘‘modern’’ strains by loss of spacers, including the H family strains. The H baseline therefore is defined by prototype SIT50 of the H3 subfamily (which has a characteristic absence of spacer 31). In addition to the T1 subfamily prototype, SIT53, two more T clade SITs (SIT37 and SIT153) were among the seven predominant SITs. It can be speculated that they separately derived from the prototype SIT53 by loss of spacer 13 (SIT37), or the loss of spacers 5 and 40 (SIT153). However, to know whether such differences are caused by a single or multiple event(s), one would need complementary investigations.
We only found 24 ancestral PGG1 M. tuberculosis strains, including isolates of the Manila and CAS families. EAI2-Manila isolates are more commonly found in Asian countries, such as Indonesia or the Philippines, where they account for high percentages of theM. tuberculosisisolates. Ancestral PGG1 strains are usually linked to migrants in todays Sweden [4,29], indicating they are more recently introduced in Sweden. The majority of the isolates collected in Sweden present in the database at SMI are from foreign born patients. Only three isolates were of the recently emerging Beijing genotype. The majority of patients with drug resistant Beijing strains in Sweden are foreign born [30]. The three patients with Beijing isolates were all diagnosed between 2007 and 2008, i.e. in the later part of the study, at a mean age of 80.7 years. Since the Beijing family is recently introduced in Sweden [30], it is possible that these cases are recent infections and not reactivation of earlier infections.
In the 1930s and 1940s bovine TB was considered to be a significant zoonosis in Europe, including Sweden, andM. boviswas thought to be responsible for more than 50% of cervical lymphadenitis cases in children [31] through milk and dairy products from infected herds. In 1958, Sweden was declared free of bovine TB after an extensive national eradication campaign, by the long term application of a test-and-slaughter policy that removed infected cattle [32]. Thus, the 11M. bovisisolates are all from patients born before 1958, indeed the youngest persons with M. bovis infection were born in 1911. The four SIT691 isolates have previously been shown to contain the RDEU1 deletion [33] which is specific for the clonal complex European 1 (Eu1), the dominantM. boviscomplex isolated from cattle in the Republic of Ireland and the UK.
The fact that patients with isolates of the H, T and LAM families were significantly older at diagnosis, and were born significantly earlier than patients with ‘‘ancient’’ isolates further supports the hypothesis that the closely knit H, T, and LAM isolates represent the old TB epidemic in Sweden, and probably the whole of Scandinavia. In the study from Venezuela, patients with SIT53 were not only older but were more commonly smear negative. The authors draw the conclusion that SIT53 strains may be less virulent and associated with reactivation of past infections in older patients. These associations provoke a number of questions. If SIT53 were really less virulent, why is it still the sixth most common spoligotype in SITVIT2, causing 4% of cases? Could it have been a very common strain in the past, that is now more apt at latency and reactivation than person-to-person transmission, and will its prevalence decrease over time? One could speculate that SIT53 represents a progenitor of the strains causing the epidemic in Sweden and Norway, where mutations
Figure 2. IS6110 Restriction Fragment Length Polymorphism and spoligotyping dendrogram of 409M. tuberculosiscomplex strains from 409 patients born in Sweden before 1945. doi:10.1371/journal.pone.0046848.g002
TB Strains in the Swedish Epidemic a Century Ago