On the Efficiency of the Argentinean Electricity Wholesale Market
Pedro Jobim Alves Ferreira
1May 30,2002
Abstract
1
Introduction
During the last decade several countries undertook serious efforts in order to restructure their electricity markets. Governments recognized that their vertically integrated power companies - frequently responsible for generation, transmission and distribution of electricity - lacked the correct economic incentives in order to generate electricity on an efficient basis. With the divestiture andjor privatization of the utilities, the focus of the restructuring efforts turned to the establishment of competi tive environments for the operation of electricity generators.
Argentina was one of the first countries to conduct a major restructuring of its electricity sector. Most of the state-owned generation, transmission and distribution assets were privatized between March, Hl92 and June, 1994. In addition, a cost-based price determination system for the market was set up at that time. Thermal generators would submit, every six months, bids for the price at which they are willing to supply electricity. A central dispatcher would then order the generators with respect to their bids, lowest to highest, and determine, at each hour, the spot price of the system, roughly equal to the bid of the marginal plant - the last one to be dispatched to satisfy demando The bids cannot exceed 115% of the actual fuel
costs incurred by the generators in their fuel purchases, and can be adjusted within the 6-month period in which they are valid only when fuel prices fiuctuate more than a certain amount. The price determination mechanism of the Argentinean Electricity Market is the major aspect in which the system differs from those implemented elsewhere, notably in Britain and in California, where prices were determined by free supply price and quantity bids submitted, everyday, by generators, for every half hourly (Britain) or hourly (California) period of the next dayl.
The experiences of Britain and California with electricity spot markets have failed, for various and distinct reasons. The British Electricity Pool operated between April, 1990, and March, 2001. Shutdown
lOther stil! operational electricity competitive market places exist in Scandinavia, New Zealand, and Victoria, Australia.
In all these markets the price determination mechanism is based on bids not necessarily tied to generation costs, therefore
of the pool was a consequence of two major forces - the infiuence of the coaI industry lobby and exercise of market power by the major generators. Utilization of coaI for electricity generation purposes in England decreased 50% between 1990 and 1999 due to increasing reliance of generators on natural -gas fired plants. In its justification for redesigning the system, in 19972, the British Government argued that the pool had been discriminating against British coaI as a fuel. The other major cause of the shutdown of the pool was the failure of the regulators in mitigating the various forms of exercise of market power by the two largest generation companies, PowerGen and National Power, which led to observance of consistent1y high pool prices. The market power issues in the British Pool were addressed, among others, by Wolfram (1999), who reported pool price to marginal cost gaps to be inconsistent with competition, and by Wolak and Patrick (2001), who provided evidence on the capacity withdrawal scheme used by the two largest generators, which involved the withdrawal of more efficient units at peak times, in order to shift industry supply to the left and ensure a higher clearance price for the market.
The Californian Market operated during a much shorter period of time, between April 1998 and the Spring of 2001, time at which the system collapsed, after declaration of bankruptcy of the state's largest utility, Pacific Gas & Electric, and the state government decided to take over electricity purchases, paying prices ten times as high as they had been one year before. Soaring natural gas prices, excessive requirements for entry in the generation business, absence of a contract market, and, to a smaller extent, market power issues similar to those observed in Britain, were the major causes of the California disaster, which has been analyzed in a number of papers: Borenstein, Bushnell and Wolak (2002), Puller (2001), Joskowand Kahn (2001), Borenstein (2002), Joskow (2001).
Contrary to the cases of Britain and California, the Argentinean experience in competitive electricity marketplaces has not failed. Wholesale prices decreased by 50% between 1992 and 2001, and total installed generation capacity increased by almost 70% in the same period - most of the entry was of large, efficient combined cycle thermal generators. Large private investments were undertaken also in distribution and
transmission, and the country's developed electricity generation system represented an important alternative source of power for Argentina's neighbor, Brazil, during its electricity crisis in 20013.
This paper will make two elaims regarding the efRciency of the Argentinean Electricity System: a) market power is not observed, even though the market is relatively concentrated;
b) market rules induced entry in such a way that the heterogeneity pattern of generation units with regard to thermal efRciency is now elose to the one predicted by a standard planner problem. This means that the price signals being sent by the market are producing an optimal configuration of supply.
To demonstrate the absence of market power, we will analyze the only period in the short history of the Argentinean Electricity Market in which one could suspect of occurrence of such a practice - in the last months of year 2000, leveI and volatility of market prices raised above historical leveIs. In principIe, one could think that high prices could be the result, for example, of capacity withdrawal by generators, just as Wolak and Patrick argued in the case of Britain. Using hourly data on the operational status of generators, we will show that this is not the case in this episode in Argentina.
To evaluate the efRciency of the supply configuration, we will use Chao's (1983) mode!. A central planner decides the optimal amount of each generation technology to be constructed, given the probability that demand will reach a certain leve!. Technologies differ in two dimensions: variable (fuel) costs, and fixed, capital costs. Base load generators have lower variable (fuel) costs (they are thermodynamically more efRcient), but are capital intensive, and therefore should be constructed only when its expected dispatch rate is large enough. Peak load generators have higher fuel costs (are thermodynamically less efRcient), but are also cheaper to build, and therefore need a smaller dispatch rate to justify their installation. Optimal proportion between the two technologies occur when expected savings on fuel equal extra capital expenditures. We will show that the present configuration of the Argentinean electricity supply approaches the one predicted by such social optimal condition.
3During the second half of 2001, Brazil faced a severe electricity supply shortage due to extremely low rainfall. About 95% of
electricity produced in Brazil comes from hydro-powered generators. Power imports from Argentina helped alleviate the effects
The remain of the paper is organized in four sections. Section 2 describes the Argentinean Electricity Market and discusses its structure, as background for section 3, which analyzes the market power issues. Section 4 analyzes the optimal technology configuration issue, and section 5 conc1udes.
2
The Argentinean Electricity Market
Argentina, like most countries in South America, has undergone substantial changes in its economy in the past ten years. In the macroeconomic arena, the convertibility plan, launched in 1991, brought monetary stability: by 1994, infiation and interest rates had dropped to industrial country leveIs. The country has enjoyed an average growth of GDP of 4,8% between 1991 and 1999. The improvement in the macroeconorruc performance becomes more c1ear when the recent figures are contrasted with the economic indicators of the late 80's, a period in which Argentina suffered reductions on its GDP for three consecutive years and experienced the chaos brought by hyperinfiation4 •
At the micro leveI, the infrastructure of the country suffered a major transformation. The Law of State Reform (Law 23.696), published on August 1989, set the basis of the privatization program to be conducted by the government during the upcoming years. This law specified which state-owned companies would be subject to privatization, and determined the rules and restrictions which applied to foreign capital participation in the processo
Law 24.065, published in 1991, set the basis for the reform ofthe electricity sector and introduced dramatic changes in industry structure. The vertically integrated, state-owned utilities were divested into three main businesses: generation, transportation and distribution. According to the law, generation was considered to
4During the last months of 2001, the macroeconomic performance of the country deteriorated significantly. Strong fiscal
indiscipline of central and provincial governments during the whole convertibility period (1990-2001) ultimately led to the
collapse of the exchange rate rate regime in the first days of 2002, soon after the resignation of President Fernando de la Rúa, in
December, 2001. The country subsequently defaulted on its debt, submerged in a deep financiai system crisis and is now facing
an extremely severe recession. The market developments that we describe are, however, unnafected by the recent deterioration
be a competitive activity, and therefore the state would impose virtually no regulation (neither price, nor entry-related) in this business (apart from an authorization for exploration of natural resources, in the case of hydro generators). Transportation and distribution, on the other hand, were considered activities of"public interest". Tariffs in these two sectors would be regulated by the state, and the distribution companies would have the responsibility of meeting total demand in their operating areas, and would be subject to penalties in case of failure. Entry in these businesses would also be severely regulated. The regulatory role in the distribution and transportation businesses was assigned by law to ENRE -Ente Nacional Regulador de la Electricidad, who would approve the tariffs, grant concessions, and establish penalties.
The establishment of Mercado Eléctrico Mayorista (MEM), a marketplace for wholesale electricity transactions, in august 1992, changed the whole nature of competition in the generation business. Generators, distributors and large consumers - but not transmission firms - are allowed to negotiate electricity in the MEM. They are the so-called MEM agents. Despite the lack of agent status, transmission companies are very important in ensuring competition in generation - they must allow generators to hook up their electricity on a non-discriminatory basis. ENRE is entitled to enforce this practice.
in MEM, being the rest negotiated at the Patagonian system (MEM-SP - 6%) and at other small isolated systems (remaining 1 %) .
Table 1 details the evolution of total installed generation capacity in the Argentinean Electrical Sector (MEM only) since its reform, in 1992. Note that thermal generators are divided in three categories: TV
(turbovapor, or steam turbine), TG (turbogas, or gas turbine) and CC (combined cycle). These three types of generators differ significantly in the way they produce electricity. Steam turbine generators have a boiler where heat from fuel combustion boils water to produce steam, used to rotate the turbine which powers the generator. Gas turbine generators work under the same principIe of aircraft jet engines - a mixture of compressed air and fuel is ignited, and the resulting combustion gas rotates the turbine. Combined cycle generators use the exhaustion emissions of gas turbines to boil water and rotate an additional steam turbine, yielding substantial fuel savings in comparison to the two previous, "open-cycle" processes. On the other hand, combined-cycle plants have higher installation costs.
As mentioned in the introduction, in contrast with most other regions which established competitive marketplaces for electricity, Argentina has opted for a system based on cost declaration rather than on price bidding. Every six months (in J uly and December), the thermal and nuclear generators submit their variable costs of operation valid for the upcoming season - the July declaration is valid for the summer season, which lasts from November to April, and the December declaration is valid for the winter season, which lasts from May to October. To avoid excessive distortions, the generators are allowed, up to an extent, to adjust their cost declarations monthly to account for variations on fuel prices . All generators, including the hydro plants, also declare their total power capacity available for delivery. Hydro generators also declare the value of water stored on their reservoirs.
transmission restrictions are binding, local prices on the system - disconnected from the Buenos Aires price - may develop. Start-up costs of generators and several other technical characteristics of the plants are also reported to Cammesa and are considered in the optimal dispatch processo
There are two basic forms of negotiation of electricity in MEM - the spot market and the contract market. Generators can sign contracts with distributors or large customers, in which schedules of delivery, power leveIs and prices may be freely negotiated between the parts. The amount of electricity negotiated under contracts has grown since the establishment of MEM: in 1992, it represented only 20% of the total amount. By 1995 it had reached 50%. In 2000 the total amount of electricity negotiated under contracts started to decrease again, due to the fact that some large contracts which dated back to the privatization days, included by the government in the privatization package in order to turn key generator assets into more attractive investment opportunities, begim to expire, and were not renewed. In that year, electricity negotiated under contracts reached 45% of the total, and in 2001 it dropped to 38%.
Electricity not negotiated under contracts is commercialized in the spot market - that is, at the price determined by the marginal firm of the system at each hour of operation - the system marginal price. On valley hours and weekends, this price - adjusted by the proper generator nodal factors5 -represents the bulk of the compensation to the generators negotiating their power in the spot market. The actual price received by the generators for their service during business days, in non-valley hours (from 6 a.m. to 11 p.m.) is actually larger due to the so-called capacity charge - a US$ 10 / MWh fee which is added to the cost of the marginal turbine, designed to help generators cover fixed costs. Generators are also paid for provision of ancillary services to the system6 , and there's an additional capacity charge to thermal generators which is based on the difference between total dispatch of the generator on the given year and the simulated dispatch
5Nodal factors arise because of transmission restrictions. In case of congestion, generators located on the "exporter" branch
of the network actualJy "see" a lower price than that of the market - they have smalJer than one nodal factors. Inversely,
generators located on the "import" branch of the network have their price adjusted by a higher than one nodal factor.
6 For example, some generators are responsible for provision and maintenance of the frequency of the system in their areas
that would occur on an extra dry year. Peak load generators are rarely dispatched on wet years, but may be required to produce more power in case of low rainfall conditions. The amount of the charge is again of US$ 10 / MWh , and these payments are netted out of the regular capacity charges to which the generator is entitled.
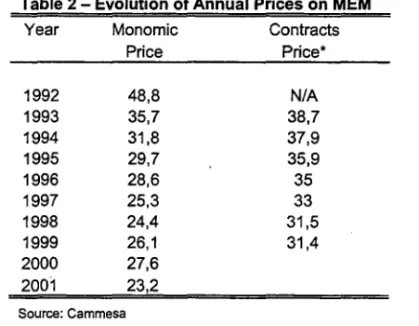
Table 2 details the evolution of the mean prices in these two markets. Note that, on average, electricity is traded at a significantly higher price at the contract market than at the spot market7.
It is important to note that even though the electricity itself may be negotiàted at either the spot price or at some contract price, all the dispatch occurs on a least-cost declaration basis. That is, the dispatcher activates the most efficient generators that will be capable of meeting the demand at each hour, regardless of the existence of contracts. Therefore, if a generator that has, by contract, an obligation of delivering electricity to a customer is not dispatched at a certain hour, it must then use the spot market to buy electricity in order to fulfill its obligation.
Fuel cost declarations are subject to verification ançl cannot exceed 115% of a "reference" price established by Cammesa - generators must submit to the dispatcher, on a regular basis, their actual contracts of fuel purchasing. For plants which operate with natural gas, the reference prices are local, that is, they depend on where the plant is located .. Cammesa uses as reference prices the ones established by ENARGAS, the natural gas industry regulatory body, on a quarterly basis. For plants which operate with fuel oil or gas oil, the reference price is based on monthly quotes of these commodities in the New York market. The reference price for mineral coaI is the observed in San Nicolas, the location of the single plant which operates with this fuel. The great majority of the thermal generated electricity comes from combustíon of natural gas (during the winter, some plants switch to utilization of heavier fuels, because residential oonsumers have priority on natural gas using for heating purposes). In 2001, 93% of total thermal electricity was generated by combustion of natural gas (92% in 2000, 88% in 1999 and 86% in 1998).
7 Again this is a consequence of the contracts established at privatizations times, which were designed to be attractive to
2.1 Market Structure
Despite the facts that both the number of generator business units and total installed capacity have increased substantially since privatization and deregulation, in 1992, (see table 1 and graph 1) it cannot be said, looking only at standard horizontal concentration measures, that the structure of the Argentinean Market resulted competitive. Three major energy business groups entered the Argentinean market at the time of the privatization. These groups were Endesa, a Spanish group with heavy presence in the European power markets; AES, a major American electricity operator; and Gener, one of the most important Chilean economic groups. These groups have taken over, respectively, Central Costanera, Central San Nicolás
and Central Puerto, the largest business units in which SEGBA (Servidos Electricos dei Gran Buenos Aires, the former integrated utility which was responsible for electricity supply ofthe Buenos Aires area) was divested. A total of 19 generation business units were privatized between 1992 and 1994. Endesa, Gener and
AES also acquired the control of some of these other business units, and other important business groups have acquired smaller generators. The state retained the two nuclear units of Atucha and Embalse, and three large hydroelectric plants - two of them are Binational ventures, Yadreta with Paraguay and Salto Grande with Uruguay.
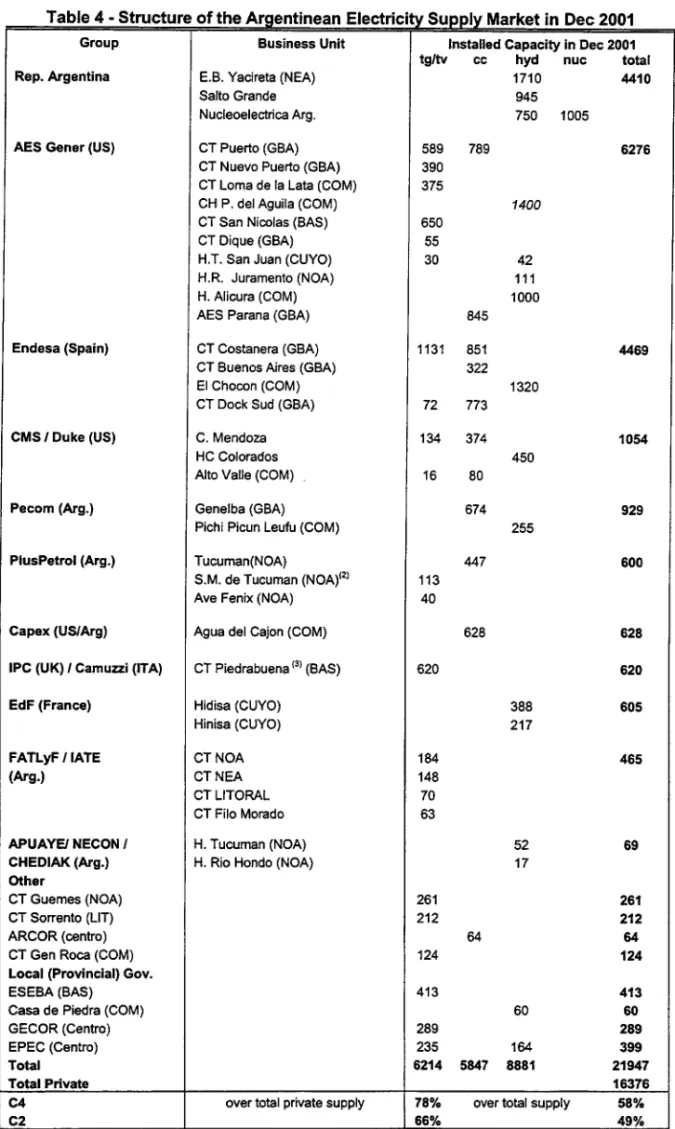
Table 38 depicts the structure of the market in the end of year 2000. The share of the four and two largest groups (excluding the government), considering total supply, respectively of 49% and 36%, shows that this market could be considered moderately concentrated in the end of 2000. Concentration increased dramatically in the very last days of 20009, when AES Corporation acquired the assets of Gener. AES
Gener became the most important private business group in the Argentinean market. After this merger and the conclusion of the new plants AES Parana and Dock Sud, the market share of the two largest groups evolved to 49%, and of the four largest groups, to 58% (see table 4). This structure is quite comparable,
8 Between parenthesis, in the group column, the original nationality of the controlling group is indicated. In the business
unit column, the parenthesis refers to the region of the country where plant is located, as follows: GBA - Gran Buenos Aires,
to, say, the Californian electricity industry structure in 1999, when Pacific Gas & Electric and Southern California Edison together had a 43% share of installed capacitylO (C4 was 63%). It remains, however, distant from the British duopoly benchmark - PowerGen and National Power had, together, 85% of total installed capacity of the British market at the time of deregulation, in 1990.
It should be said that several of the business units listed on tables 3 and 4 have multiple shareholders. Also, some of the controlling business groups also hold stakes at business units controlled by other groups. Besides, business units enjoy considerable management independence. It was not until 2000 that Endesa,
for instance, decided to centralize some management activities of the several units it controls in Central Costanera. Therefore the concentration indexes are only indicative of the actual concentration the market is subject to.
3
Market Power Issues in the Argentinean Electricity Generation
Industry
The simple fact that the price determination mechanism in the Argentinean electricity system is cost-based, rather than free-bid based, by itself prevents, to a large extent, the occurrence of generator market power in its most natural form, that is, coordination among generators leading to bid prices - and consequently system prices - substantially above variable costs of production. This is one of the problems which caused, for example, the shutdown of the British Electricity Pool. As already pointed out, in the Argentinean system, generators are not free to choose their bids - they cannot exceed 115% of their actual fuel costs, which are to be reported Cammesa. Bids are valid for six months and cannot be changed unless unexpected fiuctuations on fuel prices occur, in what case Cammesa may agree on generators changing their bids.
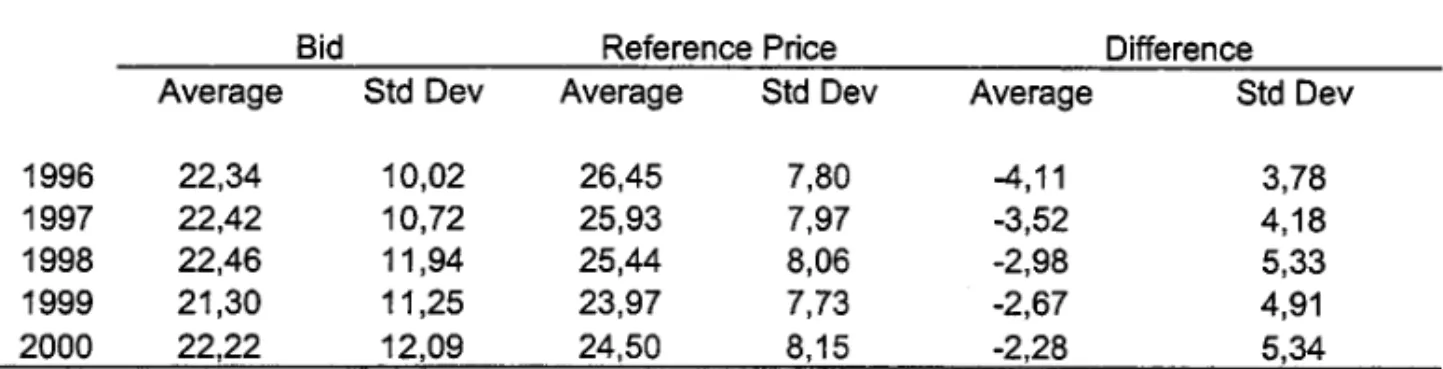
It turns out that bids are, on average, substantially lower than reference prices of natural gas - See tablell 10 See Borenstein et alli (2002).
11 I focus on natural gas bids since this fuel has been respansible for more than 90% af thermal electricity generatian in recent
6. That is, generators seem to not take advantage even of the 15% margin they are permitted above fuel costs. There are at least four reasons why this phenomenon occurs: First, bids stay active for a long period. This severely mitigates chances of success of any potential agreement generators may reach on boosting up bid prices together, for the incentive to break the agreement is greatly increased - being a sole high bidder might mean displacement of dispatch for six months, too long a time to be affordable for any player in this business. Second, actual natural gas transaction prices between generators and gas distribution utilities are not necessarily conducted at reference prices disclosed by ENARGAS. The reference prices are maximum prices to be followed on these transactions - therefore it may be the case that generators bid lower than reference prices because they may actually have reached better terms with the utilities12 . A third reason why bids are smaller than reference prices is related to the nature of gas supply contracts: as pointed out by NERA (1998), they are usually take-or-pay contracts. In such contracts, generators pay for a certain fixed supply of natural gas, and they are charged for this amount whether they use it to produce electricity or noto This means that, once the contract is into play, generators' opportunity cost becomes the cost of disposing out of the unused gas - and not the price of the gas itself - because unused gas cannot be stored in reasonable quantities.
The last reason why bids tend to be smaller than gas prices is due to the structure of generator compen-sation. The capacity charge of US$ 10 / MWh is added to the price determined by the marginal turbine in a total of 85 non valley hourly periods during the week. That is, during 50% of the time (a week has 168 hours) generators have an extra incentive to be dispatched. Therefore they are willing to partially sacrifice their bids, as the capacity charge may more than compensate it. Between 1996 and 2000 difference between bids and reference prices has diminished, perhaps suggesting that one or more of these effects is becoming weaker.
Spot prices in any given hour are then to be picked among the span of (already depressed by the
mentioned affects) bids submitted by the generators every six months. Therefore we should in principIe expect to see zero price to marginal cost differences in this market basically alI the time. But this happens to be untrue. We have obtained hourly information on prices and on the identity of the marginal generators from Cammesa. Graph 2 (figures on table 5) plots the monthly average values of price to marginal cost gaps in percentage terms - (P-MC)jP - between January 1996 and October 2000. The graph also plots the proportion of periods in the month in which price is actually equal to marginal cost. It is very clear, as expected, that these series are negatively correlated.
So why is it the case that price is not equal to marginal cost in this market in all periods, and not only on the proportion indicated on graph 2? The basic reason for appearance of positive - and negative - differences between prices and marginal costs is because there are special circumstances under which price becomes disconnected to the variable costs of the marginal turbine. There are basically three different situations in which this disconnection takes place. The first circumstance arises in the event of approach of a considerable probability of system failure, due to large scale failures in the transmission grid, sudden loss of system load,
or short circuits in important parts of the network. Sometimes these events are associated with adverse atmospheric conditions (tornados) or criminal (terrorist) actions. In this case, price is automatically raised to one of four fixed values, depending on the (increasing) likelihood of a failure: US$ 120, US$, 170, US$ 240, or US$ 1500 j MWh. Between 1996 and 2000, 98 such periods were observed (among 8760
*
5=
43,800 possible - a proportion of 0,2%
only).to long start-up times they require, in case they are actually needed in the peak hour dispatch, they must be already spinning - even though they may stay disconnected of the system. And therefore system price should refiect this.
Finally, there were months in which average price to marginal cost difference was negative - December 1999, for instance. This is due to another "distortion" ofthe system, the so-called forced generation. This represents the third circumstance under which the spot price may depart from marginal cost. Sometimes the presence of a generator in the system is demanded by a specific consumer, or by technical reasons (maintenance of frequency, for example). In this cases the dispatcher commands their permanence on the system, but they are not entitled to market price compensation - they get their own variable costs instead. In case actual market price is lower than their variable costs, the difference can become negative. This distortion is relatively infrequent, but has been growing the past years.
On average, it can be said that the magnitude of these three effects is relatively low - average price to marginal cost gap in the 58-month period of graph 2 is only 4,5%. This is a fairly small figure when compared to the two-digit figures reported by Wolfram (1999) - 25% - and by Borenstein et alii (2002) - 35% - in their analysis of the British and Californian markets, respectively. It is true that when the regular capacity charge is accounted for, average mark-up in the period rises to 18% - but still - contrary to the aforementioned markets - the reasons why positive price to marginal cost differences arise are totally disconnected with occurrence of market power. Indeed one could hardly worry about market power issues given the sole piece of evidence of price to marginal cost differences.
Complementing the information oftable 7(b), graph 3(e) shows that October was the month in which prices reached the highest average leveIs on peak hours.
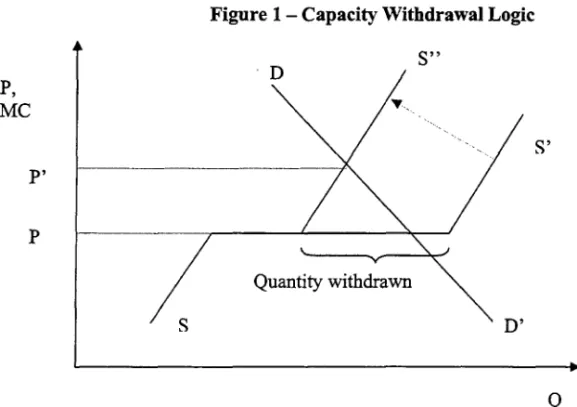
As argued previously, market rules in Argentina prevent, to a great extent, generators from bidding too much in excess of actual fuel costs, what eliminates one of firms' traditional weapons for the exercise of market power. Rules do not, however, explicitly prevent generators from using an alternative weapon -capacity withdrawal of more efficient units in order to shift industry supply to the left and induce a higher equilibrium price for supply and demando Wolak and Patrick (2001), for instance, argue that this was generators's preferred weapon in their efforts to achieve higher profitability.
Therefore, in principIe, a possible explanation for the events ofthe second half of 2000 would be withdrawal of capacity by generators. We will show that this was not the case. We will first dismiss this possibility, and then alternative explanations for the events will be discussed.
3.1 Why the Events of Late 2000 Were Not a Result of Capacity Withdrawal
Profitability of the withdrawal strategy requires that generators attempting it have two basic characteristics: first, generators must be large, in order to induce a large displacement of the supply curve to the left and raise the price significantly. Second, in order to maximize effectiveness of the withdrawal strategy, generators must have two different technologies at their disposal. Withdrawal of the most efficient generator, at the same time that the less efficient generator delivers power at maximum capacity increases the likelihood that the next machine to be called upon by the dispatcher has a larger variable cost declaration, inducing a higher clearance price for the market than the alternative strategy (withdrawal of the less efficient machines conjugated with more efficient machine at full delivery). That is, we should observe a reversed pattern in the utilization of the machines - heavier utilization of less efficient machines - if withdrawal of capacity is the reason for the price hikes in late 2000.
slightIy Iess than 2000 MW of installed capacity (Costanera had 851 MW in combined cycle capacity, and 1130 MW in steam turbine capacity; Puerto had 789 MW in combined cycle capacity and 980 MW in steam turbine capacity, including the Nuevo Puerto site), and represented together about 19% of the market installed capacity. They are both Iocated in the Buenos Aires area, therefore are subject to reIativeIy few transmission restrictions.
There is one further reason that turns Puerto and Costanera into agents specially tempted to take advantage of their size in order to increase profitability. Their old contracts with major Buenos Aires area eIectricity retaiIers Edenor and Edesur (priced at US$ 38 / MWh) , whi.ch had been effective since privatization times, expired on May, 2000 (Puerto) and March, 2000 (Costanera). Without the hedge provided by these contracts, dependence of profitabiIity on spot prices increased significantIy.
TabIe 8(a) summarizes the operational status of Puerto and Costanerals turbines13 in the criticaI peak hours on the months of October, November and December 2000, for the periods in which each of the machines' nodal prices reached at Ieast US$ 25 / MWh - far above their variable costs, which were on the vicinity of US$ 21 / MWh for the steam turbines and US$ 16 /MWh for the combined cycles. These were, therefore, periods in which all these units should have been delivering power.
The combined cycle (CC) of Central Costanera, for example, was deIivering power in 76% of the 50 hourly criticaI periods it saw prices higher than US$ 25 / MWh. In all the other periods it was under programmed unavailability, that is, it was unavailable due to pre-scheduIed maintenance reasons. Costanera's steam turbines, on the other hand, were producing (either at market prices, variabIe costs-forced generation, or in the process of starting up) during a proportion of periods which varies between 44 and 74%. During the majority of the other periods they were either with status of forced unavailalYility or available, but not producing. Forced unavailability means that the unit is unavailable for reasons other than programmed maintenance. Thermal turbines are subject to unexpected failed starts, and require maintenance sessions which are not aIways predictabIe. Therefore a status of forced unavailability does not necessarily mean
that the unit is being deliberately withdrawn by the operator as an attempt to force prices up. A status of availability without production when prices are superior to US$ 25 would seem strange - as we said these prices are superior to their variable costs and therefore, if they were not unavailable for maintenance, they should have been in principIe producing power. Cammesa is not a generator-only club (all classes of MEM agents have equal stakes at it), and therefore it is would be difficult to conceive that Cammesa were deliberately not calling units upon dispatch according to the least cost rule, in order, for instance, to benefit certain generators by forcing prices up. We then opt to consider that generator dispatch at periods under this status was, for a restriction of some reason, considered uneconomical.
For Central Puertols combined cycle the rate of production added to programmed unavailability is 77% during the 127 periods in which the unit 'saw' prices higher than US$ 25. It is true that some of Puerto's less efficient units delivered more power than the combined cycle. But the combined cycle was in a period of programmed maintenance, as can bee seen from the high proportion of scheduled maintenance periods in the corresponding column. This means that some of the forced unavailability periods might have been periods of extended maintenance, not scheduled ex-ante but which turned out necessary - this combined cycle unit had been in commercial operation for less than six months at that time. Moreover, some of the less efficient units had a higher forced unavailability rate than the combined cycle (TV #1 and Nuevo Puerto TV #1), which is inconsistent with the withdrawal scheme.
prices we would need a disproportional amount of forced unavailability of these two combined cycles to have taken place - instead, regular maintenance stops seem to have contributed to the problem. Moreover, the less efficient units of the two generators have a significant amount of their power delivered, in those periods, under forced generation! This means they are NOT taking advantage of the high market prices during a significant part of the time they were observed.
Thus,we feel relatively comfortable to dismiss market power as a possible source ofthe high prices observed in the last months of 2000. We now discuss some other pieces of evidence which help explain the price hikes of late 2000.
We mentioned that, between January 1996 and December, 2000,98 periods in which prices refiected high probabilities of system collapse were recorded. In October, 2000 - the month in which price to marginal cost gaps reached 30%, and average price leveIs reached US$ 80 / MWh in peak hours, 25 such periods (more than 25% of the total) were registered. Moreover, the single couple of periods in MEM's history in which price reached US$ 1500 / MWh - the leveI associated with the highest programmed probability range of failure - were registered in October. In December, 2000, 14 periods of high failure probability occurred. Both these months had a higher number of such periods than any of the years 1996 to 1999. As mentioned, these events are associated with sudden failures of generators, transformer stations or appearance of heavy transmission restrictions. Some atypical operation conditions can help explain why the occurrence of such stressful periods increased 50 much in these months.
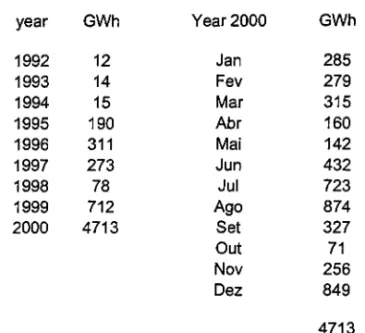
First, in 2000, exports, mainly directed to Brazil and Uruguay, were at least 6 times as high as in previous years (see table 9), reaching 6% of total electricity production - in previous years they never exceeded 1%. They were concentrated in the last months ofthe year, in particular in August and December. Exports tend to increase price leveIs, because part of the supply becomes unavailable to the domestic market.
Second, throughout alI the year of 2000, and, most importantly, in the last third of the year, the nuclear,
Between September and December the utilization of the plants were, respectively, 46%, 34%, 58% and 19%. These units have total installed capacity of 1005 MW (about 5% of system capacity in 2000), and, as they are supposed to operate most of the time, their absence requires the dispatch of other units as base load, and of older, less efficient and less reliable units as peak machines. Both Cammesa and Central Costanera
recognize, in their 2000 annual reports, that this was one of the reasons which most contributed to the price hikes of late 2000.
Third, the occurrence of several periods of disconnection between price and marginal cost due to high likelihood of system failure in 2000 was reflected in the severity index of the system in 2000. This index is the ratio between non-supplied electricity and total annual demando In 2000 this index reached a record of 22,66*10-5 . In previous years the index had been 13,38*10-5 (1997),3,17*10-5 (1998), and 10,85*10-5
(1999).
We do not intend to offer a complete explanation of why price standard deviation increased so much in the second half of 2000. It seems that operational problems, unavailability of base load generators, and increase of exports all had contributed to it. Our basic objective was to disrniss market power as one of possible explanations for the late 2000 events.
4
The Optimal Pattern af Electricity Supply
We reported substantial entry in the Argentinean electricity market during the years which followed deregu-lation. If entry occurred, it is likely that it seemed profitable for potential entrants. An important empirical question lies in the evaluation of the desirability of the entry that occurred, from the social point of view.
the optimal capacities of each technology to be installed. However, electricity production technologies do exhibit variation in these two dimensions. Hydroelectric power technology, for instance, is extremely capital intensive, but its variable costs of operation are basically restricted to maintenance costs, since it uses no fuel. Nuclear power plants are also very capital intensive, and have relatively low fuel costs. On conventional thermal generation, as already mentioned, gas turbine technology is less capital intensive but also requires more fuel to generate the same amount of electricity than a combined cycle plant of the same size.
Chao (1983) develops a simple, static model which formalizes this intuitive trade-off faced by a central planner ofthe electricity sector. We will reproduce his derivation and discuss the optimality condition which determines the optimal proportion of technologies to be installed. We will then use this condition and several pieces of data to evaluate the efficiency of the Argentinean Electricity Market with respect to its supply structure.
4.1 Chao's Model
Chao considers a single pricing period of length B. Power demand in this period, D, is assumed to be a continuous function of price, P, time, t, and a measurable function of the outcome of a random event,
e
En
(the sample set). This stochastic"demand is represented by D(P). Expected energy demand is then De(P)
= BE{D(P)leJ, where
EU
is the expectancy operator.Gross benefit of electricity consumption is denoted by U(q,e), or simply U(q), where q stands for elec-tricity demando This represents the total consumer surplus plus elecelec-tricity bills, for the residential sector, or gross output, for the industrial sector.
Production costs - Chao assumes that there are n technologies with capacity cost ki and operating cost
Ci, for i
=
1, ... , n, respectively. Technologies are ranked in ascending order by operating cost. IfYi
is the installed capacity of technology i, then the total capacity cost is lセ]ャ@kiYi.
Yi can be written as
r
Y'
Yi(Y;)
=
lo
Yi(z)dzi. (1 )whereYi(Z) is a random variable distributed between
°
and 1 with mean ai. That is, capacity oftechnology i consists of a continuum of generating units, each of them with the same availability factor ai.System operation is based on pre specified dispatch order of technologies from 1 to n. This is actually the basic method through which Cammesa, for instance, determines the dispatch order of thermal turbines in the Argentinean Electricity System. Capacity configuration Zi E
Rn
is defined in this order, as follows:Zi
=
(YI, ... , Y;, 0, ... 0) for i=
1, ... , n and Zo=
(O, ... , O). (2)Correspondingly, total available capacity of technologies 1, ... , i is denoted by
i
Zi
=
2:Y;.
(3)j=l
Power supply cannot exceed total capacity. Therefore power actually supplied by technologies 1, ... , i is given by
Q(P, Zi)
=
min{D(P),Zi}
for i=
1, ...,n.
(4)Therefore the expected amount of energy supplied by technology i is given by
(5)
Then total expected operating cost can be written
n
2:
eGiE{ Q(P, Zi) - Q(P, Zi-1)}. (6)i=l
Outage Costs - Since generating units may be unavailable, and demand is random, it is possible, for some realizations of the shock
ç,
that demand cannot be meto Actual magnitude of the outage costs depends onthe specific rationing scheme used during the shortage period. Chao uses a constant marginal outage cost specification, the simplest and most convenient functional form:
S(x, y)
=
b(x - y) for x S; y. (7)where xis supply , y is energy demand and bis a constant. Outage cost is very important to determination of the optimal capacity leveI, as it will become clear.
The objective of the central planner is to maximize expected social welfare W, by choosing electricity price P and capacity leveIs Y1 , .•• , Yn :
Maximize W
=
gross benefit - capacity cost - operating cost - outage costn n
=
E{U((De(P))} - 2:kill; -2:
BCiE{Q(P,Zi) - Q(P,Zi-1)} - BbE{D(P) - Q(P,Zn)} (8)i=l i=l
4.1.1 Optimal Capacities
Optimal capacities can be determined by differentiating14 social welfare with respect to the capacities
Yl> ... , Yn.To differentiate W in (11) is necessary to find the derivatives of E{Q(P, Zi)}.By differentiating
(4) it turns out that
ôQ(P, Zi)
= {
fli if D(P)>
ti and j S; i;ôlj
-O if D(P)
<
Zi or j>
i.(9)
Assuming the random variables fli, for i
=
1, ... , n to be bounded integrable, the order of differentiation and expectation can be interchanged to obtainôE{Q(P, Zi)}
= {
ôY-J
O
(10)
if j
> i.
Since fli is independent of D(P) and ti, the above conditional expectation can be written as unconditional:
14This procedure assumes capacity leveis for aI! technologies to be positive. Refer to Chao's paper for a justification of this
âE{Q(P, Zi)}
= {
â}j
o
aj Pr{.D(P)
>
Z;} if j ::; i(11)
if j
>
i.Using (11) it is possible to find the optimality conditions equalling the derivatives of W with respect to Y1 , ... , Yn to zero:
âW
セ@
- --ay;
=
O=
-ki+
ai L e(Cj+l - Cj ) Pr{D(P)> Zj}
+
aie(b - Cn) Pr{D(P)> Zn}
for i=
1, ... , n. (12)l j=i
Rewriting (12) for i
=
n,Substituting (13) into (12) and repeating this backward substitution operation, we obtain
P {D- (P)
>
Z-·} = (k;jai) - (ki+r/ai+l) J: • = 1 - 1r , e(Ci+l _ C
i) lor z ... ,n .
(13)
(14)
This is the marginal condition that yields the optimal proportion between technologies i and i
+
1, for i=
1, ... , n - 1. Imagine that an ef fective unit of technology i+
1 (that is, a unit controlled for technologyavailability) is substituted by one of technology i. Multiplying both sides of equation (14) by B(Ci+l - Ci),
we get
(15)
The left hand side are the expected savings on operating costs resulting from such substitution, and the right hand side represent the extra capital costs incurred. Optimal Inix between two given technologies will occur when expected fuel savings coming from substitution of one effective unit of technology i
+
1 by one of technology i exactly equal the extra capital costs involved.4.2 Evaluating the Optimality af the Argentinean Electricity Supply
to invest, without having to discuss and evaluate the details of the price mechanism by itself - as discussed before, the structure of compensation to generators is not simple, it includes two capacity charges and other fees apart from the basic energy cost.
It is important at this moment to look back at table 1 and graph 1 to examine the supply profile of the Argentinean electricity industry. There has been some entry of hydro generators. Most of the difference between the hydro capacity in 1992 and 2001 refers to the progressive entry into operation of the various generating units of Yac:ireta and Piedra dei Aguiia hydro plants. Yac:ireta was a joint entrepreneurship effort of the Argentinean and Paraguayan governments. Its first units were delivered in 1994, and the last groups began operation in 1998. With final installed capacity of 1700 MW, it is the largest generator of the Argentinean system. The first units of Piedra dei Aguila hydro plant were delivered in May 1993, some months before the plant was privatized. Final capacity amounts to 1400 MW. In nuclear power capacity no change was observed, and some exit of older, steam turbines took place.
The biggest action has obviously been on gas turbine and combined cycle generators. At first glance it looks like entry of gas turbines in 1992-97 was followed by scrapping of the same kind of technology during 1998-2001. This is misleading. The apparent exit of gas turbine units can be explained by the way combined cycle plants are constructed. For technical reasons, the most common configuration for combined cycle plants involve two gas and one steam turbines. The gas turbines are usually installed before, enabling the generator to operate in open cycle while the additional steam turbine is being constructed. Most of the gas turbine "exit" during 1998-2001, therefore, actually refers to completion of combined cycles. Sometimes the steam turbine addition takes several years, sometimes it never takes place. For example, one of the first combined cycles of the system, Capexls plant Agua dei Cajón, began open cycle operation in 1993, and only in 1999 was completed. Also Gener planned Loma de Lata plant, built in 1993-94, to ultimately operate as a combined cycle, but it was never completed and today the plant still operates as an open, gas turbine cycle.
missing, in particular regarding beginning of construction). It is apparent that construction of the first combined cycles began right after deregulation took place (MEM was established in August 1992, but privatizations were held between 1992 and 1994, as mentioned). Some of the plants operated during little or no time as an open cycle, like Puerto, Dock Sud and AES Parana. In others, however, the last units were completed years after the first ones - see the cases of Genelba, Buenos Aires, Tucumán and the already mentioned Agua del Cajón. Summing total additions of combined cycles in the period 1992-2001 with the final capacities of the two large hydro plants mentioned, we arrive at 8800 MW (5700+1700+1400), which is roughly equal to the 9000 MW total capacity addition in the same period (from table 1). That is, apart from completion of two governmental projects, entry in the period consisted basically of combined cycles.
Nuclear and hydro plants are usuaIly the first to be dispatched. Hydro plants have very low, almost zero variable costs, and nuclear plants, have relatively low fuel costs. Therefore, in almost any electricity system in which they are present - Argentina is no exception here - nuclear and hydro plants represent the bulk of base load generation. In the cost-based Argentinean market, the thermal plants are then progressively called upon dispatch based on their relative efficiency. The incumbent steam and gas turbines which were active on the Argentinean market in 1992 had thermal efficiencies in the 2900 - 4500 Kcal/MWh range. Modem combined cycles which began to be constructed right after deregulation are much more efficient, working on the 1400-1600 Kcal/MWh range. A 1500 kcal/MWh combined cycle requires roughly half the fuel a 3000 Kcal/MWh generator needs to deliver the same amount of power. Therefore, upon their completion, combined cycle generators were incorporated into the base load group generators, displacing older steam and gas turbines to the peak load group and leading to scrapping of the oldest ones.
According to equation (15), social desirability of the displacement which took place would depend on fuel
prices, variability of demand, availability of plants, and capital costs.
nuclear and combined cycle effective capacities. I have hourly data on system load for the years 1997-2000
- therefore we can estimate the term Pr{D(P)
>
Zi} using the number of periods (hours) in which load exceeded effective baseload capacity. That is,{ -(P) Z-.}
=
Number of hours in which load>
Effective Baseload CapacityPr D
>
t 8760Technology 2, Z2,will be represented by modem gas turbines, which are the state of the art, peak load, alternative to combined cycle. As the exercise will be conducted for every year, parameter
e
is equal to the number of hours in a year, 8760.Availabilities - Hydro electricity production in Argentina is usually far below the nominal capacity of hydro plants. Between 1997 and 2000 total hydro production fiuctuated around 35-40% of maximum which could be generated with total installed capacity (table 11), except for years 1996 and 1999 which were extra dry years15. Nuclear plant utilization is much higher, but recently dropped from the 80-85% range due to increased maintenance periods, especially in 2000. For these two types of plants we will use Table 6
availabilities for purposes of calculating effective baseload capacity. Combined cycles are designed to operate almost on a permanent basis. Their availability rates vary in the 85-95% range. The exercise will be in principIe conducted with a 85% assumption for availability of combined cycles.
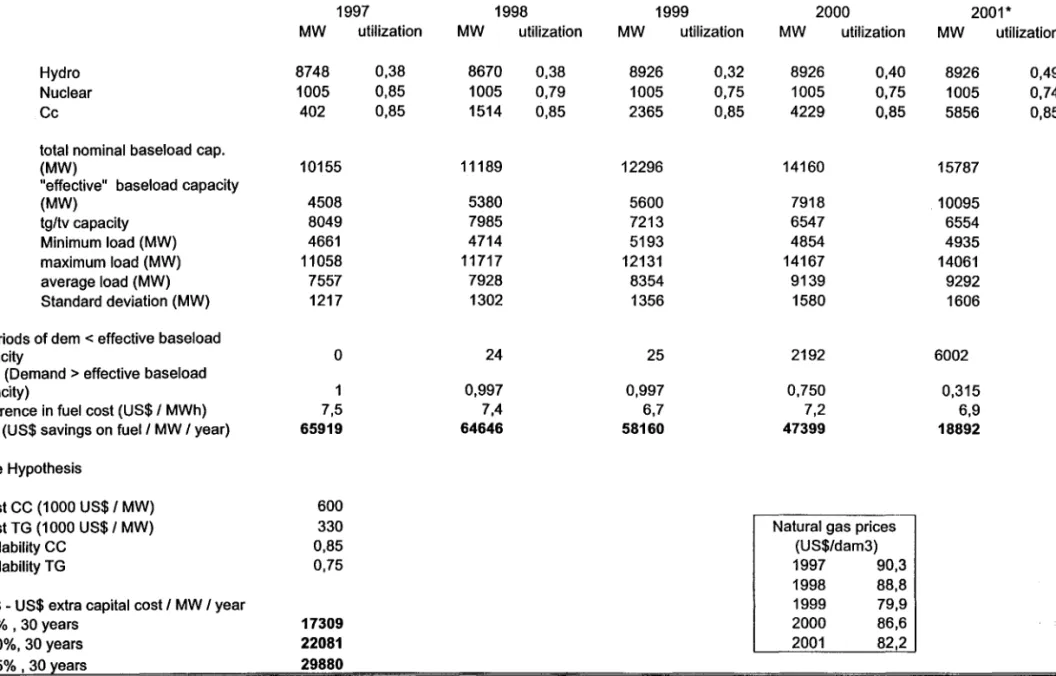
Savings on fuel costs - We are evaluating the social desirability of the massive combined cycle entry which took place in Argentina following deregulation. That is, we want to check whether, given the pattern of demand variability, fuel and capital costs, and effective baseload capacity, if the amount of entry as combined cycle was efficient. We will take hydro entry as given, and compare the two sides of the equation for combined and open cycle technology. We will use natural gas reference prices of ENARGAS in the Buenos Aires area as fuel prices. To estimate the difference on variable costs, we will suppose a 1500 Kcal/MWh combined cycle against a 2200 Kcal/MWh gas turbine - this is the average efficiency of the modern open cycle turbines which constituted the first units of the today completed combined cycles. As the results on table 8 show,
15Hydro utilization is base on end of year installed capacity. Therefore it represents a lower bound on the actual utilization
these hypotheses yield savings around US$ 7 per MWh generated.
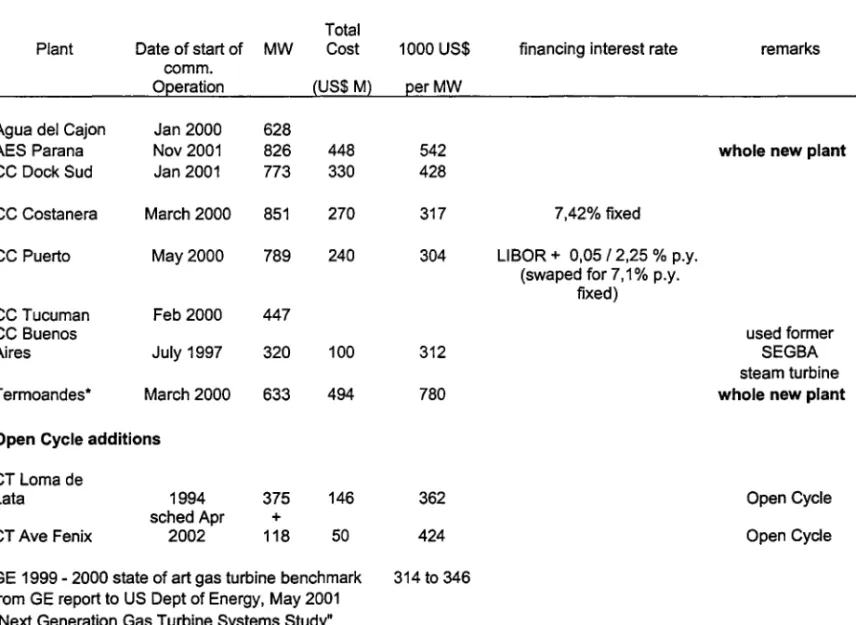
Physical Capital Costs - Combined cycle construction costs depend substantially on whether the plant was built on a new, empty site or took advantage of refurbished, previously installed older equipment. Table 13 summarizes the available information on combined cycles constructed in Argentina in the analyzed period.
Buenos Aires, Puerto and Costanera combined cycles all were erected on or near sites where the companies held older generation facilities. For instance, one of the turbines of Central Buenos Aires is a refurbished generator of SEGBA, part of the assets purchased by Endesa at the time of privatization. On the other hand, AES Parana and Termoandes16 were completely new plants, and made little or no use of refurbished
equipment. It shows up on their costs per installed MW, on the US$ 500-800 range, far higher than the US$ 300 range of the other generators. Therefore we will use US$ 600 / MW as the basic price for new combined cycles. As we will analyze the 1997-2001 period, and since the construction of these last two, new plants were initiated at that time, this will be our capital cost benchmark for the period17 . Note that capital costs are plugged into equation (15) in annualized formo
For the capital costs of open cycles we will use the benchmark value reported by General Electric (2001) for state of the art GE gas turbines in the period 1998-99, which is around US$ 330 / MW . This value is reasonably consistent with the most recent open cycle additions on the Argentinean market, also reported on table 8. Thermal availability of gas turbines will be considered slightly lower than that of combined cycles (75% instead of 85%), because gas turbines, which operate on a interrnittent basis, are usually required to be started a higher number of times per year than combined cycles, what demands more periods of maintenance.
Interest Rates - Cost of Capital- We were able to obtain cost of capital information for two of the combined cycle projects, those of Puerto and Costanera, projects which had their implementation started
16Geographically located in the Argentinean province of Salta, but disconnected from the Argentinean electricity network,
Termoandes' production is directed exc1usively to the Chilean market. It was inc1uded in the table as a benchmark comparison
for capital costs.
17 Conversations with industry experts confirmed that US$ 600 / MW is still (2002) a good estimate of capacity costs for new
combined cyc1e generators. Barreiro and Cortinas (2000) use the value US$ 580 / MW in a combined cycle project evaluation
in 1996. The loans were taken from various international financiaI institutions, at costs in the range 7.0-7.5 per year, as shown in table 7. The right hand side of equation (15) is obviously very sensitive to the interest rate used - therefore we present results using interest rates of 7, 10 and 15% per year.
4.3 Results
Table 12(a) shows our basic results for evaluation of equation (15). Note that for 2000 we used 0,75 for nuclear availability instead of the actual 0,65 in the year, as this is more compatible with regular maintenance hours for the two nuclear plants. As we do not have the hourly load data for 2001, we used the 2000 load distribution shifted by the (small) change in overall production between the two years - in 2000 total electricity production amounted to 79,960 GWh, and in 2001, to 81,300 GWh.
It is clear that with the initial configuration of the demand and the inefficiency of the incumbent steam and gas turbines there was a large space to be preempted by new, efficient combined cycles. Demand pattern of 1997 was such that baseload generators could not be solely responsible for demand satisfaction even at valley hours - minimum load registered was 4661 MW, and effective baseload capacity amounted to 4508 MW. That is, the social benefits of addition of an extra unit of baseload / combined cycle capacity would be immense, because on average that extra unit would be required to operate all 8760 hours of the year. Actually, expected savings on fuel when upgrading a modern 2200 KCal / MWh gas turbine unit to a 1500 KCal / MWh combined cycle , given 1997 natural gas prices, would amount to almost US$ 66,000 / MW / year18 . This value is larger than the extra costs of capital a combined cycle represents when compared to a simple gas turbine - as can be seen at the bottom of table 12(a), this extra cost is in the range of US$ 17,000 to 29,000 per MW per year, depending on the discount rate chosen (capacity life was fixed at 30 years, a standard procedure for this type of equipment). That is, in 1997 the "signal" sent by equation (15) is clearly one for heavy entry of new combined cycles.
18Note that actual fuel savings would be more than the double of this value if comparison is made to the incumbent, old steam
and gas turbines, wtih, say, efliciency of 3000 KCal / MWh. We are establishing modern gas turbines as the basic alternative,
The machines were on their way. In 1998 and 1999 as we know more combined cycles started commercial operation, and baseload capacity surpassed minimum demand by a small amount. The equation was still heavily unbalanced, though, suggesting the combined cycles which were being constructed would be more than welcome from the overall efficiency point of view. In 2000 probability that hourly demand exceeds effective baseload capacity reaches 0,75, and in 2001, it dramatically drops to 0,315. In 2001 we can see that the two sides of the equation are of equal magnitude, suggesting that the correct amount of combined cycle generation had been built already. Of course the comparison is very sensible to the discount rate used, but it is clear that expected savings on fuel would at best surpass extra capital costs by a small amount from 2002on.
An important qualification should be made, though. The model is static, and the calculations reveal the ex-post probability of usage of one additional combined cycle unit on a give year. Investments in generation should obviously take into account future demand growth - if it is expected, for instance, that demand growth will increase in the near future, it would be optimal to have extra baseload capacity, which at present demand leveIs would be considered idle.
AIso, it is interesting to point that some of the plants which were constructed barely faced the trade off between fixed and variable costs discussed - taking advantage of parts of incumbent installations and making usage of refurbished equipment, several combined cycle plants had installation costs below those of new gas turbines (table 7).
On table 12(b) we evaluate a slightly different version of equation (15). Instead of performing an yearly evaluation of both capital and fuel costs, we compare the full (not annualized) difference in capital costs with the discounted sum of yearly proceedings from fuel savings. That is, we evaluate
(16)
hypotheses with regard to the discount rate (the top half of Table 12(b) refers to simulations using a 10% discount rate, the bottom half, to a use of 15% rate), natural gas prices, and dispatch rates. For gas prices we suppose three scenarios, all beginning with US$ 90/dam3 in 1997: prices decreasing 5% per year, constant prices, and prices increasing 5% per year. For the dispatch rates we also consider three possibilities: always 75%, always 50%, and 100% for three years, 75% for one year, and 50% from then on. This pattern is similar to the actual path followed by combined cycle estimated dispatch rate between 1997 and 200l.
At 10% discount rate, only at the most adverse scenario (decreasing gas prices and 50% dispatch) fuel savings proceedings from combined cyele installation are smaller than the extra capital costs they imply. Of course at 15% the benefits are considerably smaller and equation becomes more balanced. But we believe 10% is a eloser approximation of the opportunity cost of capital for Argentinean corporations at that time than 15% - see the 7-7,5% p.y. loans they were able to contract.
There is one more calculation we should perform in order to show that entry of combined cycles was
Overall, our results show that the private, decentralized entry of combined cycles which was observed in the Argentinean electricity market between 1997 and 2001 was very consistent with the investment decisions which would be taken by a central planner responsible for choosing the supply pattem, if we assume, for instance, that the hydroelectricity potential of the country is exhausted, or it that remaining hydro generator possible additions would be unfeasible due to excessive capital or electricity transportation costs.
5
Conclusion
We have analyzed two essential aspects regarding the efficiency of the Argentinean Electricity Market. We have seen that it is relatively insulated from market power, even though its concentration measures are comparable to markets where market power has proven to be a problem - Britain and California, for instance. We have also shown that price signals sent to the generators induced entry of efficient, modem combined cycle technology, and as a result the pattem of electricity supply approaches the one predicted by a standard, central planner problem, in which the planner is faced with a trade off between variable and fixed costs.
The natural question which arises from such conclusions is very clear: what are the design and theoretical features of the Argentinean System that drives its superior performance in comparison with other markets? It seems obvious that the freeze-on-bids system coupled with fixed capacity charge plays a prominent role
in such resulto A proper address of this issue should receive high priority in the electricity markets research agenda.
References
[2] Borenstein, S., Bushnell, J. and Wolak, F. (2002)- " Measuring Market Power in California's Restructured Wholesale Electricity Market", University of California Working Paper, February.
[3] Borenstein, S. (2002) - "The Trouble With Electricity Markets: Understanding California's Restructur-ing Disaster", Journal of Econornic Perspectives 16 (1), SprRestructur-ing.
[4] Cammesa - Compafiia Administradora deI Mercado Electrico Mayorista - "Procedimientos para la
Pro-gramaci6n de la Operaci6n, el Despacho de Cargas, y el Cálculo de Precios", Versi6n XV, Buenos Aires, 2000.
[5] Cammesa - Compafiia Administradora deI Mercado Electrico Mayorista - "Annual Reports" , 1997, 1998, 1999,2000.
[6] Chao, Hung-po - (1983) "Peak Load Pricing and Capacity Planning with Demand and Supply Uncer-tainty", The Bell Journal of Economics 14 (1), Spring.
[7] FIEL -Fundaci6n de Investigaciones Economicas Latino-Americanas - "La Regulaci6n de la
Competen-cia y de los Servi cios Públicos - Teoría y ExperienCompeten-cia Argentina Reciente", Buenos Aires, 1999.
[8] General Electric (2001) - "Next Generation Gas Turbine Systems", report prepared to the US Depart-ment of Energy.
[9] Green, R. (1998) - "Draining the Pool - The Reform of Electricity Trading in England and Wales", University of Cambridge, rnimeo.
[10] Joskow, P. (2001) - "California's Electricity Crisis", NBER Working Paper
#
8442, August.[11] Joskow, P. and Kahn, E. (2001) - "A Quantitative Analysis of Pricing Behavior in California's Electricity Market During Summer 2000", NBER Working Paper
#
8157, March.[13] Wolak, F. and Patrick, R. (2001)- "The Impact of Market Rules and Market Structure on the Price Determination Process in the England and Wales Electricity Market", NBER Working Paper
#
8248, April.Table 1 -Installed c。セ。」ゥセ@ 「セ@ tセセ・@ of Generation サmセ@
Numberof Year cc
tv
tg Nuclear Hydro Total Generators1992
144
4777
1620
1005
5721
13267
13
1993
144
4777
1680
1005
6384
13990
22
1994
144
4777
2211
1005
7309
15446
27
1995
144
4777
2777
1005
7629
16332
33
1996
144
4777
3033
1005
8230
17189
38
1997
402
4777
3272
1005
8748
18204
40
1998
1514
4777
3208
1005
8670
19174
40
1999
2365
4515
2698
1005
8926
19509
40
2000
4229
4515
2032
1005
8926
20707
39
2001
5856
4515
2039
1005
8926
22341
40
Source: Cammesa
Note: Between 1992 and 1997 the proportion CC I TV I TG is estimated
Table 2 - Evolution of Annual Prices on MEM
Year Monomic Contracts
Price Price*
1992
48,8
N/A1993
35,7
38,7
1994
31,8
37,9
1995
29,7
35,9
1996
28,6
35
1997
25,3
33
1998
24,4
31,5
1999
26,1
31,4
2000
27,6
2001
23,2
Source: Cammesa