1
Toward Convergence? The Brazilian Stock Market Concentration
and the Role of Private Equity in its Diversification
Caio Ramalho1 [email protected]
First Draft: July, 2010
This is a preliminary draft; please do not cite without permission.
Abstract
Using quantitative data obtained from public available database, this paper discusses the difference between of the Brazilian GDP and the Brazilian Stock Exchange industry breakdown. I examined if, and to what extent, the industry breakdowns are similar.
First, I found out that the Stock Exchange industry breakdown is overwhelming different from the GDP, which may present a potential problem to asset allocation and portfolio diversification in Brazil. Second, I identified an important evidence of a convergence between the GDP and the Stock Exchange in the last 9 years. Third, it became clear that the
Privatizations in the late 90’s and IPO market from 2004 to 2008 change the dynamics of the
Brazilian Stock Exchange. And fourth, I identified that Private Equity and Venture Capital industry may play an important role on the portfolio diversification in Brazil.
Keywords: Financial Markets; Stock Markets; Private Equity; Venture Capital; IPO; Brazil
1. Introduction
The financial systems play a key role on the modern economy framework due to facilitating payments, enabling capital accumulation, providing correct allocation and managing risks. As consequence, they are expected to create favorable conditions for savings, investments (choice of how to use savings) and financing decisions (choice of the form of financing).
In the past 15 years the Brazilian economy has experienced several positive transformations after the implementation of the Real plan in 1994. Notwithstanding some financial crisis
worldwide in the late 90’s (e.g. Asia, Mexico) and local financial markets turmoil in the 2002 (i.e. presidential elections) Brazil positioned itself as a strong leading emerging economy among China and India.
Leveraged by the high financial liquidity worldwide, increase in the commodities prices and the strong local economic fundaments, Brazil was able to obtain an investment grade rate which attracted more investments to the local stock market and to the whole economy. In fact, from 2004 to mid-2008 on the Brazilian stock market experienced a long-forgotten initial public offering (IPO) season that introduced new industries to investors and leverage the stock market capitalization to over 100% of the GDP size.
1
2 Figure 1: Local Stock Market Capitalization as % of GDP in Brazil
Source: IPEADATA/BM&Bovespa/Author’s analysis
The private equity and venture capital (PE/VC) industry was responsible for one third of IPOs that happened in Brazil from 2004 to 2008.
2. Literature Review
Since the early modern portfolio theory introduced by the seminal work of Markowitz (1952) the stock market index has been in the center of the debate concerning risk premium and portfolio diversification.
According to Wurgler (1999), the financial markets, including the stock markets, improve capital allocation efficiency, and as noted by Tabner (2007) the stock market index is important to both active and passive investors. As consequence, it is expected that inefficient portfolio diversification due to index concentration that doesn’t accurately reflects the real economy environment may negatively impact the portfolio allocation.
Figure 2: Risk Diversification
Source: Lopes and Furtado (2006)
Roll (1992) reached the conclusion that levels of concentration in national market indices are positively associated with the volatility of returns in those indices. Although, Tabner (2007)
3 Regarding the improvement of the stock markets dynamics, privatization has also a positive impact on stock markets development due to new shares issues, increase of liquidity and decrease of institutional risks (Boutchkova and Megginson, 2000; Perotti and van Oijen, 2001; Bortolotti et al, 2002; Laeven and Perotti, 2002; Naceur, Boubakri and Ghazouani, 2009). In addition, according to Martin, Sunley and Turner (2002) AIM in UK (1995), Nouveau Marché in France (1996), Neuer Markt in Germany (1997) and Nuovo Mercato in Spain (1999) were the exit routes for PE/VC-backed companies in Europe in the 90’s. According to Ramalho (2010), BM&FBovespa was the exit route for PE/VC-backed companies in Brazil from 2004 to 2008.
3. Sample and Methodology
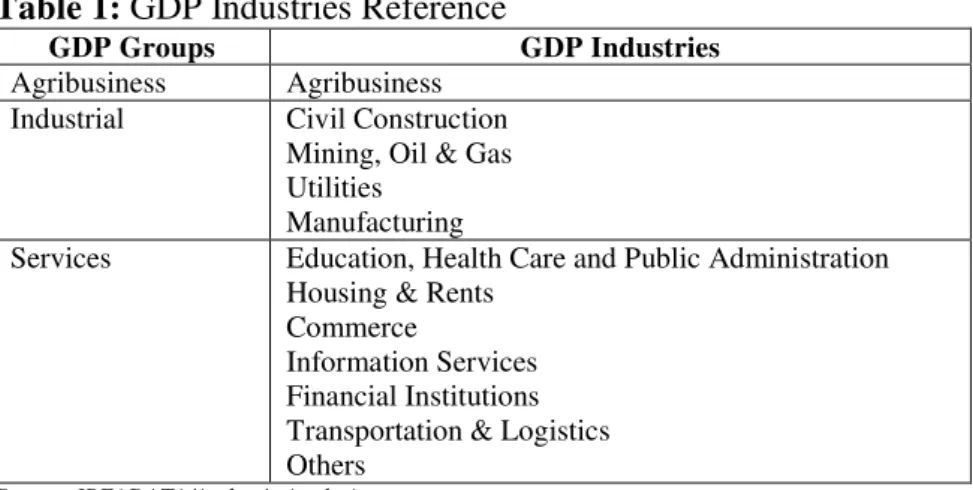
I conducted an empirical research based on public available data about the Brazilian GDP and the local stock market, in addition to the information about the Brazilian PE/VC portfolio companies on Ramalho (2010). I used the official and public available information for GDP on the Institute for Applied Economic Research (IPEA) public database, IPEADATA. The Brazilian GDP is divided in 3 groups that totalize 12 industries.
Table 1: GDP Industries Reference
GDP Groups GDP Industries
Agribusiness Agribusiness Industrial Civil Construction
Mining, Oil & Gas Utilities
Manufacturing
Services Education, Health Care and Public Administration Housing & Rents
Commerce
Information Services Financial Institutions Transportation & Logistics Others
Source: IPEADATA/Author’s Analysis
I collected the GDP annual figures in Reais for each industry separately from 1995 to 2009, since the Real plan implementation in 1994 was a significant structural shift in the Brazilian economy. Then I excluded the year of 1995 information due to an adjustment account on the official data in that year regarding a cross-industries adjustment that totalizes 6% of the GDP. Considering the industry breakdown of the GDP in Reais I calculated the weight of each industry from 1996 to 2009 (14 years).
For the Brazilian stock market, I used the public available information on BM&FBovespa’s database (Informe BM&FBovespa) which provided historical data for the Bovespa Index (IBOVESPA) and for the whole Brazilian stock exchange (BM&FBovespa). Created in 1968, IBOVESPA is the main index for the Brazilian stock market and comprises the most liquid shares traded on BM&FBovespa. The public available information for both series starts in December of 2001.
4 December for each year, from 2001 to 2009. Then I classified each one of the companies from IBOVESPA (45 to 59) and from BM&FBovespa (350 to 427) using the GDP industry reference (i.e. 12 industries shown on Table 1). Since the data for IBOVESPA and BM&FBovespa was only available from 2001 to 2009, I only used the GDP information for the same period (9 years).
Table 2: Number of IBOVESPA and BM&FBovespa Shares and Companies
2001 2002 2003 2004 2005 2006 2007 2008 2009
Shares
IBOVESPA 57 56 54 53 57 55 63 66 62
Companies
IBOVESPA 48 48 45 45 48 48 57 59 55
Companies
BM&FBovespa 427 399 369 358 343 350 404 392 385
Source: BM&FBovespa/Author Analysis
For the information about the PE/VC portfolio companies in Brazil in 2008 I used the information provided by Ramalho and Furtado (2008) and Ramalho (2010) which presents a broader industry classification than the one from the GDP. As consequence, I expanded the analysis and comparison between the PE/VC and the stock market as I reclassified the IBOVESPA and BM&FBovespa industries using the PE/VC classification available (i.e. Table 3).
Table 3: PE/VC Industries Reference
PE/VC Industries
IT and Electronics
Industrial Products and Services Construction/Real Estate Communication/Media Energy
Agribusiness Financial Services Biotech
Retail
Food, Beverage and Tobacco Medicine and Beauty Telecom
Transportation Logistics/Distribution Education
Others*
*Entertainment/tourism, sanitation, mining, textiles, holding companies, footwear, security equipment, company incubators, call centers and appliances.
Source: Ramalho (2010)
In addition, I categorized the IPOs as PE/VC-backed or non-PE/VC backed in order to analyze if any the transformation occurred in the Brazilian stock exchange from 2004 to 2009, especially considering the industries breakdown. With these conditions, exclusions and adjustments, first I compared the GDP, IBOVESPA and BM&FBovespa industry breakdown evolution based on the GDP industry classification. Second, I measured the average divergence ratio (ADR) among the GDP, IBOVESPA and BM&FBovespa.
ADR = ∑ |xi – xj| n
where |xi – xj| is the module of the difference between the weight of an industry on each market is been compared (e.g. GDP and IBOVESPA, GDP and BM&FBovespa, and IBOVESPA and BM&FBovespa).
5 4. Main Findings
4.1. Comparing IBOVESPA and BM&FBovespa with the GDP Industry Breakdown
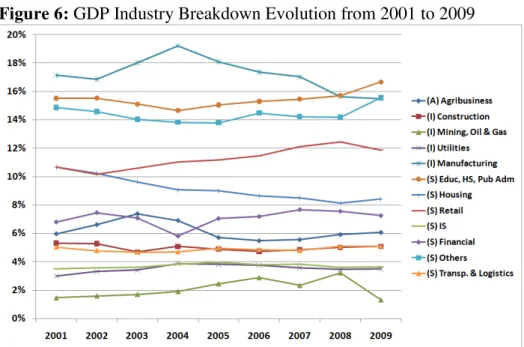
As expected, the Brazilian GDP industry breakdown presents a relatively smooth dynamics throughout the years. From 2001 to 2009 the Agribusiness kept 6% of the GDP and Industrial Services decreased 2p.p. from 27% to 25%, while Services increased from 67% to 69%. However, when we look at BM&FBovespa and IBOVESPA their dynamics are completely
different from the local “real economy” represented by the GDP.
First, the evolution of BM&FBovespa and IBOVESPA from 2001 to 2009 shows a major
change on the groups’ weight on their composition. Services decreased from 54% to 46% on BM&FBovespa as Industrial increased from 46% to 54% over 9 years. Even bigger was the increase of Industrial on the IBOVESPA, from 37% to 54% in the same period.
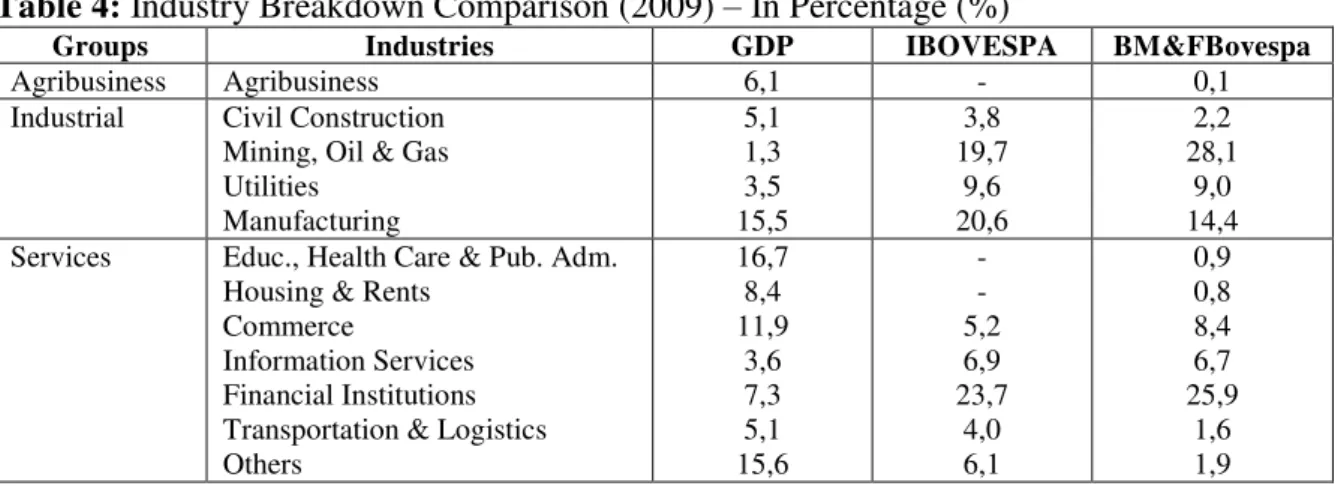
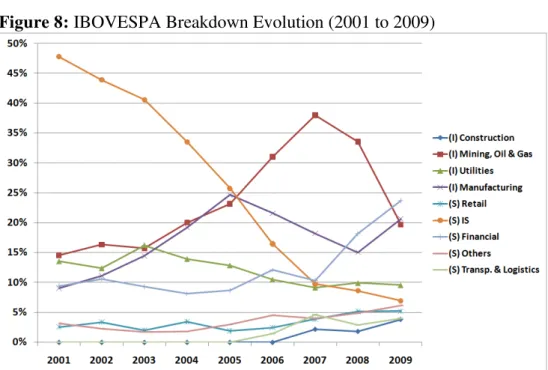
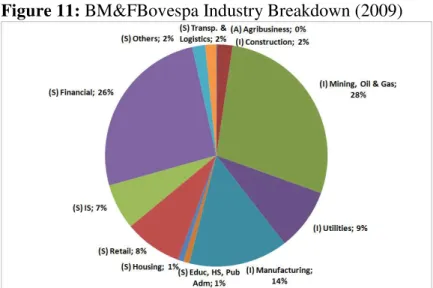
Second, when we look at the industries we can see a more dramatic swift. For example, the Information Services dropped from 48% to 7% (due to privatizations and several take private offers afterwards) and Financial Services jumped from 9% to 24%. When we analyze the whole stock market the Mining, Oil & Gas increased from 18% to 28% its share. Notwithstanding the industry breakdown volatility over the years is very impressive; the difference among the GDP, IBOVESPA and BM&FBovespa industries breakdown is even more astonishing.
Table 4: Industry Breakdown Comparison (2009) – In Percentage (%)
Groups Industries GDP IBOVESPA BM&FBovespa
Agribusiness Agribusiness 6,1 - 0,1
Industrial Civil Construction Mining, Oil & Gas Utilities Manufacturing 5,1 1,3 3,5 15,5 3,8 19,7 9,6 20,6 2,2 28,1 9,0 14,4 Services Educ., Health Care & Pub. Adm.
Housing & Rents Commerce
Information Services Financial Institutions Transportation & Logistics Others 16,7 8,4 11,9 3,6 7,3 5,1 15,6 - - 5,2 6,9 23,7 4,0 6,1 0,9 0,8 8,4 6,7 25,9 1,6 1,9 Source: IPEADATA/BM&FBovespa/Author’s Analysis
6 Figure 3: GDP, IBOVESPA and BM&FBovespa Average Divergence Ratio
Source: IPEADATA/BM&FBovespa/Author’s Analysis
The IPO’s from 2004 to 2008 helped to consolidate that trend initiated by the privatizations. From 2004 to June 2008, 110 IPOs in Brazil raised R$88.5 billion and introduced several new industries to BM&FBovespa and eventually a few to IBOVESPA. Not to mention that a total of 39 companies (from 110 IPOs) had received PE/VC investments prior to their public offering, mostly industries only present in the US and European stock markets until this moment.
Figure 4: Number of IPOs (2004 to 2008)
5 4
12
17
1 2
5
14
47
3
0 5 10 15 20 25 30 35 40 45 50
2004 2005 2006 2007 1H'08
7 Figure 5: Money Raised through IPOs (BRL million)
3,492 1,911 6,619 150 994 3,537 8,754 40,613 7,345 15,041 -5,000 10,000 15,000 20,000 25,000 30,000 35,000 40,000 45,000
2004 2005 2006 2007 1S/08
PE/VC-Backed IPOs Non PE/VC-Backed IPOs Source: BM&FBovespa/Author’s analysis
It is important to note that almost 40% of the investments in portfolio companies were made before 2005, and thus are four or more years old. Considering that the investment vehicles in the PE/VC industry last on average three to five years, it is possible to expect an important flow of new withdrawals over the next few years that may benefit the Brazilian stock market and the whole economy.
Figure 6: Portfolio Companies Breakdown by Investment Year (as of June 30, 2008)
221 48 49 128 74 0 50 100 150 200 250
Before 2005 2005 2006 2007 1H'08
Po rtfo li o I n vestmen ts (U n its)
Source: Ramalho and Furtado (2008)
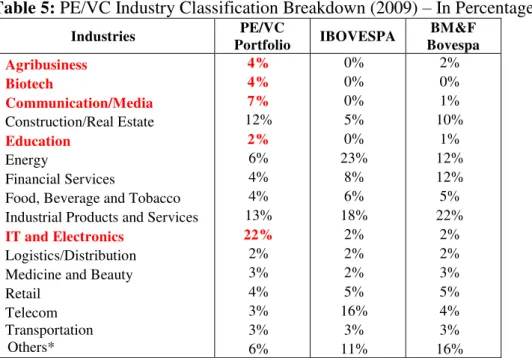
8 Table 5: PE/VC Industry Classification Breakdown (2009) – In Percentage (%)
Industries PE/VC
Portfolio IBOVESPA
BM&F Bovespa Agribusiness Biotech Communication/Media Construction/Real Estate Education Energy Financial Services
Food, Beverage and Tobacco Industrial Products and Services IT and Electronics
Logistics/Distribution Medicine and Beauty Retail Telecom Transportation Others* 4% 4% 7% 12% 2% 6% 4% 4% 13% 22% 2% 3% 4% 3% 3% 6% 0% 0% 0% 5% 0% 23% 8% 6% 18% 2% 2% 2% 5% 16% 3% 11% 2% 0% 1% 10% 1% 12% 12% 5% 22% 2% 2% 3% 5% 4% 3% 16% *Entertainment/tourism, sanitation, mining, textiles, holding companies, footwear, security equipment, company incubators, call centers and appliances.
Source: Ramalho (2010)/BM&FBovespa/Author’s Analysis
5. Conclusions
This paper sheds a light on a distortion in the Brazilian financial markets dynamics. The Brazilian stock exchange industry breakdown is very different from the local GDP. As consequence, the implications for an efficient portfolio allocation can be disastrous as a passive institutional investor that tries to replicate the IBOVESPA may not be able to minimize its risk and an active investor may use a wrong CAPM to measure its risk premium.
Although the divergence between GDP and stock market in Brazil has been decreasing over the past few years, it is far from being adequate. The local PE/VC has been playing an important role on the convergence; however there is still a long path to be walked.
9 References
Bortolotti, B., De Jong, F., Nicodano, G. and Schindele, I. (2002). “Privatization and Stock
Market Liquidity”. CEPR Discussion Paper No. 4449. Available at SSRN:
http://ssrn.com/abstract=569664
Boutchkova, M. and Megginson, W. (2000). “Privatization and the Rise of Global Capital Markets”. Financial Management. Vol. 29(4), pp. 31-76
Laeven, L. and Perotti, E. (2002). “Confidence Building in Emerging Stock Markets”.
Discussion Paper No. 3055, Centre for Economic Policy Research. Available at CEPR: http://www.cepr.org/pubs/dps/DP3055.asp
Lopes, A. and Furtado, C. (2006). “Private Equity na Carteira de Investimentos das Entidades de Previência Privada”. Revista de Contabilidade Financeira. Especial Atuária, pp.108-126.
Markowitz, H. (1952). “Portfolio Selection”. Journal of Finance. Vol.7, pp.77-91.
Martin, R., Sunley, P. and Turner, D. (2002). “Taking Risks in Regions: the Geographical
Anatomy of Europe’s Emerging Venture Capital Market”. Journal of Economic Geography,
pp. 121-150.
Naceur, S., Boubakri, N. and Ghazouani, S. (2009). “Privatization and Financial Market
Development in Emerging Countries: A Comparative Study” Available at SSRN:
http://ssrn.com/abstract=1554528
Perotti, E. and van Oijen, P. (2001). “Privatization, Political Risk and Stock Market
Development in Emerging Economies”. Journal of International Money and Finance. Vol.20,
pp. 43-69.
Ramalho, C. (2010). “Fostering Innovation and Entrepreneurship in Brazil through Private
Equity and Venture Capital Public Policies”. Available at SSRN:
http://ssrn.com/abstract=1607223
Ramalho, C. and Furtado, C. (2008). “Overview of the Brazilian Private Equity and Venture
Capital Industry – December, 2008”. GVcepe Research Report. Available at
www.fgv.br/cepe
Roll, R. (1992). “Industrial Structure and the Comparative Behavior of International Stock Market Indices”. Journal of Finance. Vol. 47(1), pp 3-41.
Tabner, I. (2007). “Benchmark Concentration: Capitalization Weights versus Equal Weights in the FTSE 100 Index”. Available at SSRN: http://ssrn.com/abstract=1026548
10 APPENDIX
Figure 6: GDP Industry Breakdown Evolution from 2001 to 2009
Source: IPEADATA/Author’s Analysis
Figure 7: GDP Industry Breakdown (2009)
11 APPENDIX
Figure 8: IBOVESPA Breakdown Evolution (2001 to 2009)
Source: BM&FBovespa/Author’s Analysis
Figure 9: IBOVESPA Industry Breakdown (2009)
12 APPENDIX
Figure 10: BM&FBovespa Industry Breakdown Evolution from 2001 to 2009
Source: BM&FBovespa/Author’s Analysis
Figure 11: BM&FBovespa Industry Breakdown (2009)