Informational Synergies in Consumer Credit
Martin Hibbeln a, Lars Norden b,∗∗∗∗, Piet Usselmann c, Marc Gürtler c
a
University of Duisburg-Essen, Lotharstraße 65, 47057 Duisburg, Germany
b
Brazilian School of Public and Business Administration, Getulio Vargas Foundation, Praia de Botafogo 190,
22250-900 Rio de Janeiro, Brazil
c
Braunschweig Institute of Technology, Abt-Jerusalem-Straße 7, 38106 Braunschweig, Germany
Abstract
Lenders can tap into multiple sources of private information to assess consumer credit risk but little is known about the informational synergies between these sources. Using unique panel data on checking accounts and credit card accounts from the same customers during 2007-2014, we find that activity measures from both account types contain information beyond credit scores and other controls. Checking accounts display warning indications earlier and more accurately than credit card accounts. We also investigate the consistency of information, the reasons for defaults, and selection effects. The evidence highlights sizeable informational synergies that lenders can use to manage credit relationships.
Key words: Household finance, credit risk, lines of credit, credit cards, consumer bankruptcy
JEL classification: D10, G20, G21
∗ Corresponding author: Lars Norden; Brazilian School of Public and Business Administration (EBAPE), Getulio
Vargas Foundation (FGV), Praia de Botafogo 190, 22250-900 Rio de Janeiro, Brazil. E-mail: lars.norden@fgv.br. Parts of the paper were completed when Martin Hibbeln was visiting Rotterdam School of Management, Erasmus University.
Banks, credit card companies, and retailers apply specific lending technologies in appraising consumer credit that require information production. Lenders gather hard and soft information from public and private sources to assess the quality of their borrowers and the outcome of this assessment is aggregated to a credit score. There is consensus that a combination of different types of information is optimal for credit risk assessment. However, there is little evidence on the extent of synergies between different sources of private information in consumer finance, mainly due to the lack of data (Campbell 2006). Informational synergies affect the access to credit, terms of credit, credit allocation in the economy, and the risk taking of lenders.
We help fill this void by investigating whether activity measures from different credit products lead to informational synergies on the probability of default and credit line usage of consumers. Activity measures such as amplitude or overdrafts from credit products with time-varying exposure reflect private hard information that gives the lender a real time window into the borrower’s cash in- and outflows. Our setting enables us to analyze why consumers default, how much credit they take (unconditional and conditional on default), and how early the lender learns about credit quality deterioration. We compare the account activity measures with traditional credit scores, borrower characteristics, and bank-borrower relationship characteristics, using combined information from checking accounts and credit card accounts from the same customers.
(2010) examine the credit line usage and checking account activity of different borrower types. They show that private hard information from checking accounts is particularly useful for monitoring small businesses and consumers. They also show how this information is used for loan pricing, credit limit management, and account closure decisions. Agarwal et al. (2009) document that credit card customers with close relationships to their bank exhibit lower probabilities of default and have higher credit line usage than non-relationship customers. Similarly, Puri, Rocholl, and Steffen (2013) find that consumers with prior bank relationships exhibit a significantly lower probability of default. Compared to Agarwal et al. (2009) and Puri, Rocholl, and Steffen (2013), in addition to considering the characteristics of prior bank relationships, we also investigate the informational synergies between the dynamic information from different credit products used by the same person. Stango and Zinman (2014) use consumer panel data for checking account activity and overdrafts from 2006 to 2008 to investigate how attention biases affect consumers’ responses to financial shocks. Their analysis differs from ours in several dimensions. They take the consumer’s perspective, consider overdrafts but not authorized lines of credit and/or credit card accounts, and examine attention biases, while we take the lender’s perspective and examine how private hard information from consumers’ checking accounts and credit card accounts can be used to manage credit relationships.
and the default risk of consumer loans, whereas we investigate potential synergies between private information from different credit products used by the same consumer.
Our study further relates to the cross-selling of financial products, which can be beneficial in various ways. For instance, the marketing costs are lower, switching costs for customers are higher, and banks can learn more about their customers’ risk preferences and consumption behavior (e.g., Kamakura et al. 2003). Customers with more valuable information for selling purposes may pay lower prices (e.g., Akçura and Srinivasan 2005). Studies on the cross-selling of financial products have mainly focused on the question of which product a customer is most likely to buy next in order to offer the right product to the right customer at the right time (e.g., Kamakura et al. 1991; Li, Sun and Wilcox 2005; Li, Sun and Montgomery 2011). In our study, the focus is on informational synergies that can be beneficial for credit risk management and customer relationship management.
We base our analysis on a large and unique panel dataset for the 2007-2014 period comprising more than 1.7 million customer-month observations with checking account and credit card observations for every customer. This dataset contains information from all checking accounts and credit card accounts of a large privately owned financial institution in Germany. The setting is ideal to study potential synergies between different sources of private information because universal banking is the dominant form of financial intermediation in Germany and it heavily relies on informational synergies over time and across products (e.g., Allen and Gale 2000; Krahnen and Schmidt 2004). The widespread use and simultaneous presence of consumer checking accounts with lines of credit attached to these accounts1 and credit card accounts enables us to examine informational synergies. Credit cards are widely used in the United States but consumer checking accounts with lines of credit are not common.
1 It is one account that may have a positive or negative balance. The negative balance has to stay below the
We obtain three principal results. First, we show that the activity measures from both credit products contain information beyond traditional credit scores, borrower characteristics, and bank-borrower relationship characteristics. Lenders can use this information for monitoring and screening. Second, we find that account activity measures from checking accounts are more useful regarding additional cross-product information than those from credit cards. The main explanation is that the former reflect cash in- and outflows, while the latter reflect only cash outflows. The benefits of cross-production informational synergies are economically sizeable: Lenders can lower the type I error by around eight percentage points when they consider checking account activity next to credit card account activity, corresponding to a 33% reduction of the type I error. Third, we differentiate between variables that affect the probability of default but not the credit line usage and vice versa to show why and how consumers default. We further document significant selection effects in the estimation of credit line usage at default. We conduct several additional empirical checks and show that our previous results are robust and not the product of particular choices of samples or model specifications.
Our contribution to the literature on household finance and banking is threefold. First, we study the incremental value added of different sources of private information, while earlier studies have examined the value added of private information versus public information. Lenders can take advantage of private information only if the information production is not distorted by incentive problems arising from volume-based compensation schemes, career concerns, etc. (e.g., Berg, Puri and Rocholl 2014; Hertzberg, Liberti and Paravisini 2010). A risk assessment based on multiple sources of private information is less likely to be biased by strategic behavior of the borrower and/or loan officer. It is unlikely that a borrower or loan officer can manage to hide the true credit quality by manipulating the checking account and credit card activity. Understanding of how lenders gather, aggregate, and exploit private information to manage credit risk and their customer relationships is at the core of financial intermediation.
Second, we focus on private hard information, which has been neglected in earlier research due to the lack of comprehensive data. Consumer credit is characterized by a large number of transactions, small amounts, and standardized products and processes. The key products are credit cards, consumer loans, and mortgage lending. Lenders mainly rely on standardized hard information and this reliance is even stronger when consumer debt is securitized (Rajan, Seru, and Vig 2015). Hence, it is important to understand the potential synergies between different sources of private hard information.
The remainder of this paper is organized as follows. In Section 1, we describe the institutional background, the data, and the methodology. In Section 2, we report the results of the analysis of informational synergies. In Section 3, we summarize the findings from further empirical checks and tests of robustness. We conclude in Section 4.
1. Institutional Background, Data, and Methodology
1.1 Institutional background
We consider proprietary data from a large privately owned German financial institution.2 Checking accounts are used for receipts (e.g., salary, rental income, etc.), and expenses (e.g., rent, subscriptions, insurance, consumption expenses). The balance of a checking account can be positive or negative because by default a credit line is attached to it. If the balance is positive, consumers (may) receive a small amount of interest from the bank, and if the balance is negative, consumers have to pay interest to the bank for using the credit line. The credit line is pre-authorized up to a specific limit and can be redeemed at any point in time. Consumers use a checking account to withdraw cash at ATMs, to make payments with debit cards, or use electronic direct debits or paying their bills with electronic wire transfers. It is important that no brokerage is offered by the bank so that we can exclude that checking accounts are used as clearing accounts for the brokerage accounts.
We also consider credit card accounts (Visa credit cards). The balance of an account can be positive or negative. Our dataset comprises two types of credit card accounts, which differ in their redemption schemes. On the one hand, there are accounts with full repayment of the credit card bill every month. This monthly bill is charged on the individual’s checking account on a fixed day per month and there is no interest to be paid. The payment day is one of the first days in
2 We do not know the identity of the account holders. To ensure confidentiality the customer numbers and account
a month for almost all customers. On the other hand, there are accounts that allow the consumer to stretch out the redemption over time and make only minimum repayments per month. These monthly minimum repayments correspond to 5% of the outstanding credit card debt and at least 50 euro. Customers pay interest rates of more than 10% p.a. on the outstanding debt.
Checking accounts and credit card accounts are unsecured credit. Moreover, a consumer can open a credit card (checking) account without having a checking (credit card) account at the same bank. All accounts have an initial line of credit of 1,000 € and consumers may ask for an increase of the limit later on. A negative account balance has to stay within the limit but we also observe overdrafts. Accounts can be overdrawn by using the checking account or the credit card offline, manual approvals by loan officers, or interest debit charged by the bank.
The presence of these credit products is widespread in Europe, Canada, and many Asian countries. In 2012, more than 99.5% of the main payment instruments in Germany were credit transfers, direct debits, electronic cards, and credit cards. The same finding holds for most countries being part of the Committee on Payment and Settlement Systems (CPSS) (Bank for International Settlements, 2013). The setting differs from the U.S. where consumers typically use one account for receipts (a checking account with positive balance) and another account for expenses (a credit card account with negative balance).
same person. This practice is in line with the regulatory rules for retail exposures according to Basel III.
1.2 Data
We base our analysis on dynamic information from checking accounts and credit card accounts. Our proprietary raw data sample comprises 16,849,187 account-months observations. The sample period is from December 2007 to January 2014.
We apply five filter rules on the raw data. First, we choose only customers who have credit cards and checking accounts at the same bank. More than 90% of all customers with checking accounts also have a credit card, but only 22% of all credit card customers also have a checking account at the same bank. This reduces the dataset to 5,958,534 observations. Second, in our baseline analyses, we consider only one credit card and one checking account per customer. Most of the customers with both products have exactly one checking account and one credit card (88%), and about 10% use one credit card and two checking accounts or vice versa, so that we neglect 237,880 observations. For the 12% of customers where we observe more than one checking account or credit card, we focus on the most important account.3 Third, we drop observations with missing data (1,158,501 observations), which is mostly a consequence of a limit equal to zero in the denominator of account activity variables. Fourth, we only consider observations where the subsequent observation period regarding defaults or credit line usage is at least one year,4 which reduces the dataset by 967,795 observations. Fifth, we use only observations until the first default occurs, so that the observed account activity is not influenced
3 We assume that the account with the highest mean cash inflow per month is the most important one because it is
likely that the customer’s salary is paid to this account. For credit card accounts, inflows normally have to equal the outflows; hence, the most important credit card can also be identified using the highest mean inflow. The number of customers where we have to identify the most important account is rather low; hence, the choice of the procedure does not affect our analysis. In a robustness check, we repeat all subsequent analyses with customers who have only one checking account and one credit card. Our results show that the aggregation rule does not affect our results.
4 If the observation period is shorter than the forecasting horizon, the credit risk can be underestimated (Gürtler and
by a previous default of the same account, reducing the dataset by 33,594 observations. We winsorize all variables at the 1%-/99% quantile. The final sample consists of 3,560,764 account-month observations of 46,925 customers.
(Insert Table 1 about here)
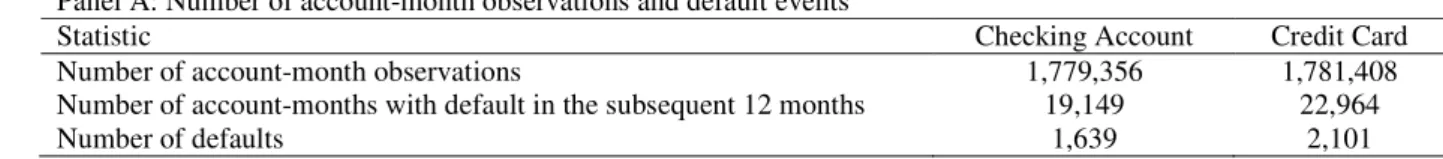
Panel A of Table 1 reports the number of observations and defaults. There are 1,639 and 2,101 defaults at checking accounts and credit cards, respectively. Customers are more frequently in default on credit cards than on checking accounts. This result is not due to differences between customers because the checking accounts and credit cards come from the same customers. Moreover, people can default on multiple accounts or on individual accounts. The reasons for a joint default are bankruptcy or negative credit information from a credit bureau. A default on an individual account can occur if the monthly expenses sufficiently exceed monthly receipts. Similarly, a customer can default on a credit card account. A high credit card balance might lead to an overdraft of the checking account, so that the debit is bounced. A bounced debit does not cause a default on the checking account, but it might do on the credit card account.
Panel B of Table 1 shows that about 50% of the monthly default observations (13,887 observations) are joint defaults of both accounts of the same person, whereas the remaining 50% occur either on the checking account (5,857 observations) or on the credit card account (7,565). These numbers confirm that both cases occur frequently and are therefore relevant for our study.
Panel C of Table 1 reports summary statistics of the main variables. We define the variable
Rating as the logarithm of the probability of default according to the internal rating system of the bank. Because this rating is account specific, different rating systems are used for checking accounts and credit cards (the correlation between the corresponding credit scores per customer is 0.337). The mean Rating for checking accounts is significantly better than for credit card accounts, which is consistent with a lower number of defaults for checking accounts.
of the external limit. To measure the account variation, we use Amplitude as the difference between the maximum and minimum exposure in each month as a percentage of Limit. We observe higher amplitude for checking accounts than for credit card accounts as checking accounts are used for income and expenses. The mean and median of the external limit in euros indicates that most customers choose a higher limit than the initial limit; moreover, most customers choose a similar limit for both products (the correlation between the limit of both accounts is 0.767). Bounced is the average number of bounced debits in the preceding 12 months (per month). In most cases, this number is zero for checking accounts, whereas for credit cards bounced debits can be observed more frequently. Days Usage is the percentage of days with a negative balance in the preceding 12 months. This number is significantly higher for credit cards because for this product we usually observe no credit balance. We see a relatively active use of credit cards since 55% of the days in the preceding 12 months have a negative balance. Similar to
Days Usage, we define Days Overdrafts as the percentage of days with overdrafts in the preceding 12 months. Only a very small percentage of checking accounts exhibit overdrafts.
Moreover, we have information on bank-customer relationship characteristics. Duration
1.3Methodology
We analyze informational synergies on the probability of default (PD), the credit line usage (CLU), and the credit line usage at default (CLUAD) of checking accounts and credit card accounts. We use these variables as dependent variables and the variables described beforehand as explanatory variables.
To estimate the PD of one of these accounts, we first consider the account activity information from the same account. Second, we study the informational content of cross-product information. For this purpose, we estimate the PD of checking accounts based on activity variables from credit card accounts and vice versa. Third, we take account activity from both accounts at the same time to estimate the PD. We follow the same three steps to estimate the
CLU and CLUAD of checking accounts and credit card accounts.5
We define PD as the probability of default of an account within a time horizon of one year. Thus, for a given month t, we define a default variable Defi,t+12 that equals one if a jump to
default is observed at t+ with ∈{1, 2, …, 12 months} for account i, andzero otherwise. Given the explanatory variables Zi,t that can be observed in month t, the estimated PD is:
( )
, 12, : ( i t 1| ,) , .
i t i t i t
PD =P Def + = Z = f Z (1)
The explanatory variables contain account activity variables, which can include information from the particular account only, or we consider cross-product information as well. Furthermore,
Zi,t includes bank-borrower relationship and borrower-specific variables. In addition, we use the
internal credit scores to account for variables that can be observed by the bank but are not available to us (e.g., information from a credit bureau). We integrate the credit score (=PDi,t) of
5 We also estimate the PD and the CLU at default on the full dataset of all 12.4 million account-month observations
the internal rating as Ratingi,t = log(PDi,t). We perform pooled probit regressions and cluster the
standard errors at the customer level.
To estimate the credit line usage (CLU), we choose a time horizon of one year. The CLU of account i in month t+12 can be defined as CLUi,t+12 = Exposurei,t+12/Limiti,t+12. However, we
would have to know the limit in t+12 to calculate the expected exposure in t+12 based on the estimated CLU. Thus, for predicting the credit line usage, we calculate the target variable
CLUi,t+12 as the ratio of the (at time t unknown) exposure in t+12 months and the (known) limit in t: CLUi,t+12 = Exposurei,t+12/Limiti,t. To estimate CLU, we apply:
, 12 , ,
(
CLU
i t+|
X
i t)
=
X
i tβ
E
, (1)where the explanatory variables Xi,t includes account activity with or without cross-product
information, as well as bank-borrower relationship and borrower characteristics. Following Jimenez, Lopez, and Saurina (2009), we add the credit rating (Rating) to equation (1) because it is likely that the CLU depends on the customer’s default risk. To estimate the CLU, we perform ordinary least squares (OLS) regressions with standard errors clustered at the customer level. We refer to this method as CLUall.
We further examine informational synergies regarding the credit line usage at default (CLUAD). We implement different methods to estimate the CLUAD because of possible biases. First, we use CLUall to estimate the CLUAD, but the estimates can be biased because the rating
does not fully capture differences in the credit line usage between defaulters and non-defaulters:
(CLUi,t+12 | Defi,t+12 = 1, Xit) (CLUi,t+12 | Ratingi,t, Xit). Second, we calculate equation (1) on
the subsample of defaulted loans. We call this method CLUDef:6
(
CLUi t, 12+ |Defi t, 12+ =1,Xi t,)
= Xi t,β
E . (2)
Third, we use a Heckman selection model (see Heckman, 1976, 1979) to account for a possible selection bias. We refer to this method as CLUHeckman:
, 12 , 12 , , , ,
(
CLU
i t+|
Def
i t+=
1,
X Z
i t,
i t)
=
X
i tβ δ λ
+
λ(
Z
i tγ
)
E
, (3)where the inverse Mills ratio is determined by a probit regression. Fourth, we consider an endogenous treatment-regression model (see Heckman, 1978, 1979) of the following form (unrestricted control function approach):
, 12 , 12 , , , , 12 , 12 ,
1 , 12 1 , 1 2 , 12 2 , 2
( | , , ) ( )
(1 ) ( ) ( ).
i t i t i t i t i t i t i t i t
h i t i t h i t i t
CLU Def X Z X Def Def X
Def h Z Def h Z
β ν η
δ γ δ γ
+ + + +
+ +
= + +
+ − +
E
(4)
The hazards h1 and h2 are determined by probit regressions of the first stage participation model.
We include interaction terms between Defi,t+12 and all explanatory variables Xi.t to allow for
different intercepts and slopes for defaulters and non-defaulters. We refer to this estimator as
CLUEnd.Treat. The results would be identical to an IV regression if we implemented the restrictions
h1= h2 and = , and if we used a linear probability model instead of a probit model for the
probability of being selected (e.g., Vella and Verbeek 1999).
2. Results
2.1 Defaults
to 1/2014) for all non-defaulted customers that will not default in the next 12 months (Defi,t+12 =
0). Then, we determine the number of defaults in each month and calculate on this basis how often each month must be considered at each event time (τ-24, τ-23, …, τ, …, τ+12) and compute the median of the monthly medians for each event time.
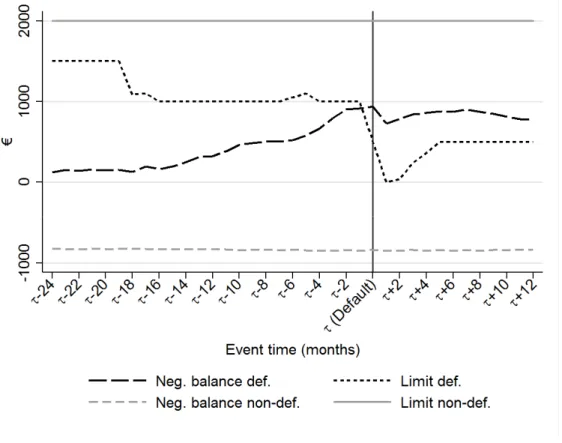
Figure 1 shows both variables for defaulted and non-defaulted checking accounts. On the x-axis, the time relative to the default event at τ is displayed in months, and on the y-axis the median Limit and the median of (-1) x Balance are shown in euros. For defaulted accounts, we see that the negative Balance is already increasing around 14 months before default (analogous to the credit line usage discussed below). The negative Balance is slightly decreasing after default because the Limit at the time of default is often set to zero and no further increase in exposure is possible. Limit is typically reduced to zero in the month of default. Default is often due to overdrafts, which is supported by the observation that Limit approximately equals the negative
Balance one month before default. All findings hold for the 10% and 90% quantiles, as well as for credit card accounts (not reported). For non-defaulted customers, Limit (positive) and Balance
are usually higher. This difference between non-defaulted and defaulted accounts can already be observed 24 months prior to default and increases as the time to default approaches. From Figure 1, we cannot see whether the credit line usage is increasing due to decreasing inflows (e.g., unemployment) or increasing outflows (e.g., higher consumption or unexpected expenses).
(Insert Figure 1 about here)
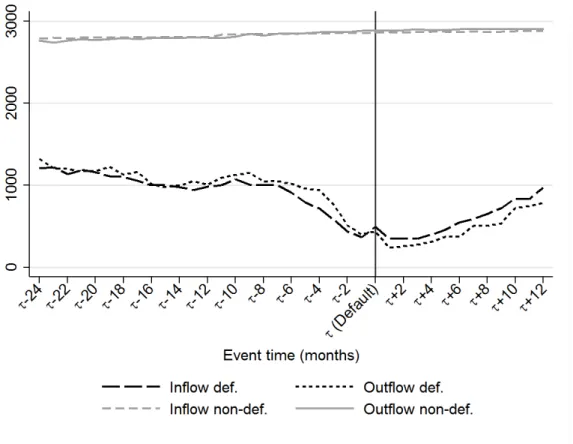
In Figure 2, we show cash inflows and outflows separately for defaulted and non-defaulted checking accounts. The gap between cash inflows and outflows, the Net Inflow, directly leads to the change of Balance shown in Figure 1. These inflows and outflows, as well as the Net Inflow
the outflows are influenced by the customer, while the inflows correspond to the sum of the outflows because of monthly clearing.
(Insert Figure 2 about here)
Figure 2 shows that the inflows and outflows of non-defaulted checking accounts are similar and rather stable, implying that Net Inflow is close to zero. For customers who default, inflows decrease earlier and faster than outflows. This inflow decrease starts about six months before default and continues until default. Outflows, on the other hand, only slightly decrease, but around three months before default, they decrease rapidly. The latter is mainly a consequence of the customers approaching the limit, as shown in Figure 1. The findings indicate that for most customers, a default on a checking account is due to decreasing cash inflows, not increasing cash outflows. Hence, the Net Inflow is negative for defaulted accounts and increases in the months before default; however, at the time of default, the inflows and outflows are almost identical; after default, inflows are even greater than outflows, which is a consequence of customers being constrained by the limit reduction at the time of default.
Building on the studies of Mester, Nakamura, and Renault (2007) and Norden and Weber (2010), we consider limit violations as a predictor for customer defaults. However, unlike earlier studies, we use dynamic private information from different sources at a daily frequency. We observe the number of days with a positive usage of the credit line and with overdrafts in each month. These two numbers are very informative for predicting defaults and hint at substantial informational synergies across different credit products.
In Figure 3, we present the median number of days with positive credit line usage (Panels A1 and B1), as well as the median number of days with overdrafts (Panels A2 and B2) for defaulted and non-defaulted accounts. In Panel A, we present these variables for defaults of checking accounts, whereas Panel B refers to defaults of credit cards.
Panel A1 of Figure 3 shows for checking accounts that the number of days with positive credit line usage is higher for accounts with subsequent default. This difference is visible 24 months prior to default, but the difference increase as default approaches. We also show the number of days with positive credit line usage of credit cards prior to a default of the checking account. This number slightly increases before default too, meaning that cross-product information is informative. Panel A2 indicates that checking account overdrafts strongly increase in the three months prior to default, peaking at the default event. The number of days with overdrafts is much higher for defaulted checking accounts than for non-defaulted accounts, which confirms that overdrafts provide useful early warning indications. Interestingly, the number of days with overdrafts on credit card accounts is also substantially increasing in the period prior to default of checking accounts. Thus, account activity from other credit products is indeed informative for default prediction.
Panel B1 and B2 of Figure 3 show the number of days with positive credit line usage and overdrafts regarding the default events of credit card accounts. The findings for Panel B1 are similar to the defaults of checking accounts (Panel A1). The median number of days with positive usage is lower for defaulted credit card accounts than for non-defaulted accounts. Panel B2 indicates that overdrafts on credit card accounts strongly increase four months prior to default with a peak at default, while increasing overdrafts on checking accounts of the same customers can be observed substantially earlier (Panel A2).
We continue with the analysis of the probability of default within a time horizon of one year. We examine at time t whether a default event will occur in the next year, which means in {t+1,
t+2, …, t+12}. We analyze additional variables that may influence the probability of default (next to Net Inflow, Days Usage, and Days Overdrafts)7 and report the average differences between
7Days Usage and Days Overdrafts are the percentage of days in the preceding 12 months, whereas we present in
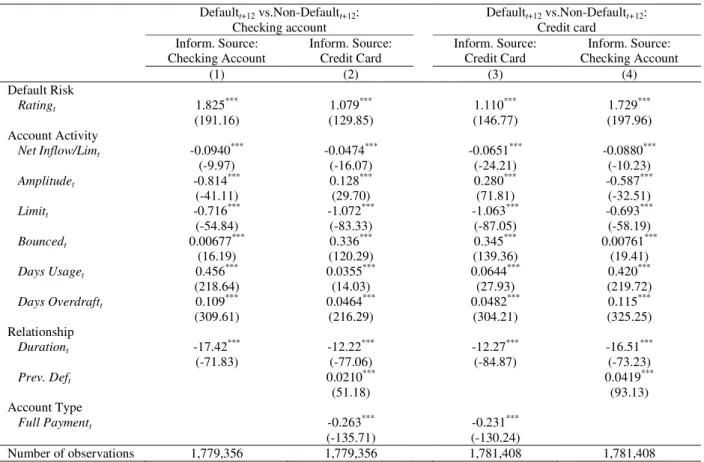
defaults and non-defaults in Table 2. Columns (1) and (2) refer to checking account defaults, whereas columns (3) and (4) refer to credit card account defaults. The results without cross-product information are shown in columns (1) and (3); the results for cross-cross-product information are shown in columns (2) and (4).
(Insert Table 2 about here)
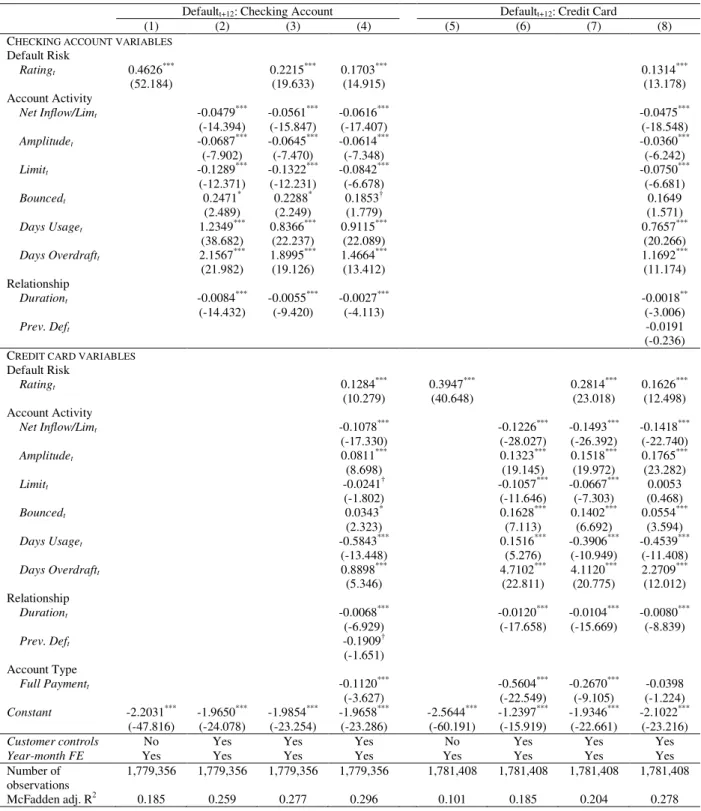
We use multivariate probit regression models to estimate the probability of default.8 The results are reported in Table 3. Columns (1)-(4) show the results for checking account defaults and columns (5)-(8) for credit card defaults. The upper half of the table refers to checking account variables and the lower half to credit card variables. We first discuss checking account defaults. In the probit regression (1), we use Rating as independent variable to predict defaults in the next 12 months, showing that the rating system of the bank is effective. Column (2) confirms that account activity variables are useful early warning indicators for default risk, with the coefficients of all variables being identical to the univariate findings. When the estimation is performed on account activity variables only, we obtain an adjusted R² of 0.232 for checking accounts (not reported), which shows that these activity variables are even more informative than the bank’s current internal rating system. The main findings remain stable if we additionally control for Rating in column (3). The adjusted R² slightly increases when the internal rating of the bank is added, which indicates that there is additional information contained in the rating system beyond our measures of default risk. Column (4) reports the results for cross-product information. The influence of rating, account activity, and bank-customer relationship variables of credit cards on checking account defaults mostly points in the same direction as the impact of the corresponding checking account variables, which means that the information is widely consistent. We find that most of these variables are highly significant. Moreover, the explanatory power is higher if cross-product information is considered.
(Insert Table 3 about here)
Columns (5)-(8) of Table 3 report the results of credit card defaults. The results are similar to checking accounts except for Amplitude, as a higher amplitude on checking accounts is a positive signal but on credit cards it is rather a negative signal, confirming the above univariate results. As
8 We also use logistic and rare events logistic regression models (King and Zeng 2001). The choice of the model
discussed above, a likely reason is that high activity on a credit card is mainly due to consumption, whereas for checking account this could also be due to a high income. Furthermore, regarding cross-product information on credit card defaults, we confirm that the information is consistent (column (8)). The increase in the adjusted R2 from column (7) to column (8) shows that the prediction of credit card defaults can be improved if account activity from checking accounts is considered as well.
We find evidence that banks can achieve substantial informational synergies when they monitor customer account activity for different products. The additional cross-product information helps improve the prediction of defaults beyond traditional credit scores, customer characteristics, and bank-customer relationship characteristics.
2.2 Credit line usage
We now estimate the OLS regression CLUall to examine which variables at time t influence
the credit line usage in t+12 months. Table 4 reports the OLS regression results. As for the PD
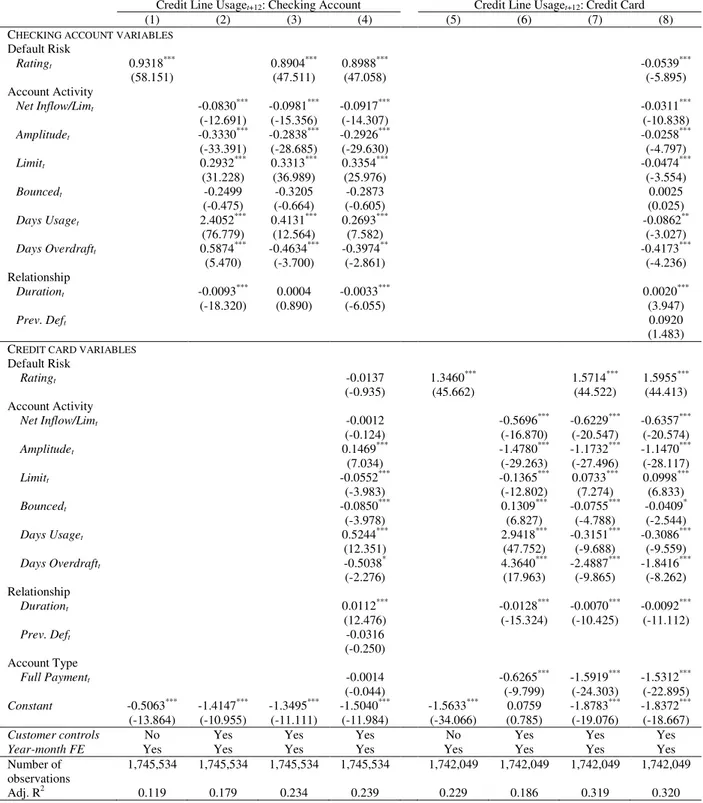
regression, columns (1)-(4) show the findings for checking accounts and columns (5)-(8) the findings for credit cards. Column (1) shows that Rating is not only predictive of future defaults but also of the CLU in 12 months. Similarly, column (2) shows that the account activity variables are informative about the future CLU. We find that CLU is high if Net Inflow is low or more overdrafts are observed. If rating information is included (column (3)), the coefficients of Days Usage and Days Overdrafts are significantly decreased, which is mainly due to a high positive correlation between Rating and Days Usage (ρ = 0.31), as well as Rating and Overdrafts (ρ = 0.54). Customers with a higher credit line usage and more frequent overdrafts have worse ratings, so that this effect is contained in the coefficient of the rating. Adding information from credit cards to the regression in column (4) only slightly improves the estimation of CLU.
Columns (5)-(8) in Table 4 report the results of analyses of credit card defaults. The results are mostly similar to those for checking accounts shown in columns (1)-(4). Cross-product information is not significantly predictive of credit line usage, which is in contrast to the findings on the prediction of default from Table 3.
2.3 Credit line usage at default
Banks have to estimate the credit line usage at default (or the absolute value of exposure at default) for credit risk management and due to regulatory capital requirements. There are several possible approaches to estimate the credit line usage at default, some leading to biased estimates. We consider this problem and propose an approach that leads to unbiased estimates.
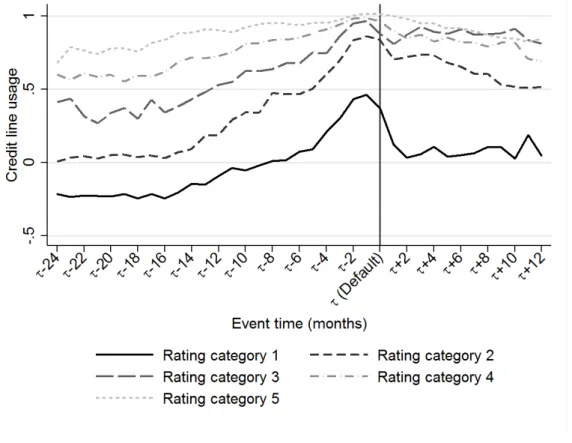
The rating and the default status are key inputs for modeling CLU at default. Figure 4 presents the median CLU for checking accounts between τ-24 and τ+12 by rating. The rating at τ -12 discriminates between high and low CLU prior to default. The better the rating, the lower the
CLU in the period between τ-24 and τ. This indicates that Rating is informative about the CLU at default. Unreported results indicate that the results for credit card accounts are similar.
(Insert Figure 4 about here)
In Table 5 we compare the different methods we described in Section 1.3 to estimate the CLU
at default for checking accounts.
(Insert Table 5 about here)
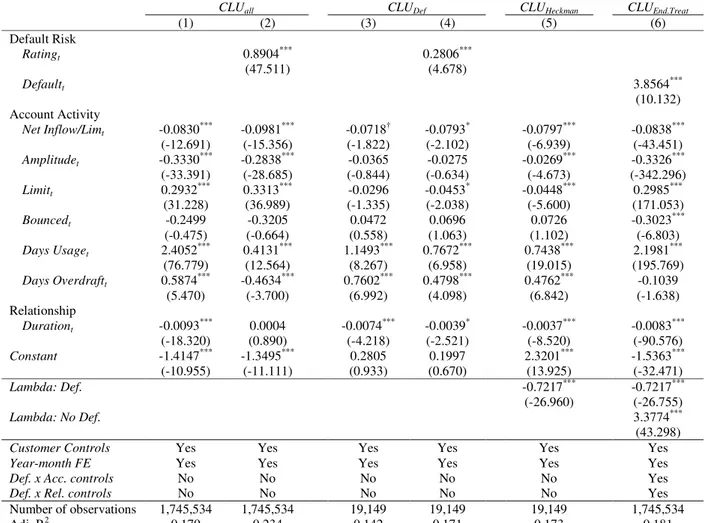
Columns (1) and (2) of Table 5 repeat the results for CLUAll of Table 4 to allow a comparison
to the other methods. Columns (3) and (4) report the results for CLUDef , which is the estimate
almost not affected by Amplitude or Limit, whereas both variables are highly significant in the results for CLUAll. Furthermore, the Rating effect in the CLUDef model is much smaller than for
CLUAll, which means that conditional on default the impact of Rating is smaller. This finding is
consistent with Figure 4, where we see the interdependence between rating categories and CLU. However, comparing the values at τandτ-12, this interdependence becomes weaker at default.
Importantly, the models shown in columns (3) and (4) of Table 5 might suffer from a sample selection bias, as discussed in Section 1.3. The estimator can be biased if there are unobserved effects in the model CLUDef that also influence the likelihood of being in the subsample of
defaults (selection). We therefore show the results from the Heckman selection model CLUHeckman
in column 5 of Table 5. We find evidence that the results of CLUDef (column (3)) are affected by
a sample selection bias as the coefficient of the inverse Mills ratio (lambda) is statistically significant. Interestingly, we observe almost the same coefficients in columns (4) and (5). The reason for this finding is that Rating and the inverse Mills ratios of the Heckman selection model are highly correlated. Thus, unbiased estimates of CLU at default can also be obtained by using a standard OLS regression based on the subsample of defaulted accounts, provided that Rating is considered as a covariate. In contrast, the results of CLUAll and CLUHeckman are different, which
confirms that considering Rating as a covariate in a full sample regression is insufficient to explain the difference between the CLU of defaulted and non-defaulted accounts. Even if CLUAll
does not suffer from the sample selection bias (column (3)), the results confirm that the model is not appropriate to estimate CLU conditional on default (also see equation 3 in Section 1.3).
Furthermore, we examine the differences of CLU for defaulted and non-defaulted accounts with otherwise identical characteristics. We thus report estimation results from the endogenous treatment-regression model CLUEnd.Treat in column (6) in Table 5. Due to the specification of the
CLUEnd.Treat model presented in Section 2.3, the results for the default subsample are identical to
conditional on non-default to conserve space. These coefficients are similar to those in column (1), which implies that the regression model CLUAll provides estimates of CLU of non-defaulting
customers. The difference between the scenarios “CLU at default” versus “CLU at non-default” is represented by the non-reported interaction terms Def. * Acc.-controls and Def. * Rel.-controls; these coefficients can be calculated by subtracting the values of columns (5) and (6). As expected, the high coefficient of Default indicates that CLU is significantly higher for defaulted than for non-defaulted accounts. We find that a higher number of Bounced creditsand Overdrafts
reduces CLU for non-defaulted accounts. One interpretation is that for some customers, Bounced
creditsor Overdrafts have a disciplining effect, so that they react with a reduction in their credit line usage. In contrast, for the subset of defaults, a high number of Bounced and Overdrafts
indicates that their credit line usage is likely to be high at default. There can be a substantial bias if a bank estimates a model of (unconditional) CLU to obtain the (conditional) CLU at default. Instead, a Heckman selection model or endogenous treatment-regression model should be used to achieve unbiased results. Alternatively, a model based on the subsample of defaulted customers could give unbiased estimates if the rating is considered as a control variable.
In addition, we examine the consistency of information from different sources for estimating the CLU at default and whether cross-product information improves the estimate. In Table 6, we report the results for the Heckman selection models with different sources of information. Columns (1) and (2) provide the results for checking accounts, while columns (3) and (4) provide the results for credit cards.
(Insert Table 6 about here)
default for checking accounts, but to higher CLU at default for credit card accounts. A substantially larger fraction of variance can be explained for credit card accounts than for checking accounts (the adjusted R2 is 0.562 vs. 0.173). This is contrary to our results for default prediction, where we find early warning indicators for checking accounts to be more informative. Regarding informational synergies, we find that using information from different accounts can slightly improve the estimate of CLU at default. However, the informational benefit for credit line usage prediction is lower compared to default prediction.
2.4 Screening with cross-product information
Significant informational synergies can be realized by monitoring the activity from different accounts of a customer. We now investigate whether informational synergies can be used to screen potential customers. When someone opens a new account, the bank can gather information about their characteristics but it does not have information about their past account activity. However, in case the person already has a different account at the bank, the bank can observe the past activity on this account and use this source of information for screening. In our dataset, 20% of all customers of the bank have both a checking account and a credit card account. Hence, there are many potential customers with one existing account, for whom this additional source of information could be used for screening. In Table 7, we present the results when we use the account activity variables from credit card accounts and not from checking accounts (and vice versa). This analysis is based on clean cross-product information that can be used for screening.
(Insert Table 7 about here)
2.5 Consistency of information
Figure 5 provides information about the consistency of PD and CLU at default estimates derived from different information sources. In Panel A1, we present the PD estimates for checking accounts, where the estimates are based on the account activity of checking accounts on the one hand and credit card accounts on the other hand. Similarly, in Panel B1 we show PD estimates for credit card accounts. In both cases the correlation between the estimates derived from checking account versus credit card account variables is around 50% (0.558 for checking accounts and 0.540 for credit card accounts). If we analyze the pairwise correlations between individual account activity measures, we find that the correlations are at maximum 0.35 for all variables except for Days Overdraft (0.483) and Limit (0.777). Thus, the account activity of both products potentially provides different informational content.
(Insert Figure 5 about here)
In Panel A2 of Figure 5, we show the estimates of CLU at default for checking accounts derived from account activity on checking accounts versus credit card accounts. The predictions are similar no matter on which source of information the estimates are based, and the correlation between the predicted values equals 0.950. In contrast, for credit card accounts, the correlation between both predictions of CLU at default (see Panel B2) is only 0.514, so that the informational content of both accounts is more likely to differ for this variable.
2.6 Economic and statistical significance of the informational synergies
In the analysis above we document synergies between information from checking and credit card accounts. We show that account activity variables have a significant impact on default predictions and credit line usage (at default) predictions.
additional sources of information? Quantifying the synergies in form of a monetary equivalent is challenging because we would have to make various assumptions about the size and composition of the portfolio, the types of loans and loan terms, the account activity and control variables used in the model, the empirical default rate, the empirical loss given default, and others. We therefore refrain from following this route. Instead, we assess the economic and statistical significance by computing standard measures of prediction accuracy and goodness of fit to assess the economic and statistical significance of the cross-product informational synergies (e.g., Grunert, Norden and Weber, 2005). These measures indicate the economic significance in the sense that we can measure how many false credit decisions a lender can avoid when exploiting cross-product informational synergies. Table 8 reports the accuracy of PD and CLU at default prediction results, which are based on the account activity of checking accounts (column 1), credit card accounts (column 2), and of both accounts (column 3). For the accuracy of default prediction, we report the adjusted McFadden R2, the value of the area under the receiver operating characteristic (ROC), type I errors (predicting no default for consumers that do default) and type II errors (predicting default for consumers that do not default). We calculate the type I and II errors based on binary default/no default-predictions using the empirical default rate in the respective sample as cut-off point. A value of one for the R2 or ROC indicates a perfect prediction. For a random prediction these statistics are R2 = 0 and ROC = 0.5.
(Insert Table 8 about here)
0.845 to 0.892, the type I error decreases from 23.76% to 15.89%, and the type II error decreases from 22.24% to 18.48%. Strikingly, when lenders additionally consider checking account information they can reduce the type I error by around eight percentage points.9 The absolute number of the type I error decreases from 5,096 to 3,408 (minus 1,688), corresponding to a reduction by 33%.10 We explain this strong finding with the fact that changes in consumer income (e.g., due to unemployment) are identifiable in checking accounts, but not in credit card accounts. As shown earlier, warning indications about decreases of cash inflows are critical for the prediction of defaults and credit line usage at default. Third, there is an improvement of all measures when we compare information from checking accounts (column 1) with information from both accounts (column 3) but the benefits are moderate. This finding shows again that checking accounts are more informative about changes in borrower quality than credit card accounts. Fourth, regarding the CLU at default, we find that information from checking accounts and credit cards accounts is useful but there is only a small improvement when cross-product information is considered.
By and large, there are sizeable benefits due to informational synergies. The benefits are highest when lenders consider checking account information next to credit card information.
3. Further empirical checks and robustness tests
3.1 Alternative definition of default
The previous analyses refer to the account level, as stipulated in the Basel III accord and EU Regulation No 575. We now repeat the analysis with default at the customer level. Under this
9 We note that the type I error is significantly more costly than the type II error. The loss of the credit granted to a
consumer who will subsequently default is higher than the loss of the interest income of a rejected loan to a consumer who will subsequently not default.
10 The effect is even stronger for predicting the defaults of checking accounts: lenders can lower the type I error by
definition, a default occurs if at least one account of the customer is in default. To estimate the
PD, we use the variables of both accounts individually or aggregate the variables.11 Table 9 reports the results. Analyses with aggregated variables are shown in columns (1) and (3) and analyses with variables of both individual accounts in columns (2) and (4).
(Insert Table 9 about here)
For the model of a customer default with aggregated customer variables (column (1)), the adjusted R² is lower than for account-specific default models that were based on cross-product information (adj. R² of 0.191 versus 0.296 for checking accounts and 0.278 for credit card accounts). The sign of coefficients and statistical significances are as expected. The estimates using variables of both accounts individually (column (2) are similar compared to the estimates for aggregated customer variables except for Rating and Days Usage. The coefficients for Rating
in column (2) must be summed to be comparable with the Rating in column (1) because this is defined as the mean of both ratings. Days Usage in column (1) is slightly significant because of opposite effects for individual variables in column (2).
Estimating the credit line usage at customer default using aggregate customer variables is superior to estimation with individual account variables (adj. R² of 0.506 vs. 0.383). There are some differences regarding Amplitude and Days Overdraft. While high Amplitude on checking accounts is a positive signal, it is a negative signal on credit card accounts, which is consistent with our previous findings. We also find that the aggregated overdraft information is a better early warning signal of default probability than the separate information. For estimating credit line usage at default with aggregated customer variables, the adjusted R² of 0.506 is higher/lower
11 For the aggregated variables, we define the Rating as the mean of both ratings, Net Inflow/Lim as the difference
between monthly total inflows and outflows as a percentage of the total external limit, Amplitude as the difference between the maximum and minimum exposure in each month as a percentage of Limit at both accounts, Limit and
Bounced as the sum of limits and average number of bounced debits, and Days Usage, Days Overdraft, and Duration
than for the models with cross-product information for checking accounts (0.182) and credit card accounts (0.579).
3.2 Alternative definition of credit line usage
To measure credit line usage, it is possible to consider only positive values or to consider positive and negative values. From the lender’s perspective, it is important to estimate potential losses, which only occur if the credit line usage is positive. We therefore consider restricted values of
CLU and compare them with the unrestricted estimation. Table 10 reports the results. (Insert Table 10 about here)
The results in Table 10 are similar to those from Table 6 in terms of sign, significance, magnitude, and model fit because the correlation between restricted and unrestricted CLUAD is rather high, especially for credit card accounts (0.62 for checking accounts and 0.97 for credit card accounts). However, the sign for Amplitude in checking accounts becomes positive, meaning that accounts with higher Amplitude have a higher restricted CLUAD. This is because accounts with higher amplitude have higher inflow, along with a higher variance in their in- and outflows. Customers with high amplitude take less credit, but in the event of default, the high amplitude often leads to a high credit line usage and, thus, to higher values of the (restricted) CLUAD. This interpretation is supported by the finding that the coefficient of Amplitude is significantly negative in regressions with a restriction of CLUAD to negative values. Overall, our main results hold both for restricted and unrestricted CLUAD.
3.3 Interaction effects of cross-product account activity measures
measures from both accounts (Net Inflow/Lim, Amplitude, Limit, Bounced, Days Usage, and Days Overdraft) to the default and CLU at default prediction models and repeat the analyses corresponding to Table 3, 4 and 6. Our key results are unchanged and the adjusted McFadden R2 increases only marginally. The findings suggest that adding the interaction terms to the individual terms from both accounts results only in a marginal improvement.
3.4 Alternative prediction horizons
We examine whether our results are sensitive to the prediction horizon. For this purpose, we repeat the analyses with time horizons of one month and three months. At a one month time horizon, we achieve a higher adjusted R² when predicting credit card defaults compared to a time horizon of one year (adj. R² of 0.308 versus 0.278; Table 3, column (8)). However, the effects in terms of sign, significance, and magnitude are largely unchanged. Thus, our results also hold for shorter prediction horizons.
3.5 Fixed effects models
Our estimation of the probability of default is based on pooled probit regression models. Although we included various control variables, our estimates could be biased due to unobserved customer characteristics. We therefore add customer fixed effects to our regression models. In unreported analyses we find that the coefficients of Rating, Net Inflow/Lim,Amplitude, Bounced,
3.6 Impact of the recent financial crisis
The recent financial crisis could affect our results because customers are more likely to default and they have a higher demand for credit. Indeed, when we compare 2009-2010 (crisis) with 2011-2014 (post-crisis), we find higher default rates during the crisis for checking accounts (1.05% versus 0.83%, p<0.001) and credit card accounts (1.36% versus 1.00%, p<0.001). In addition, we find that the credit line usage at default is significantly higher in 2009-2010 (p<0.001); this shows that in a financial crisis, customers have a higher demand for credit. We repeat all analyses using observations from 2011-2014. The findings for the PD, CLU, and
CLUAD are similar, indicating that they are robust in good and bad times.
4. Conclusion
We investigate potential synergies between different sources of private information in consumer credit. Informational synergies are important because they affect the access to credit, terms of credit, credit allocation in the economy, and the risk taking of lenders. Our setting enables us to analyze why consumers default, how much credit they take (unconditional and conditional on default), and how lenders can obtain early warning indications that capture the time-varying nature of credit risk in household finance. The analysis is based on a large and unique dataset of more than 1.7 million customer-month observations for 2007-2014, comprising dynamic information from checking accounts and credit card accounts for each customer.
benefits of cross-production informational synergies are sizeable: Lenders can lower the type I error by around eight percentage points - corresponding to a 33% reduction of the type I error - when they consider checking account activity in addition to credit card account activity. We show that these different sources of information are beneficial for ex ante screening and ex interim monitoring of borrower quality. Lenders can exploit these synergies to improve their credit and customer relationship management, for example in the context of limit changes, account closures, or restructuring. We also investigate the consistency of information, the reasons for consumer defaults, and selection effects. The latter should be considered when estimating the credit line usage or exposure at default with a Heckman selection model or an endogenous treatment-regression model. Unbiased estimates of the exposure at default can also be achieved with econometric models on the subsample of defaulted accounts if ex ante measures of default risk, such as credit ratings, are taken into account.
References
Agarwal, S., S. Chomsisengphet, C. Liu, and N. Souleles. 2009. Benefits of relationship banking: evidence from consumer credit markets. Working Paper, Federal Reserve Bank of Chicago, No. 2010-05.
Akçura, M.T., and K. Srinivasan. 2005. Research note: customer intimacy and cross-selling strategy. Management Science 51, 1007-1012.
Allen, F., and D. Gale. 2000. Comparing Financial Systems. MIT Press, Cambridge MA.
Bank for International Settlements. 2013. Statistics on payment, clearing and settlement systems in the CPSS countries.
Berg, T., M. Puri, and J. Rocholl. 2014. Loan officer incentives, internal ratings and default rates. Working Paper, September 2014.
Berlin, M., and L. Mester. 1999. Deposits and Relationship Lending. Review of Financial Studies
12, 579-607.
Campbell, J. 2006. Household Finance. Journal of Finance 61, 1553-1604.
Grunert, J., L. Norden, and M. Weber, 2005. The role of non-financial factors in internal credit ratings. Journal of Banking and Finance 29, 509-531.
Gürtler, M., and M. Hibbeln. 2013. Improvements in loss given default forecasts for bank loans.
Journal of Banking and Finance 37, 2354-2366.
Heckman, J. 1976. The common structure of statistical models of truncation, sample selection and limited dependent variables and a simple estimator for such models. Annals of Economic and Social Measurement 5, 475-492.
Heckman, J. 1978. Dummy endogenous variables in a simultaneous equation system.
Econometrica 46, 931-959.
Hertzberg, A., J. Liberti, and D. Paravasini. 2010. Information and incentives inside the firm: Evidence from loan officer rotation. Journal of Finance 65, 795-828.
Jiménez, G., J. Lopez, and J. Saurina. 2009. Empirical Analysis of Corporate Credit Lines.
Review of Financial Studies 22, 5069-5098.
Kamakura, W., M. Wedel, F. De Rosa, and J. Mazzon. 2003. Cross-selling through database marketing: a mixed data factor analyzer for data augmentation and prediction. International Journal of Research in Marketing 20, 45-65.
Kamakura, W., S. Ramaswami, and R. Srivastava. 1991. Applying latent trait analysis in the evaluation of prospects for cross-selling of financial services. International Journal of Research in Marketing 8, 329-349.
King, G., and L. Zeng. 2001. Logistic Regression in Rare Events Data. Political Analysis 9, 137-163.
Krahnen, J., and R. Schmidt. 2004. The German Financial System. Oxford University Press. Li, S., B. Sun, and A.L. Montgomery. 2011. Cross-selling the right product to the right customer
at the right time. Journal of Marketing Research 48, 683-700.
Li, S., B. Sun, and R.T. Wilcox. 2005. Cross-selling sequentially ordered products: An application to consumer banking services. Journal of Marketing Research 42, 233-239. Mester, L., L. Nakamura, and M. Renault. 2007. Transaction accounts and loan monitoring.
Review of Financial Studies 20, 529-556.
Norden, L., and M. Weber. 2010. Credit line usage, checking account activity, and default risk of bank borrowers. Review of Financial Studies 23, 3665-3699.
Puri, M., J. Rocholl, and S. Steffen. 2013. What kinds of bank-client relationships matter in reducing loan defaults and why? Working Paper, October 2013.
Stango, V., and J. Zinman. 2014. Limited and Varying Consumer Attention Evidence from Shocks to the Salience of Bank Overdraft Fees. Review of Financial Studies 27, 990-1030. Vella, F., and M. Verbeek. 1999. Estimating and Interpreting Models with Endogenous
Treatment Effects. Journal of Business and Economic Statistics 17, 473-478.
Figure 1: Limit and negative balance of checking accounts
Figure 2: Cash inflows and outflows of checking accounts
Figure 3: Days with credit line usage and overdrafts
Panel A displays defaults of checking accounts, whereas Panel B displays defaults of credit cards. Days with usage are presented in Panel A1/B1 and days with overdrafts in Panel A2/B2. The solid and dash-dotted lines present days for defaulted (mean) and non-defaulted (default weighted mean) checking accounts, whereas the dashed and long-dashed lines present days for defaulted (mean) and non-defaulted (default-weighted mean) credit card accounts.
Panel A: Default of checking accounts
Panel A1: Days with usage Panel A2: Days with overdrafts
Panel B: Default of credit cards
Figure 4: Credit line usage by credit rating
Figure 5: Consistency of information across credit products
Panel A1 shows estimates of the probability of default (PD) for checking accounts where the estimates are based on account activity of checking accounts versus credit cards. Panel A2 shows the estimates of credit line usage at default (CLUAD). Panel B shows the corresponding PD estimates (Panel B1) and CLUAD estimates (Panel B2) for defaults of credit card accounts.
Panel A: Default of checking accounts
Panel A1: PD estimates Panel A2: CLUAD estimates
Panel B: Default of credit cards
Table 1: Summary statistics
This table reports summary statistics. The sample covers the period from December 2007 to January 2014 (74 months). Panel A reports the number of account-months observations and the frequency of default events. The default events are at account level. Panel B reports the number of monthly observations without default, with default of only checking accounts or credit cards, or with joint defaults of both accounts. Panel C provides summary statistics of default risk, account activity, relationship, and account type variables. Rating is the probability of default estimate of the bank’s internal rating system. Net Inflow/Limit is the ratio of monthly inflows minus outflows to the external limit and can be positive or negative. Amplitude is the difference of the monthly maximum and minimum balance per Limit and hence positive. Limit is reported in Euro values. Bounced is the average number of bounced credits in the previous year. Days Usage and Days Overdrafts are the average percentage of days in the previous year with positive credit line usage and overdrafts, respectively. Duration is defined as the time period since account opening in months. Full Payment refers to credit cards with monthly full payments instead of delayed payments. The last column reports the pairwise comparison of checking accounts and credit cards on the customer level. *** Statistically significant at the 0.1% level.
Panel A: Number of account-month observations and default events
Statistic Checking Account Credit Card
Number of account-month observations 1,779,356 1,781,408 Number of account-months with default in the subsequent 12 months 19,149 22,964
Number of defaults 1,639 2,101
Panel B: Number of account-month observations with individual vs. joint defaults Checking Account:
No Default
Checking Account: Default
Credit Card: No default 1,754,099 5,857
Credit Card: Default 7,565 13,887
Panel C: Summary statistics and comparisons of checking accounts and credit cards
Variable
Checking Account Credit Card Checking Account Minus Credit Card Mean Median Mean Median Pairwise Difference t-stat. Default Risk
Ratingt 1.79 0.88 3.79 1.94 -1.939*** -428.25
Account Activity
Net Inflow/Limt 0.02 0.00 0.00 0.00 0.0195*** 19.18
Amplitudet 1.80 1.03 0.39 0.24 1.407
***
727.72
Limitt 2437 2000 2581 2000 -143.7*** -163.29
Bouncedt 0.00 0.00 0.05 0.00 -0.0500*** -182.49
Days Usaget 0.18 0.03 0.55 0.67 -0.367*** -1269.96
Days Overdraftt 0.01 0.00 0.00 0.00 0.0070*** 201.34
Relationship
Durationt 46.38 41.00 34.99 34.00 11.46*** 616.02
Account Type