KENNYA BEATRIZ SIQUEIRA
Tese
apresentada
à
Universidade
Federal de Viçosa, como parte das
exigências
do
Programa
de
Pós'
Graduação em Economia Aplicada, para
obtenção do título de
Doctor Scientiae
.
VIÇOSA
KENNYA BEATRIZ SIQUEIRA
THE DYNAMICS OF FARM MILK PRICE FORMATION IN BRAZIL
Tese apresentada à Universidade Federal de Viçosa, como parte das exigências do Programa de Pós-Graduação em Economia Aplicada, para obtenção do título de Doctor
Scientiae.
APROVADA: 18 de abril de 2007
José Luis dos Santos Rufino
Brício dos Santos Reis
Ronaldo Perez
Richard Lee Kilmer
(Co-orientador)
To my beloved eamily and everyone that, somehow, helped me to get through in the
To God for giving me the energy, courage, determination, and providing me with
such good friends.
To my family for the love, care, and attention.
To my advisor Professor Antônio Carvalho Campos for supporting all my decisions
and giving me the freedom to conduct my work.
To Dr Richard L. Kilmer for the great opportunity to work together, for the
professional and emotional support, and for the example of diplomacy, politeness and
responsibility.
To Professor and eternal advisor Carlos Arthur Barbosa da Silva for the friendship,
partnership, attention, and orientation. To Professor Sebastião Teixeira Gomes for sharing
his experience and knowledge about the milk market. To Professors Danilo Rolim Dias de
Aguiar, João Eustáquio de Lima, Fátima Marília de A. Carvalho, Brício dos Santos Reis,
and all the professors of the Agricultural Economics Department of the Federal University
of Viçosa for the wonderful teaching and guidance.
To Dr. Charles Moss for his math mind and methodological support. To Dr
Schmidt, Dr Ward, and Dr Spreen for the friendly reception. To Dr William Bomberger for
providing software.
Special thanks to Dr David Bessler, Clark Gymour, Joseph Ramsey, and Dr Bruce
To Vick, Jess, Bodo, Carole, and Donna for the academic and legal support at the
University of Florida.
To friends Robert and family, Christie and family, Jessica and the Myslikowski
family, Yuko, Vivian, Wen, Zack, Nestor, Sofiya, Yuri, Patricia, Fabio, Naoko, Jessica,
Nadia, Sabine, Hyung Kyung, Hong Tao, Lan, Yvonne, Ivone, Bonnie, Bee, Marco,
Caroline, Evandro, Marta, Graziela and family, Ms Ellen, Ilka, Maria, JG, Mohammad Ali,
Antonella and Guido, Lucio, and Valéria for being my family in US, and Eduardo,
Ritaumária, Renata, and André for our eternal friendliness.
To my beloved aunts Edna, Ione and Dalva for being like a mother for me.
To those from the Departamento de Economia Rural of Universidade Federal de
Viçosa: Graça, Cida, Carminha, Luíza, Tedinha, and Rosângela.
To the Universidade Federal de Viçosa and Departamento de Economia Rural for
the oportunity to achieve professional growth.
To Coordenação de Aperfeiçoamento de Pessoal de Nível Superior (CAPES), and
KENNYA BEATRIZ SIQUEIRA, daughter of Venício Siqueira and Márcia Regina
da Silva Siqueira, was born in Varginha, Minas Gerais, in November 4, 1978.
In May 10, 2002, she received her degree in Food Engineering at the Federal
University of Viçosa, in Viçosa, Minas Gerais.
In April of 2002, she started the Master Program in Applied Economics at the
Federal University of Viçosa. On December 9 of 2003, she defended her dissertation titled
“Feasibility of introducing of a milk future contract in Brazil.”
In August of 2004, the Brazilian Mercantile & Futures Exchange presented her the
award for the best dissertation regarding futures markets in Brazil.
In February of 2004, she started a PHD Program Program in Applied Economics at
the Federal University of Viçosa. In February 27, 2006, she attended the University of
Florida, in Gainesville, Florida, United States of America, in order to do a Sandwich
Program at the Food and Resource Economic Department. On April 18, 2007, she received
Página
LIST OF TABLES ... ix
LIST OF FIGURES... xi
RESUMO... xiii
ABSTRACT ... xiv
1. INTRODUCTION... 1
2. BRAZILIAN MILK MARKET ... 5
2.1. WORLD DAIRY ECONOMY... 5
2.2. NATIONAL DAIRY PRODUCTION... 8
2.3. DAIRY COMPANIES... 12
3. LITERATURE REVIEW ... 16
3.1. THEORETICAL DEFINITIONS AND CONTROVERSIES ABOUT MARKET INTEGRATION... 16
3.2. LAW OFONEPRICE... 20
3.3. THEORETICAL MODELS FOR MARKET INTEGRATION... 23
3.3.1. Point!space model... 23
3.3.3. Other alternative models... 24
3.4. METHODS:ADVANTAGES AND DISADVANTAGES... 25
3.4.1. Price Correlation... 25
3.4.2. Ravallion model ... 26
3.4.3. Switching regime model ... 27
3.4.4. Cointegration models... 29
3.4.5. Threshold cointegration models ... 33
3.4.6. Complementary methodologies ... 37
3.4.6.1. Granger causality ... 37
3.4.6.2. Impulse response functions ... 38
3.4.6.3. Persistence profile ... 39
3.4.6.4. Directed Acyclic Graphs (DAG’s)... 39
3.4.7. Other Interesting works ... 41
3.5. SUMMARY... 43
4. THEORY ... 45
4.1. LAW OFONEPRICE... 45
4.2. TAKAYAMA ANDJUDGEMODEL... 47
4.3. THEORETICAL MODEL OF THE MILK MARKET... 48
5. METHODOLOGY... 57
5.1. EXTENSION OF THE MARKET... 57
5.1.1. Index oe Sele!Sueeiciency... 58
5.1.2. Common integrating eactor ... 58
5.1.2.1. Cointegration test ... 60
5.1.2.1.1. Unit root test ... 60
5.1.2.1.1.1. ADF test ... 60
5.1.2.1.1.1.1. Lag length selection ... 61
5.1.2.1.1.1.2. Intercept and trend ... 62
5.1.2.1.2. Johansen test ... 62
5.2. PATTERN OF INTEGRATION... 65
5.2.1. Vector error correction model... 65
5.2.2. Directed acyclic graphs ... 67
5.3. DEGREE OF INTEGRATION... 71
5.3.1. Bernanke decomposition ... 71
5.3.2. Impulse response eunctions ... 72
5.4. DATA... 75
6. RESULTS ... 76
6.1. EXTENSION OF THE MARKET... 79
6.1.1. Cointegration in pairs... 83
6.1.2. Cointegration in groups ... 85
6.2. PATTERN OF INTEGRATION... 91
6.3. DEGREE OF INTEGRATION... 110
6.3.1. Impulse response eunctions ... 110
7. CONCLUSION ... 114
... 6
!... 8
" #
$ ... 10
!
% !... 11
& ! 13
'
( ... 14
( & ) *
... 79
$
... 82
... 88
(
... 89
& #
... 92
" & #
! & #
& ... 96
& #
& ... 98
' & #
... 100
( & #
& ... 102
$ & #
# ... 104
& #
... 106
& #
Figure 1 – Production of milk production in the Brazilian states, 2004. ... 9
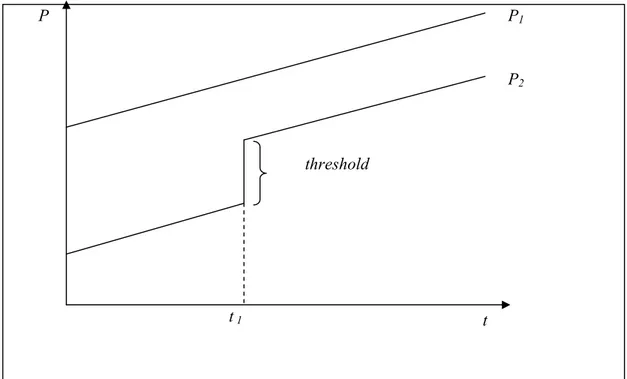
Figure 2 – Threshold effect between two price series... 34
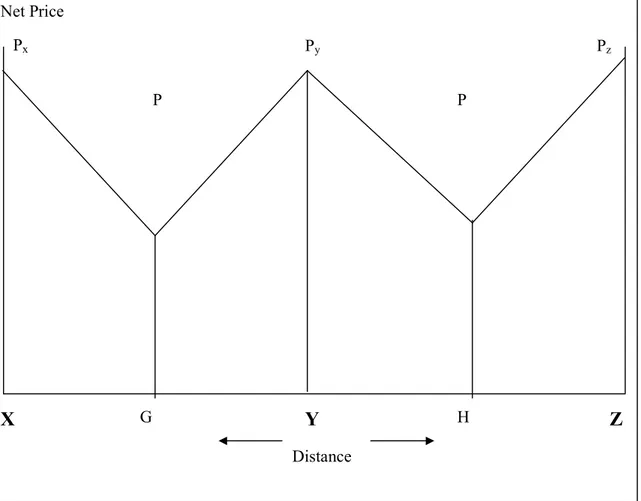
Figure 3 – Spatial price representation for an oligopsonistic situation. ... 50
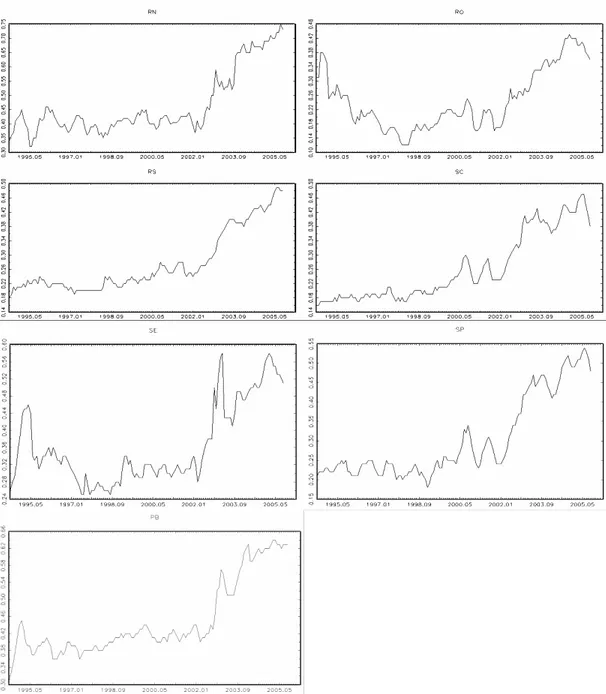
Figure 4 – Nominal price received by milk farmers in 19 Brazilian states, between 1994 and 2005. ... 78
Source: Results of the research. ... 78
Figure 5 – Correlogram of the milk price in 18 states of Brazil. ... 81
Source: Results of the research. ... 81
Figure 5 – Brazilian milk market ... 91
Figure 6 – Patterns from PC Algorithm on innovations from VAR on the South of Brazil. ... 93
Figure 7 – Patterns from PC Algorithm on innovations from VAR on the Southeast of Brazil. ... 95
Figure 8 – Patterns from PC Algorithm on innovations from VAR on the Center'West of Brazil. ... 97
Figure 9 – Patterns from PC Algorithm on innovations from VAR on the Center'West and South of Brazil. ... 99
Figure 11 – Patterns from PC Algorithm on innovations from VAR on the Center'West and
Southeast of Brazil. ... 103
Figure 12 – Patterns from PC Algorithm on innovations from VAR on the five states
leading in milk production in Brazil. ... 105
Figure 13 – Patterns from PC Algorithm on innovations from VAR on the five states
leading in milk consumption in Brazil. ... 107
Figure 14 – Patterns from PC Algorithm on innovations from VAR on a combination of
states leading in milk production and consumption... 109
Figure 15 – Set of impulse response functions for the region South. ... 110
SIQUEIRA, Kennya Beatriz, M. Sc., Universidade Federal de Viçosa, abril de 2007. +,-./,01 +1 234/1563 +3 74853 +3 98,:8 -3 41;,9. Orientador: Antônio Carvalho Campos. Co'orientadores: Richard L. Kilmer, Danilo Rolim Dias Aguiar e Sebastião Teixeira Gomes.
O setor lácteo é um dos maiores setores da economia agrícola do País. Entretanto,
este setor tem sofrido significativas mudanças no período pós'liberalização. Por isso, é
importante saber quais mudanças ocorreram na integração espacial do mercado e na
formação do preço do leite no nível de produtor. Este problema é importante para o
desenvolvimento do setor lácteo e ainda não foi estudado no Brasil. O objetivo geral deste
trabalho é analisar a dinâmica de formação do preço do leite no Brasil. A teoria adotada é
uma versão de Faminow e Benson (1990), desenvolvida para um mercado olipsionista no
Brasil. A metodologia é uma modificação de Gonzalez'Rivera & Helfand (2001), a qual é
composta de extensão do mercado, padrão de interdependência e grau de integração do
mercado. A extensão do mercado é determinada através da medida do índice de auto'
suficiência, teste de raiz unitária e procedimento de Johansen. Este último é focado na
busca de uma tendência comum entre as séries temporais. O padrão de interdependência é
estudado usando a análise do vetor de correção de erros, em associação com Directed
Acyclic Graphs. Por último, o grau de integração é medido pelas funções de impulso'
mercado lácteo no Brasil é composto por Goiás, Mato Grosso, Mato Grosso do Sul, Minas
Gerais, Paraná, Rio de Janeiro, Rio Grande do Sul, Santa Catarina e São Paulo. Nas regiões
Norte e Nordeste existem vários mercados locais. Constatou'se também que este mercado
tem uma baixa velocidade de ajustamento a choques e não existe um líder na formação de
SIQUEIRA, Kennya Beatriz, M.Sc. Universidade Federal de Viçosa, April 2007. <8 +=-1/,0; 32 214/ /,9> 74,08 234/1:,3- ,- 41?,9. Adviser: Antônio Carvalho Campos. Co'Advisers: Richard L. Kilmer, Danilo Rolim Dias de Aguiar and Sebastião Teixeira Gomes
Dairy is a highly relevant segment of the Brazilian agribusiness economy.
However, this segment has changed significantly after deregulation Thus, it is worth to
know what the changes are in the spatial integration of the market and in milk price
formation at the farm level. This problem is important to the development of the dairy
sector and has not been studied in Brazil. The general objective of this work is to analyze
the dynamics of milk price formation in Brazil. The theory adopted is a version of
Faminow & Benson (1990), applied for an oligopsony market in Brazil. The methodology
is a modification of Gonzalez'Rivera & Helfand (2001), which is compounded in
extension of the market, pattern of integration, and degree of integration. The extension of
the market is determined through the measure of self'sufficiency index, unit root test, and
Johansen test. The last one is focused on the searching for a common trend between the
time series. The pattern of interdependence is studied using the VEC/VAR analysis in
association with the DAG. Lastly, the degree of integration is measured by the impulse
Gerais, Paraná, Rio de Janeiro, Rio Grande do Sul, Santa Catarina, and São Paulo. In the
North and Northeast of Brazil, there are local milk markets. We also discovered that these
markets have small speed of adjustment to shocks and there is no leader in milk price
Dairy is a highly relevant segment of the Brazilian agribusiness economy. In 2004,
the Brazilian milk production was roughly 23.48 billion liters, equivalent to US$ 27.45
billion, corresponding to 1.19% of the Gross Domestic Product (GDP) for Brazil. So, dairy
farm production is one of the highest generators of employment and growth per unit of
investment capital (Embrapa, 2005).
However, there is a significant heterogeneity among dairy farms. Large dairy
farms, with elevated productivity indexes, are located among small traditional dairy farms
that work with rudimentary techniques of production. It results in great differences
between the production systems used by small and large dairy farms. The small dairy
farms represent 80% of the producers and are responsible for 20% of national production,
while 20% of the dairy farms are classified as large and represent 80% of national
production (Gomes, 2003).
Historically, domestic milk consumption has exceeded domestic production. Brazil
is characterized as a net importer of dairy products with annual purchases in the order of
one billion liters (Milkpoint, 2005). More recently, Brazilian dairy exports, which have
3@84-/8-:19 ,-:84@8-:,3- 3- :<8 41?,9,1- /,9> /14>8:
Federal governmental intervention in the dairy sector is an important part of
Brazilian milk history. In 1945, the government began the intervention at both the farm and
retail level. Then, the government began to control the margins of factories profit
(Meirelles, 1989). The regulation of the milk price, in association with a closed economy,
had a protectionist character, which delayed the modernization of the dairy industry
(Gomes, 2003). The absence of competition from imported products and the low level of
requirements of consumers resulted in stagnation of the dairy sector. It persisted with lower
levels of productivity, elevated costs of production and lower quality products (Martins,
1999).
In 1991, the government decided for the liberalization of the milk segment. After
deregulation, the dairy farm production sector showed relevant technological development,
which is verified by increased rates of growth in productivity and milk production (Gomes,
2003). However, in the context of post liberalization, high levels of price instability started
to be observed at the farm level, leading to repeated demands for government intervention
in the transactions between farmers and processors.
Indeed, even after more than one decade of deregulation, significant advances have
not yet been observed in the vertical coordination between farm milk production and the
distribution chain (Gomes et al., 2002). Typically, there is no price, quantity or any other
production or marketing commitment formalized in the supply chain relationships between
farmers and processors, like contracts, options, or futures markets. As such, the traditional
forms of price risk management cannot exist, and this hinders planning and decision
making for all players in the milk chain. By and large, these chain actors have to cope
permanently with uncertainty regarding quantities, quality, prices and other related
variables (Gomes et al., 2002).
On the other hand, there was a change in milk production regions. In 2002, the
largest growth in farm milk production occurred in Northern Brazil, with an increased of
325 million liters. With a yearly output of 29.16% of national production in 2001, Minas
Gerais ranks 1st among the country’s largest milk producers, followed by Goiás with
11.32%, Rio Grande do Sul with 10.83%, Paraná with 9.21% and São Paulo with 8.69%.
Therefore, São Paulo, the traditional milk producer, has decreased in rank (Embrapa,
The region Center'West has been notable in milk production. This region, mainly
Goiás, has shown increasing rates of growth in milk production. In Minas Gerais (region
Southeast), farm milk production has relocated from traditional dairy regions, like the
South, Southeast, and Zona da Mata to the Triângulo Mineiro and Alto Parnaíba. This
relocation was caused by a reduction in production costs, which made Brazilian dairy
products more competitive with imports (Tannús, 2001). It represents a possibility of
acquiring inputs at lower prices, because dairy farms are closer to the largest grain
production regions (Gomes, 1997).
Another important part of the dairy sector is long'life milk, called Ultra High
Temperature milk (UHT). UHT was introduced in Brazil in 1972, but it only began to be
successful in the 1990s, after the government deregulated the milk markets. Since then,
sales have increased an average of 27% per year. The market share of UHT milk in the
fluid milk market rose from 4.4% in 1990 to 74% in 2002 and there are presently more
than 100 brands on the market (Embrapa, 2003).
So, with the government deregulation, changes have taken place in the dairy
industry, in farms (i.e., production location and farm size) and consumers’ profile (i.e.,
product quality), and in processing techniques (i.e., UHT milk). In this context, it is
important to identify how the integration is between different regions after the price
liberalization.
" 43A98/ ;:1:8/8-:
What are the changes in the spatial integration of the market and in milk price
formation at the farm level after deregulation? This problem is important to the
development of the dairy sector and has not been studied in Brazil.
! AB80:,@8;
The general objective of this work is to analyze the dynamics of milk price
formation in Brazil by identifying where the milk price is formed and what the relationship
is between milk prices in different Brazilian states.
• To evaluate the pattern of interdependence between the Brazilian states in milk
production, and
• To measure the degree of integration of the Brazilian milk market.
=73:<8;,;
I hypothesize that all the states in Brazil are grouped in only one big market, and
349+ +1,4= 803-3/=
Milk is produced in almost all countries of the world, and has a great economic and
nutritional importance. According to FAO (2006), world dairy production in 2005 is
estimated in 530,718 million tons, a value that is increasing over the years, due to trade
liberalization, decreasing subsidies, and world growth economic.
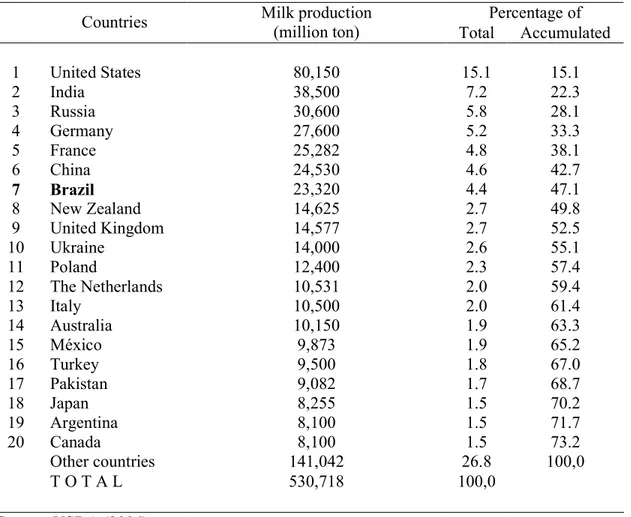
On the world ranking for milk production in 2005, the seven largest producers are
the United States, India, Russia, Germany, France, China, and Brazil (Table 1). Together,
these seven countries accounted for 47.1% of global milk production. The United States is
the leading producer of milk, followed by India (USDA, 2006). However, the milk
production on India has few commercial qualifications, inasmuch as about 50% thereof is
Table 1 – World ranking for milk production in 2005*.
Percentage of Countries Milk production
(million ton) Total Accumulated
1 United States 80,150 15.1 15.1
2 India 38,500 7.2 22.3
3 Russia 30,600 5.8 28.1
4 Germany 27,600 5.2 33.3
5 France 25,282 4.8 38.1
6 China 24,530 4.6 42.7
( 41?,9 23,320 4.4 47.1
8 New Zealand 14,625 2.7 49.8
9 United Kingdom 14,577 2.7 52.5
10 Ukraine 14,000 2.6 55.1
11 Poland 12,400 2.3 57.4
12 The Netherlands 10,531 2.0 59.4
13 Italy 10,500 2.0 61.4
14 Australia 10,150 1.9 63.3
15 México 9,873 1.9 65.2
16 Turkey 9,500 1.8 67.0
17 Pakistan 9,082 1.7 68.7
18 Japan 8,255 1.5 70.2
19 Argentina 8,100 1.5 71.7
20 Canada 8,100 1.5 73.2
Other countries 141,042 26.8 100,0
T O T A L 530,718 100,0
Source: USDA (2006).
*These values include cow, buffalo, sheep, goat, and camel.
In this ranking, Brazil is in the seventh position with 23,320 thousand tons of milk
in 2005. The relative share of Brazil’s production in the world total has increased in recent
decades, from 2.1% in 1970 to 3.1% in 1990 (Souza, 2000). In the 1990s and early 2000s,
this growth was further accentuated, reaching 4.6% in 2001. However, in 2005, it is
equivalent to 4.4% of the world production of cow milk.
Up to 2004, Brazil had been the sixth in the world ranking. Nowadays, the sixth
place belongs to China, which increased production by more than 300% between 2000 and
2005. The growth rate of China is the highest. However, excluding China, Brazil has
realized the highest growth rates in the last 10 years. It represents a growth rate 73% higher
than the U.S. On the other hand, Russia, Germany, and France have shown negative rates
According to Meireles (2003), between 1995 and 2001, milk production in Brazil
increased 4% per year, while the other countries of South America have a growth rate of
2%, Asia 3.4%, Africa 1.9%, North, and Central America 1.9%, and Europe has decreased
1% per year. So, Brazil was exceeded only by New Zealand and Australia (5.5% per year),
which became the most important exporter block on the world1.
In contrast, the number of cows has decreased in all countries, except for India.
Nonetheless, in 2004, the number of cows in Brazil was still 69% higher than in the United
States, while the American production was 235% higher than the Brazilian production
(Gomes, 2006). It can be explained by the differences in the production systems. In Brazil,
extensive systems predominate with supplementary food in the winter. In other words, in
Brazil the farms are composed by big green field where the cattle can graze. In the USA,
the production is intensive, based on ensilage and concentrate cow feed. However, the
average cost of milk production in Brazil is lower than in the USA.
On the other hand, Brazil has a lower rate of productivity with 1,534
liters/cow/year, while the USA presents a productivity of 8,703 liters/cow/year. This
occurs because of a large number of small farmers in Brazil, who produce less than 50
L/day, which affects the total productivity (Gomes, 2006).
Comparing milk consumption, Brazil presents a similar consumption pattern to the
other largest world producers. In 2004, the Brazilian consumption was 68.4
kg/person/year, compared to 65.3 kg/person/year in France and 61.4 kg/person/year in
Germany. Only the USA and Russia have a consumption just over 90 kg/person/year,
while India had a lower level of consumption (32.4 kg/person/year).
In the international trade market, New Zealand, European Union, Australia, and
United States are the greatest exporters of milk with 34%, 31%, 15%, and 4%,
respectively. However, it is one of the commodities that has more subsidies. According to
Neves & Consoli (2006), the subsidies for milk are approximately 59% more than for
meat.
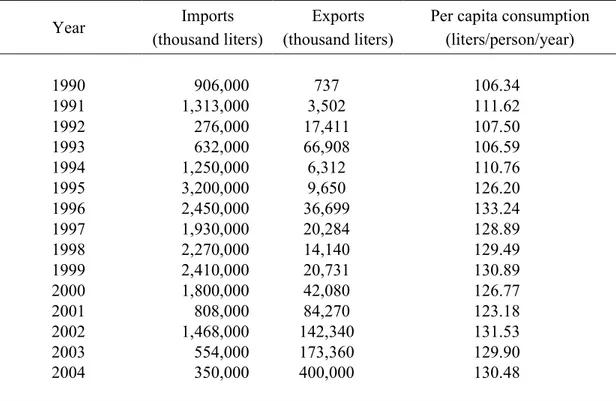
Brazil has always been characterized as milk importer. But, in 2004 for the first
Table 2 – Milk imports, exports, and per capita consumption between 1990 and 2004.
Year Imports
(thousand liters)
Exports (thousand liters)
Per capita consumption (liters/person/year)
1990 906,000 737 106.34
1991 1,313,000 3,502 111.62
1992 276,000 17,411 107.50
1993 632,000 66,908 106.59
1994 1,250,000 6,312 110.76
1995 3,200,000 9,650 126.20
1996 2,450,000 36,699 133.24
1997 1,930,000 20,284 128.89
1998 2,270,000 14,140 129.49
1999 2,410,000 20,731 130.89
2000 1,800,000 42,080 126.77
2001 808,000 84,270 123.18
2002 1,468,000 142,340 131.53
2003 554,000 173,360 129.90
2004 350,000 400,000 130.48
Source: Embrapa Gado de Leite (2006).
Between 1994 and 2000, Brazil had a period of high milk imports (Table 2).
However, after 2002, it has changed abruptly. During the same period, exports have
increased in response to the global consumption growth and favorable exchange taxes.
Among the main buyers of the Brazilian milk are Iraq, Algeria, and Angola (Neves &
Consoli, 2006).
On the other hand, per capita consumption had an increase in 1994 after the Plano
Real2. It is explained by the increase in income, caused by the Plano Real. Nevertheless,
during the remainder of the period, per capita consumption has plateaued.
1:,3-19 +1,4=
743+C0:,3-In Brazil, the milk production generated approximately R$ 23.48 billion liters, in
2004 (Neves & Consoli, 2006). It is present on approximately 40% of the farms and
distributed in all the national territory (Nogueira Netto et al., 2003, cited by Fassio et al,
2Plano Real was a political plan implemented in July 1, 1994. The objective of this plan was to stabilize the
2005). According to Leite Brasil (2006), the milk segment is so significant that just cheese
consumers spent R$ 5.54 billions, which is equivalent to more than half of the consumer’s
citrus value. Figure 1 shows the production of milk in Brazil.
Figure 1 – Production of milk production in the Brazilian states, 2004.
Source: Developed by the author
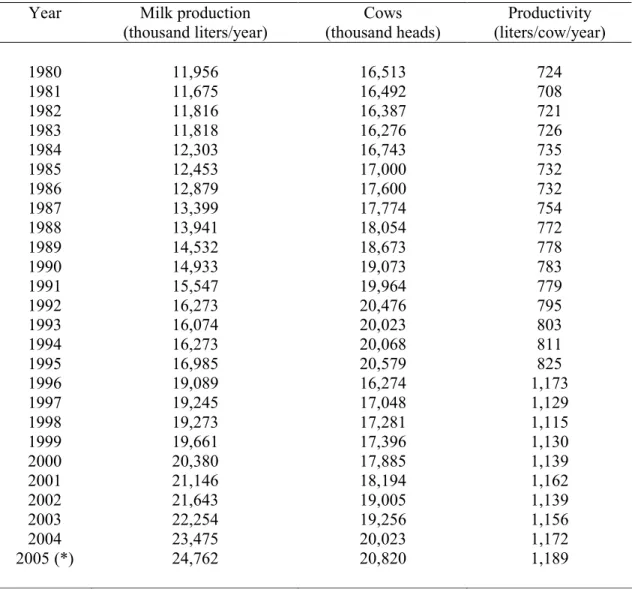
In the last 10 years, the milk production has increased considerably in Brazil along
Table 3 – Milk production, number of cows and productivity between 1980 and 2005.
Year Milk production (thousand liters/year)
Cows (thousand heads)
Productivity (liters/cow/year)
1980 11,956 16,513 724
1981 11,675 16,492 708
1982 11,816 16,387 721
1983 11,818 16,276 726
1984 12,303 16,743 735
1985 12,453 17,000 732
1986 12,879 17,600 732
1987 13,399 17,774 754
1988 13,941 18,054 772
1989 14,532 18,673 778
1990 14,933 19,073 783
1991 15,547 19,964 779
1992 16,273 20,476 795
1993 16,074 20,023 803
1994 16,273 20,068 811
1995 16,985 20,579 825
1996 19,089 16,274 1,173
1997 19,245 17,048 1,129
1998 19,273 17,281 1,115
1999 19,661 17,396 1,130
2000 20,380 17,885 1,139
2001 21,146 18,194 1,162
2002 21,643 19,005 1,139
2003 22,254 19,256 1,156
2004 23,475 20,023 1,172
2005 (*) 24,762 20,820 1,189
Source: Embrapa Gado de Leite (2006).
* estimative
According to Gomes (2006), the geometric growth rate of milk production in the
1990’s was 3.26%, while between 2000 and 2004 it was 4.48%. Productivity increased
3.98% between 1995 and 2004.
Milk production in Brazil is characterized by heterogeneity among the farmers.
There are traditional and small farmers who utilize rudimentary techniques of production,
as well as modern farmers, which use high technology and have higher indexes of
productivity.
According to Sbrissia (2005), it is hard to know the exact number of dairy farmers
in Brazil because of the heterogeneity among them and because of the huge dimension of
dairy farmers. However, data from 15 leading dairy companies in Brazil asserted that there
were 95,847 dairy farmers in 2002. Nowadays, the modern farmers correspond to 20% of
the total farmers and are responsible for 80% of the production. On the other hand, the
traditional farmers are 80% of the total and produce about 20% of the national production
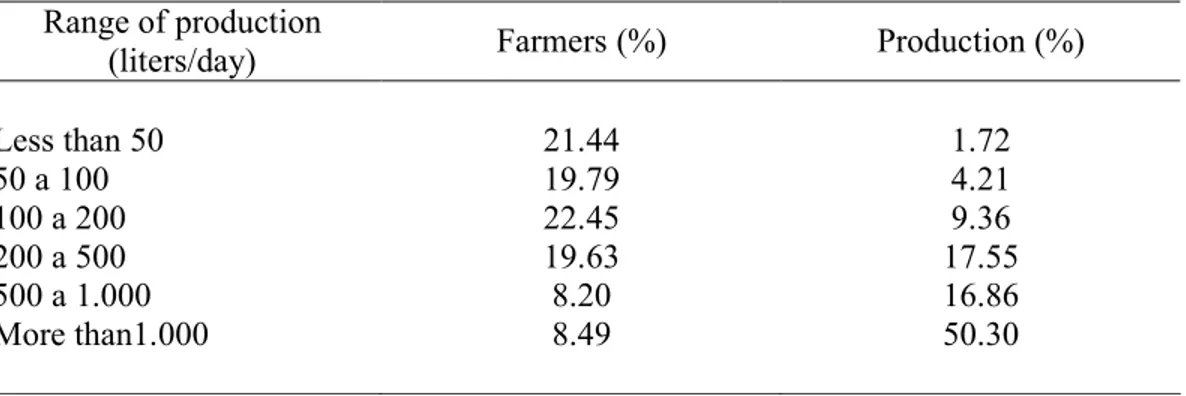
(Table 4).
Table 4 – Number and production of the farmers associated to Itambé, in 2004.*
Range of production
(liters/day) Farmers (%) Production (%)
Less than 50 21.44 1.72
50 a 100 19.79 4.21
100 a 200 22.45 9.36
200 a 500 19.63 17.55
500 a 1.000 8.20 16.86
More than1.000 8.49 50.30
Source: Gomes (2006).
* Biggest Brazilian dairy cooperative, located in Minas Gerais.
In 2004, 41% of the Itambé’s farmers produced up to 100 liters/day, which is
equivalent to only 6% of total production. Nevertheless, 17% of the farmers produced
more than 500 liters/day, which corresponds to 67% of the volume of milk received by
Itambé. So, it is a good example of the inequality of farmers in Brazil.
In addition, studies point out that this heterogeneity has increased in the last years.
Gomes (2006) states that from 1980 to 2004, the percentage of the farmers who produce up
to 50 liters/day changed from 27% to 2%. In the same period, the relative share of farmers
that produce more than 500 liters/day changed from 25% to 67%.
Sbrissia (2005) affirms that the milk segment in Brazil is in a period of change
through which other countries such as New Zealand had already passed. The number of
farms is dropping, the number of cows and size of the farms are increasing, while the price
is decreasing and more efficiency and scale economies are required. So, a concentration
process is happening in milk production in Brazil. Nevertheless, it may be a result of the
new system of milk production and trade in Brazil.
First of all, the new rules to collect and cool the milk imposed by the Normative
requirements of the IN 51 is that milk be kept in cooling tanks on farms. So, some small
farmers choose to associate with others in using of the same cooling tank. It sounds like a
good alternative inasmuch as small farmers have neither the income nor volume of milk to
keep their own tank.
Furthermore, the processors in Brazil started to pay farmers for milk volume and
quality. It means that if a farmer delivers a higher quantity of milk periodically, he/she will
receive a better price for the milk. Because of this, some small farmers decided to associate
and deliver milk together (using the name of only one farmer) in order to take advantage of
this system of pricing.
As a result, the number of small farmers that deliver milk to processors decreased
and the number of big farmers increased. However, it does not mean that the total number
of farmers decreased. It is just a result of the association on the cooling and on the delivery
of milk.
" 1,4= 03/71-,8;
Neves & Consoli (2006) affirms that Brazil has 1,973 dairy processors with 34.4%
of them in Minas Gerais, 13% in São Paulo, and 10.4% in Goiás. In this sense, 55% of the
processors work with less than 10,000 liters/day. Only 5.3% of them work with more than
100,000 liters/day of which 28.8% are in Minas Gerais and 20.2% in São Paulo. It is an
indication that there is some market power since the 14 leading companies processed 40%
of the legal milk in Brazil in 2004 (Neves & Consoli, 2006). It was 21% for the 3 greatest
companies and 10% for the first one. It means that there is an oligopsony situation. Table 5
shows the reception of milk for the 14 leading companies in Brazil. According to Gomes
(2006), the processors segment became more concentrate in the early years due to growth
Table 5 ' Leading companies of dairy products in Brazil, 2004.
Quantity receipted (thousand liters) Company/ Brand
Farmers Third
market Total
Number
of farmers Liters/day
DPA (3) 1,246,000 462,000 1,708,000 6,110 557
ITAMBÉ 982,000 23,000 1,005,000 7,325 366
ELEGÊ 737,782 103,767 841,549 25,001 81
PARMALAT 388,117 203,730 591,847 4,400 241
CCL 254,057 106,067 360,124 4,388 158
EMBARÉ 250,867 55,382 306,249 2,380 288
LATICÍNIOS MORRINHOS
233,310 66,134 299,444 3,200 199
CENTROLEITE 258,195 10,073 268,268 5,049 140
SUDCOOP 234,876 31,385 266,261 5,998 107
CONFEPAR 210,543 51,690 262,233 6,152 94
BATÁVIA 224,561 0 224,561 4,019 153
LIDER ALIMENTOS 184,240 18,439 202,679 5,243 96
DANONE 134,575 61,824 196,399 605 608
GRUPO VIGOR 171,009 20,913 191,922 996 469
TOTAL 5,510,132 1,214,404 6,724,536 80,866 186
Source: Leite Brasil (2006).
Another fact that deserves attention in the Brazilian milk market is called the third
market or spot market. It refers to small companies or cooperatives that buy milk and resell
it to bigger companies. According to Gomes (2006), it is becoming very popular in Brazil,
because of the necessity of delivering bigger volumes of milk to processors in order to get
a good price. In addition, there is the modernization of the milk industry, which is very
costly for small companies.
In 2004, the reception of milk for spot market was 900,490 million liters,
corresponding to 19% of the total milk received by the industry. In big companies, such as
DPA, this volume was equivalent to 25% of the group, while for Parmalat it was 29%
(Gomes, 2006). According to Nogueira (2006), about 30% of the milk of the cooperatives
is sold on the spot market. In Santa Catarina, for instance, approximately 70% of the milk
of the cooperatives is sold on the spot market.
Another important fact related to milk industry is that the processors are not equally
São Paulo, Rio Grande do Sul, Goiás, and Paraná are responsible for 80% of the Brazilian
processed milk (Table 6).
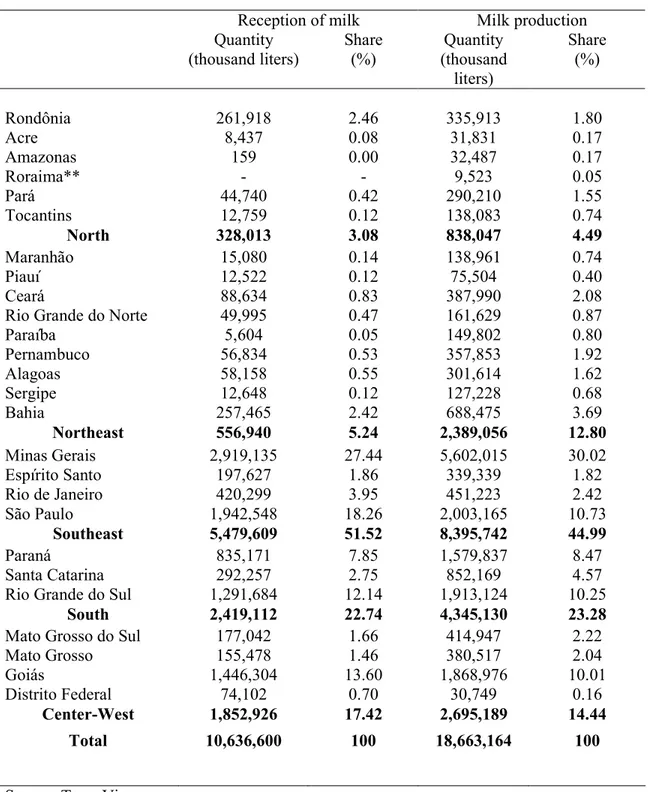
Table 6 – Production and reception of milk by the Brazilian states in 1997*.
Reception of milk Milk production Quantity
(thousand liters)
Share (%)
Quantity (thousand
liters)
Share (%)
Rondônia 261,918 2.46 335,913 1.80
Acre 8,437 0.08 31,831 0.17
Amazonas 159 0.00 32,487 0.17
Roraima** ' ' 9,523 0.05
Pará 44,740 0.42 290,210 1.55
Tocantins 12,759 0.12 138,083 0.74
34:< " $ " " $ $"$ !( ! !
Maranhão 15,080 0.14 138,961 0.74
Piauí 12,522 0.12 75,504 0.40
Ceará 88,634 0.83 387,990 2.08
Rio Grande do Norte 49,995 0.47 161,629 0.87
Paraíba 5,604 0.05 149,802 0.80
Pernambuco 56,834 0.53 357,853 1.92
Alagoas 58,158 0.55 301,614 1.62
Sergipe 12,648 0.12 127,228 0.68
Bahia 257,465 2.42 688,475 3.69
34:<81;: ' ! ! "$ ' $
Minas Gerais 2,919,135 27.44 5,602,015 30.02
Espírito Santo 197,627 1.86 339,339 1.82
Rio de Janeiro 420,299 3.95 451,223 2.42
São Paulo 1,942,548 18.26 2,003,165 10.73
3C:<81;: !( ' $ " (! !!
Paraná 835,171 7.85 1,579,837 8.47
Santa Catarina 292,257 2.75 852,169 4.57
Rio Grande do Sul 1,291,684 12.14 1,913,124 10.25
3C:< ! (! ! "! " " $
Mato Grosso do Sul 177,042 1.66 414,947 2.22
Mato Grosso 155,478 1.46 380,517 2.04
Goiás 1,446,304 13.60 1,868,976 10.01
Distrito Federal 74,102 0.70 30,749 0.16
8-:84& 8;: $ ' ( ! ' $ ! !!
3:19 '"' ' $ ''" '!
Source: Terra Viva.
* Fabrics with federal, state, or municipal inspection
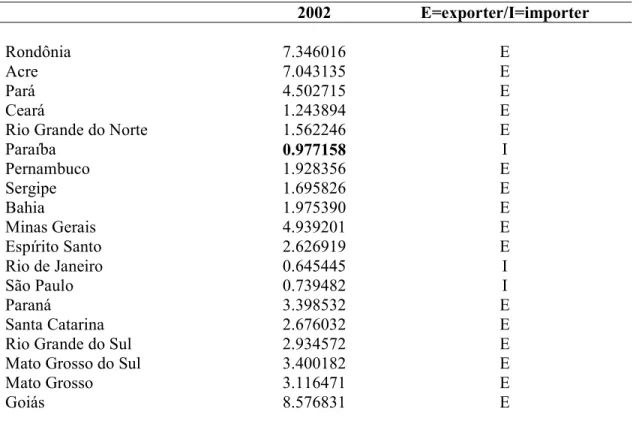
Table 6 is interesting, but it can be interpreted in various ways. The data about
reception may simply present the level of industrialization of each state. In this case, Minas
Gerais and São Paulo confirm their hegemony with 27% and 18%, respectively, in the total
milk received by processors. However, if we consider that there is a strong interstate trade
in milk, this first interpretation for the Table 6 may be wrong (Terraviva, 2006).
On the other side, the difference between the produced quantity and received
quantity may indicate the level of informality in each state. In this sense, it seems more
plausible to believe that the Northeast has a large quantity of informal milk processing.
However, one can see on Table 6 the importer or exporter capacity in each state. Therefore,
Rio Grande do Sul, Goiás, and São Paulo would be probably milk importers. This last one
clearly is a milk importer because of its huge consumer market (Terraviva, 2006). But,
utilizing only this table we cannot affirm anything about the milk industry. It would be
necessary to have a time series on exports and imports, and quantity of milk received by
the processors, which is unavailable in Brazil.
In relation of the retail, Neves & Consoli (2006) states that there were 71,951
groceries selling milk in Brazil in 2004. It means that 55% of the processed milk is traded
by the groceries and 13% by the bakeries. However, the big retailers can exert certain level
of local market power. On the other hand, Meireles (2003) affirms that because of the
" #
Studies about market analysis have become very popular in the academic
environment. In the competitive context of globalization of markets, studies about market
integration, law of one price, price transmission and others are quite important for the
understanding and proceedings in agricultural markets. So, in this section, we are going to
show the state'of'the'art market integration with the purpose of identifying the appropriate
theory and methodology for this work.
" <8348:,019 +82,-,:,3-; 1-+ 03-:43@84;,8; 1A3C: /14>8:
,-:8D41:,3-First of all, it is necessary to define some concepts related to market integration, as
market efficiency, transaction cost, Law of One Price, etc. However, the discordances in
this area are in a large scale. The controversies over market integration analysis began with
the definition of a market, as referred by Fackler & Goodwin (2000).
One of the first definitions of market was given by Cournot in 1838. Afterward,
prominent economists as Marshall (1947), Cassell (1918), and Stigler (1969) provided
different definitions. In this sense, Stigler’s definition seems more acceptable for the
academy. Stigler (1969, p. 85) relied on the idea that the market is “the area within which
the price of a commodity tends to uniformity, allowance being made for transportation
Nevertheless, the divergences do not stop at this point. Several meanings are given
for market integration. The mainstream in economics defines market integration as the
satisfaction of the Law of One Price (LOP) or as the existence of cointegration between
price series. But, McNew (1996) argued that market integration is a concept based more on
statistical criteria rather than on economic facts. Moreover, according to Li & Barrett
(1999), tests of the LOP are a test of the perfect integration hypothesis, not a test of
imperfect integration.
Monke & Petzel (1984), cited by Baek & Koo (2005), specified an integrated
market as those markets in which prices of homogeneous products move together, which is
similar to the concept of cointegration. On the other hand, Fackler & Goodwin (2000)
adopted the idea that market integration is a measure of the degree to which demand and
supply shocks in one region are transmitted to another.
For Barrett (2001, p. 20), “market integration represents the Walrasian transfer of
excess demand from one market to another as captured in actual or potential physical
flows”. This sight does not require that prices are equilibrated. Thereby, two regions can be
(imperfectly) integrated even if they are imperfectly competitive or inefficiently restricted,
if price in one region responds or not to shocks in the other, and if physical flow of the
good occurs or not between these locations (Li & Barrett, 1999). The last point is
interesting and was discussed by Stigler & Sherwin (1985), cited by Massey (2000). They
affirmed that the existence of trade flows between two areas is neither a necessary nor a
sufficient condition to conclude that markets are integrated. In areas where there is a large
flow of goods, price discrimination can lead to differences in prices between these markets,
and hence, to segmentation of the markets.
In contrast to Barret (2001) and following the neo'classical theory of the firm,
Goodwin & Djunaidi (2000) said that market integration does not occur if the prices in
geographically separated markets are not at equilibrium price. They also pointed out that
the price should be results of demand and supply forces in the output markets.
On the other hand, Fackler & Goodwin (2000) considered the following
hypothetical model for the price transmission ratio:
A A B
AB p
p
R
ε ε
∂ ∂ ∂ ∂
It represents a shock, εA, that shifts the excess demand for a good in region A but not in
the regionB. They affirmed that market integration is a measure of expectation of the price
transmission ratio. In this case, perfect integration happens when the expected price
transmission ratio equals one. Besides, it is affirmed that the ratio may not be symmetric
(i.e., RAB ≠ RBA) so that it is possible for one region to be more integrated with another
than vice'versa. In addition, if two regionsAand Btrade withC, they can be integrated as
strongly as if they were direct trading partners. It is not necessary for two regions to be
direct trading partners for a high degree of integration to be present. But it is necessary that
the regions are part of a common trading network.
On the other hand, a great number of studies asserted that for existing market
integration, the locations should present high price correlations. However, Gonzalez'
Rivera & Helfand (2001) interpreted that the existence of market integration is related to
two conditions. Firstly, the set of locations should be connected by a physical flow of
goods. It is necessary to ensure that arbitrage occurs, but by itself, it does not guarantee
market integration. Secondly, the prices between the regions should share the same long'
run information. In a cointegration framework, it is equivalent to requiring the existence of
one and only one integrating factor that is common to all series of prices3.
Gonzalez'Rivera & Helfand (2001) also distinguished three different concepts
within market integration, which include extension of market, pattern of integration and
degree of integration. Extension of market refers to geographic boundaries of the
integrated market. The pattern of integration is a measure of how the information contained
in the prices is transmitted among each region of the market. The degree of integration is
defined as the time of reaction so that the long'run relationship gets to absorb a shock in
the whole system.
Still related with market integration is the concept of market efficiency. Fama’s
efficiency definition refers to a market in which prices fully reflect available information
(Dahlgran, 2000). Notwithstanding, in some studies, market efficiency is taken as
synonymous of the spatial arbitrage condition. But, Barrett (1996) believed that market
integration is neither a necessary nor sufficient condition for market efficiency, because the
identity “price differences equal transfer costs” can be consistent with perfect competition,
monopoly or Pareto inferior trade. On the other hand, according to Facker & Goodwin
3The existence of just one integrating factor, as well as the explanations about cointegration will be better
(2000), failure to find market integration can indicate both breakdown in market
integration and market inefficiency.
Faminow & Benson (1990) also disagreed on the usual association with market
integration and efficiency market and perfect competition. They argued that market
integration can occur even in oligopoly or oligopsony. Moreover, Dahlgran (2000) pointed
out that markets that present either spatial or intertemporal arbitrage opportunities are
considered inefficient since reallocating resources away from low'priced locations to high'
priced locations will increase social welfare. Thus, in a spatial context, allocative
efficiency which requests that price differences between two points be less than or equal to
arbitrage costs, reflects a segmented market and not integrated market.
It is also important to discuss the concept of arbitrage. In accordance with Fackler
& Goodwin (2000), the arbitrage condition is the starting point for any model of spatial
price behavior and they also believed that market integration is a different concept from
arbitrage. Li & Barrett (1999) explained that arbitrage does not ensure long'run
competitive equilibrium. If markets are imperfectly competitive, whether due to
coordination between firms or market restrictions emplaced by government, profits may
persist.
So, arbitrage is a mechanism where the prices of a homogeneous good at any two
or more locations will differ by, at most, the cost of moving the good from the region with
the lower price to the region with the higher price. So, it can be noted that the concepts of
market integration, arbitrage and transaction or transportation costs are closely related.
Consequently, transaction costs have been a reason for controversies as well.
Following Fackler & Goodwin (2000), when transaction costs are high, they can
hinder market integration. They also believe that it is most real in developing countries,
where poor contract enforcement, inadequate policy protection, high taxes, inadequate
transport and problems with the communications infrastructure increase the transaction
costs. However, Miljkovic (1999) affirmed that, following the literature of spillover and
geographic concentration, the effects of distance on trade in spatial analysis of market are
" 1E 32 -8 4,08
The Law of One Price (LOP) is one of the most important theoretical concepts
associated with market integration. The LOP states that if there is trade between two or
more spatially separated regions and all profitable arbitrage opportunities are extinguished,
price differences are equal to transaction cost (Barrett, 2001). So, many of the previous
studies on market analysis were about LOP; however, the support for the LOP is limited,
especially in the short'run. Miljkovic (1999), for example, declared that there are a great
number of reasons for the failure of the LOP. Some of the most important reasons are
pricing'to'market4 (price discrimination), exchange rate risk, transportation costs, and
institutional factors that pressure price in different markets.
Sexton et al. (1991) affirmed that there is no support for the LOP when first,
regions are not linked by arbitrage, i.e., they represent autarkic markets. This point is
obvious because if there is no trade there is no arbitrage, and no support for LOP. Second,
there are impediments to efficient arbitrage such as trade barriers, imperfect information,
or risk aversion (Ravallion, 1983). Trade barriers are so common in international trades.
Imperfect information and risk aversion are factors present in every trade. Third, there is
imperfect competition in one or more of the markets (Stigler & Sherwin, 1985, and
Faminow & Benson, 1990). On the other hand, Fackler & Goodwin (2000) recognized that
LOP is more for traded than non'traded goods and it happens more in the long'run than in
the short'run period.
Ardeni (1989) wrote a classic paper about LOP. He analyzed LOP for a set of seven
commodities in four countries. He argued that denial of the LOP was due to econometric
shortcomings, like spurious regressions5, nonstatitonarity in the data, high serial correlation
and inappropriate use of first differences6. Then, in order to correct these shortcomings, he
used cointegration to test the long'run relationships. As a result, Ardeni (1989) reported a
lack of empirical support for the LOP as a long'run relationship. He pointed out that, in
4 Pricing'to'market is a form of imperfect competition in which exporters price discriminate across
destination markets and export prices depend on bilateral exchange rates (Krugman & Obstfeld, 2003).
5Spurious regression occurs when a correlation between data exists because of a statistical fluke, rather than
true causality.
6It is relevant to say that this kind of shortcoming happened because the cointegration methods became
this case, failures in LOP can be caused by institutional factors, high arbitrage costs,
measurements errors, imperfect information, explicit and implicit contracts, etc.
In a chronologic sequence, there is the work of Goodwinet al. (1990). According
to classical theory, if LOP holds contemporaneously, then price parity should hold
contemporaneously. Nevertheless, Goodwin et al. (1990) stated that this assumption
ignores the temporal elements of trade, i.e., it overlooks the fact that international
commodity arbitrage and trade occur over time. Moreover, they believed that there are
some shortcomings in the standard approach to testing the LOP such as (1) information
about transportation costs is hardly ever available and assuming that these costs are
constant is questionable, (2) the standard approach requires that commodity prices be
exogenous. This may be an error because the prices in two countries, for example, can be
determined simultaneously due to information sharing across markets, and that agents can
work in various markets at the same time, and (3) the standard LOP uses contemporaneous
domestic and foreign prices in the empirical analysis.
In order to treat these limitations, Goodwinet al. (1990) included expectations in
the analysis of LOP. They tested the LOP in international markets for U.S. agricultural
commodities (wheat, oilseed products, corn, and grain sorghum). For this, Goodwin et al.
(1990) employed two procedures. First of all, they made use of the generalized method of
moments (GMM) procedure and applied nonparametric tests of parity conditions. They
also utilized actual freight rates for wheat as a proxy measure of transaction costs. The
empirical results supported the hypothesis that the expectations'augmented version of LOP
is better than the standard version, but this outcome depends on the correct measurement of
transaction costs and delivery lags. According to Goodwin & Djunaidi (2000), transaction
costs are very important especially for goods that have a high relation between weight'
volume.
Therefore, Goodwin et al. (1990) and Mohanty et al. (1998) explored a new
methodology to evaluate if LOP holds in international commodity markets. They
experimented with fractional cointegration analysis to determine whether this method is
more appropriate than standard cointegration for validating the LOP. They believed that
LOP could have been falsely rejected in many studies both because factors such
transportation costs, price expectations, and market power were not taken into
consideration, or because the methods utilized were incapable of capturing the real
Mohanty et al. (1998) employed the same data used by Ardeni (1989), but made
use of fractional cointegrating, because they affirmed that weak empirical support for the
LOP is due to fact that the standard cointegration method is quite restrictive. Standard
cointegration determines if the order of integration of the equilibrium errors in two price
series add up to zero. This guarantees that the LOP holds. On the other hand, if the order of
integration is one, LOP is not supported. So, the advantage of fractional cointegration is
that it is able to discern long'run price behavior.
The results of Mohanty et al. (1998) confirmed that the fractional cointegration
supported the existence of LOP in the majority of analyzed cases. However, this result did
not differ very much from Ardeni’s. The difference between these two studies is that
Mohanty et al. (1998) found that some commodity price series were fractionally
cointegrated even if cointegration is rejected. It means that the results of Mohanty et al.
(1998) are not contradictory of the Ardeni’s. Just in the cases in that there is not full
cointegration Mohanty et al. (1998) established that markets still remain in a long'run
relationship.
In another study with the same data, Baffes (1991) considered that a malfunction of
the LOP would be caused by transportation costs. Therefore, with the objective to evaluate
this hypothesis, Baffes (1991) introduced a restricted cointegration test, i.e., he tested for
cointegration by taking the difference of two variables. In addition, the author utilized
tabulated “t'values”. These values were lower (in absolute terms) than the ones usually
used in cointegration regressions, because this work used known cointegration parameters7.
The results were, in most cases, unfavorable to the LOP. For the remaining cases, he
believed that the LOP did not hold because of transportation cost. Therefore, Baffes (1991)
tested whether freight rates were cointegrated with price differentials. The evidence
showed that the stationarity8of the freight rate series varied with the size of sample. So,
there was weak evidence of cointegration. Nevertheless, the author asserted that the
nonstationarity of the freight rates would be the main source of nonstationarity of the price
differentials. It is important to remember that transaction costs have components other than
freight rates. Therefore, freight rates may not be a good proxy for it. Furthermore, Baffes
(1991) believed that the nonstationarity of a tax/subsidy may cause the divergence from a
7For more details, consult Baffes (1991).
8According to Gujarati (2000), a series is consider stationary if its mean and variance are constant over the
long'run equilibrium and the heterogeneity of data can be another important factor to be
considered in future studies. Baffes (1991)’s conclusions are problematic because the
results suggest a negative relationship between prices.
Following the LOP approach, Asche et al. (2004) examined the relationship
between causality models and cointegration models in testing for the LOP. These authors
expected that the choice of modeling method depends on the time series properties of the
data. To illustrate this point, they studied the whitefish market in France. For this market,
the causality approach rejected the hypothesis of the LOP, while cointegration models
provided evidence for a well'integrated whitefish market.
" " <8348:,019 /3+89; 234 /14>8:
,-:8D41:,3-For the purpose of studying the market integration subject, economists have utilized
basically two models, the point'space framework of Takayama and Judge and the agents'
on'links model.
" " 3,-:&;7108 /3+89
The most common model used in studies about international or interregional trade
analysis is called the point'space trade model, developed by Takayama and Judge.
In this model, production and consumption regions are considered in separated
locations (points) and there is no intraregional transaction (i.e., all intraregional transfer
costs add up to zero). In addition, it associate market integration with market efficiency
and perfect competition, and regional boundaries are considered fixed. So, the satisfaction
of the spatial equilibrium condition in this case implies market efficiency (Barrett, 2001).
Besides, it assumes instantaneous price adjustment with no feedback and trade is neither
necessary, nor sufficient conditions for spatial equilibrium.
Then, the equilibrium condition of the point'space model considers the price
variables, transaction costs, and trade volume. Because of this, Barrett (2001) criticized
studies that utilize only the price variable in order to analyze market integration.
According to Barrett (2001), one shortcoming of the point'space model is that it
assumes continuous trade, while in real agricultural markets it is quite common that there
the fact that it considers market efficiency and perfect competition is also quite far from
reality.
On the other hand, McNew & Fackler (1997) contended that the point'space model
is adequate from cases, which many bulk goods are collected at a small number of points
and distributed, to a small number of major centers. It is true especially for gasoline, grain,
coal, and international trade, which involve ocean freight or tariffs imposed at the border.
" " D8-:;&3-&9,->; /3+89
The opposite of the point'space model, the agents'on'links models are more used to
model spatial oligopoly or monopoly situations (McNew & Fackler, 1997). It was
developed by Hotelling and Smithies and is built as a network structure with markets or
firms located at network nodes and consumers or commodity producers located along
network links. In this case, agents can choose to transact at the node by providing the best
price (McNew & Fackler, 1997).
According to McNew & Fackler (1997) in studies that utilized prices paid to
producers at the plant, the agents'on'links models would be more appropriate, since
agricultural products are generally produced in isolated rural areas, and in such cases, the
plants have local monopsony power. Besides, they believe that in a competitive
environment, one can use agents'on'links models when various plants are located at each
of the major distribution centers.
" " " :<84 19:84-1:,@8 /3+89;
Faminow & Benson (1990) offered an alternative theory assuming that agents of a
market are spatially distributed, and intraregional transportation cost exist and are
significant. In this case, spatial markets are characterized as oligopolistic/oligopsonistic
competition, and the regional boundaries are a function of relative prices. In this model,
arbitrage only guarantees that prices at different spatial buying sites will not differ by more
than the transport cost of shipping the product from one site to another. So, price
differentials do not necessarily have to be identical to transportation costs. Besides, spatial
competitors can price discrimate in order to invade a rival’s markets (Faminow & Benson,
1990).
On the other hand, Kawaguchiet al.,(1997) developed a model based on the point'
built for milk market in Japan, they added government intervention (payment quota) in the
model. However, when a competitive market is considered, this model is similar to the
Takayama'Judge model. Nevertheless, for the case of the Japan milk market, the authors
considered oligopolistic consignment sellers and many perfectly competitive small'scale
producers with pooled returns. For the purpose of comparing the results, they also tested
the competitive structure for the Japanese market. Therefore, the results were compatible to
the theory. It means that under perfect competition, more milk was transacted, and
consequently smaller prices occur than in an oligopolistic case.
" ! 8:<3+;F 1+@1-:1D8; 1-+ +,;1+@1-:1D8;
As it can be noted previously, there is a huge quantity of discordance in market
integration theory. Because of this, in recent years, a lot of work has been done in order to
identify the best methodology for capturing the interaction between markets and price
behavior. Thus, here we are going to review the evolution of the research along this line
and compare methods and results in order to identify the more appropriate methodology
for this work.
" ! 4,08
344891:,3-Most of the first works about market integration utilized the idea that the prices in
separated markets must be correlated. It is one of the most popular methods for measuring
market integration. Price correlations are a measure of co'movements of prices and a
typical bivariate correlation model can be expressed by:
t t jt
it P T e
P =β0+β1 +β2 + (2)
where Pit is the price in region i at time t for a homogeneous good; Pjt is the price in
region jat timet ; Tt is the transportation cost at time t between two regions and et is a
random error term. This is a version of a model introduced by Richardson (1978). In this
case, markets are taken to be perfectly integrated if β1 =β2 =1 and β0 =0.
long'run trends and other effects. Goletti & Christina'Tsigas (1995) and Fackler &
Goodwin (2000) believed that parallel movements in price can occur for several reasons
other than market integration. It happens mainly for agricultural commodities because
surplus and deficit seasons are common. So, in order to avoid some of these spurious
correlations, some studies preferred to employ price differences instead of price levels.
Even when utilizing price differences, price correlation studies have critics. Li &
Barrett (1999), for example, affirmed that co'movements between prices can occur due to
exogenous factors, such as inflation, population growth, seasonality or climatic conditions.
Then, the existence of price co'movement between spatial markets is not an indication of
market integration.
On the other hand, Jordan & VanSickle (1995) verified that the dynamic nature of
spatial price adjustment is ignored in price correlation models. In addition, they pointed out
the existence of other problems like simultaneity bias (since one of the prices should be
considered exogenous in the model) and bias from omitted variables.
Barrett (2001) also agreed with previous authors and added that the existence of
interseasonal flow reversals can lead to unreliable indicators and tests may overestimate
segmentation lags in information, delivery, or contract expiration. Besides, it is not
possible to verify the existence or nonexistence of heteroskedasticity common in price
series. Harris (1979), cited by Fackler & Goodwin (2000), introduced a number of other
shortcomings relative to price correlation. She stated that price discrimination could result
in correlation coefficients of 1, which indicates market integration. Another problem is
related to transaction costs. According to Fackler & Goodwin (2000), it is easy to show
that any value of a correlation coefficient can indicate integrated markets when transaction
costs are large enough to prohibit profitable trade and then permit independent variation of
price differences within the transactions cost band. Finally, it is important to remember that
all of the limitations inherent in the simple correlation coefficient approach are equally
applicable to the simple regression model.
" ! 1@199,3- /3+89
After price correlation models, some advances were made in order to improve the
market integration analysis. The Ravallion model is an interesting metodology. The
autocorrelation, distinguishes short'run and long'run dynamics, and can consider common
inflationary and seasonal components (Barrett, 2001).
The basic Ravallion model had the form
ij i it n
j
j t ij n
j
j it ij
it a P b P X c e
P =
∑
+∑
+ += − =
− 0
1 1
(3)
where Pit refers to the price in theith local (urban) marke in timet; P1 refers to the price in
a central market; X refers to the vector of other influences (inflation, seasonal dummies)
and the e’s are white noise error terms. This model assumes that the shock in prices
originate in a central market. However, the Ravallion model does not incorporate
interseasonal flow reversals and direct links between markets. Besides, it is assumed that
transaction costs are constant, i.e., additive or proportional (Barrett, 2001). Structural
complexities led this model to disuse.
Jordan & VanSickle (1995) made use of Ravallion’s model for evaluating the U.S.
winter market for fresh tomatoes. According to the authors, this model had the advantage
of distinguish among market segmentation, strong short'run market integration, weak
short'run market integration, and long'run market integration. Because of this, Jordan &
VanSickle (1995) used a two'stage least squares model in restricted and unrestricted forms,
and Granger causality. They applied Granger causality in order to verify the hypothesis of
price leadership. As a result, they concluded that Florida and Mexico were integrated in the
same market, but Florida appeared as a leader in the fresh tomato price formation process.
" ! " E,:0<,-D 48D,/8 /3+89
Switching regime models compare observed price differentials with observed
transportation costs, estimating the probability (i.e., function of distribution of probability)
that markets are in competitive equilibrium (Li & Barrett, 1999). The most common
switching regime models are the Parity Bounds Model (PBM), Barrett'Li Method (BLM),
Sexton, Kling and Carman Model (SKC) and Pricing'to'market (PTM) model. They are
very similar in structural form and differ only in a few details.
This kind of model eliminates the problems of discontinuous trade, time varying
and potentially nonstationary transaction costs that perturb other price analysis methods.
account for the multiple regimes that may be a result from transaction costs (Goodwin &
Piggott, 1999). However, these models provide only static comparisons. Moreover, they
presuppose serial dependence of price and transaction costs and are sensible to underlying
distributional assumptions.
So, Li & Barrett (1999) said that the results of PBM are suspect, because the
markets are considered to be integrated even when there is no physical trade flow of goods
and no transmission of price shocks between two locations. In addition, they affirmed that
PBM does not make use of trade flow data, which means that it studies only equilibrium
conditions, not integration. Then, in their analysis, Li & Barrett (1999) extended PBM
through complementary trade flow data.
Li & Barrett (1999) introduced a market analysis methodology based upon
maximum likelihood estimation combined with a distribution model incorporating price,
transfer costs, and trade flow data. According to these authors, this model differentiated
between market integration and competitive market equilibrium. Besides, the model
provided intuitive measures of inter'market tradebility, competitive market equilibrium,
perfect integration, segmented equilibrium, and segmented disequilibrium.
Li & Barrett (1999) believed that other market analysis price models were biased,
since they assumed trades are continuous or unidirectional, and transaction costs were
stationary. However, the opposite of these assumptions take place regularly. Therefore,
they used data including bidirectional and discontinuous trades and nonstationary
transaction costs to analyze the soybean meal market among Pacific Rim economies.
Nevertheless, the problem of the Li & Barrett (1999) model is that it is static and does not
answer simple questions about the market such as speed of adjustment or extension of
convergence to tradebility of equilibrium.
In addition, according to Rashid (2004), the bivariate nature of the PBMs can result
in wrong inferences about the multivariate environment of market integration. Besides this,
the author affirmed that the PBM is incapable of analyzing market integration in the
absence of trade flow data. This last point is very interesting, since this kind of data is so
difficult to obtain.
On the other hand, the SKC is known for the following advantages, which include
(1) it eliminates the necessity of choose arbitrarily the price in one region, (2)
transportation costs are estimated inside of the model, (3) the model considers that, due to
arbitrage, the regions can be integrated in some periods, but not others, which makes