B A S E
Biotechnol. Agron. Soc. Environ.2000 4(4), 259–262
Calculation on the impacts of forestation, afforestation and
reforestation on the C-sequestration potential in Belgian
forests ecosystems
Dominique Perrin
(1), Michaël Temmerman
(2), Éric Laitat
(1)(1)Unité de Biologie végétale. Faculté universitaire des Sciences agronomiques de Gembloux. Avenue de la Faculté, 2A. B–5030 Gembloux (Belgique). E-mail : [email protected]
(2)Département de Génie rural. Centre de Recherches agronomiques de Gembloux. Chaussée de Namur, 146. B–5030 Gembloux (Belgique).
Belgium submitted two National Communications (NC) to the UNFCCC: NC1 in January 1997 and NC2 in August 1997. The Belgian climate policy is formulated at the federal level, requiring co-operation between regional and federal administrations. Around a fifth of the total area of Belgium is covered by forests. Around 80% of the productive forests are in the Walloon region. Reported values for LUCF categories give a potential of 2,057 kt eq. CO2.y-1. Given the existing Regional Forest Inventories (RFI): RFI1 for 1984 and RFI2 for 1999, an estimate has been made to consolidate reported data. Afforestation, deforestation and reforestation activities are calculated according the IPCC special report on land use, land-use change and forestry. Keywords.Forest inventory, C-sink, C-accounting, Belgium.
1. INTRODUCTION
Belgium ratified the United Nation Framework Convention on Climate Change (UNFCCC) on 16 January 1996. The Regions (Flanders, Brussels Capital and Wallonia) have responsibility for these matters. The Federal State is responsible for environmental questions of a general nature and reports to the UNFCCC. Belgian climate policy is formulated through an extensive consultative process, with the involvement of all the key agents through the mechanisms of inter-ministerial conferences and working groups under the umbrella of the Ministry for Social Affairs, Public Health and the Environment
(MSAPHE)1. The National Communications (NC) are
prepared by its Greenhouse Effect Co-ordination Group. The NC1 was send in January 1997 (MSAPHE, 1997a) and the NC2 in August 1997 (MSAPHE, 1997b). At the beginning of 1997, a decision was taken to give regions the political mandate to negotiate. Given the complex distribution of these responsibilities, strenghtening of the co-ordination and cooperation between regions and the Federal State is required.
Belgium has a temperate maritime climate, with
moderate temperature variability, prevailing westerly winds, heavy cloud cover and regular rain. The area under agricultural production represents about
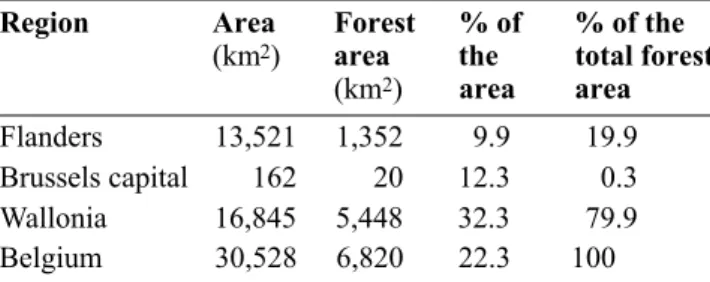
13,560 km2. The distribution of forests in Belgium is
shown in table 1.
2. REFERENCE VALUES FOR GREENHOUSE GAS INVENTORIES
The most important greenhouse gas of anthropogenic origin – as far as quantities emitted are concerned – is
CO2. The total emissions for energy, industry and
waste, for the base year 1990 in Belgium, amount to
113,997 kt.y-1and were reported as 126,288 kt.y-1for
1997 (MSAPHE, 1999).
Both NC 1 and 2 reported “Changes in forest and
other woody biomass stocks” (5A) as –2,057 kt.y-1
“Wood growth” (5D1) as –7,126 kt.y-1 and “Wood
harvest” (5D2) as 5,070 kt.y-1. The same figures were
Table 1.Forest cover in Belgium.
Region Area Forest % of % of the
(km2) area the total forest (km2) area area
Flanders 13,521 1,352 9.9 19.9
Brussels capital 162 20 12.3 0.3
Wallonia 16,845 5,448 32.3 79.9
Belgium 30,528 6,820 22.3 100
1In French: Ministère des Affaires sociales de la Santé publique et de
l’Environnement (MASSPE).
260 Biotechnol. Agron. Soc. Environ. 2000 4(4), 259–262 D. Perrin, M. Temmerman, É. Laitat
used for all the years under consideration (from 1990 until 1996) because the statistics underlying these calculations were not available. It can be deduced
from these data that the annual net CO2fixation is only
equivalent to 1.7–1.8 % of the annual anthropogenic
CO2emissions.
Apart from the calculation of the annual net CO2
fixation based on statistical data in accordance with the calculation method proposed by the IPCC (1997), a vegetation model of the Montheith type (Belfix), which had been calibrated with remote sensing data,
has also been applied for 1990 (Veroustraete et al.,
1994). The model calculates the annual net CO2
fixation by all vegetation types and gives an estimate
of 1,837 kt.y-1. The difference of 10% compared with
the results obtained with the IPCC method assumes that the Belfix method, in which the model is calibrated with measured data, provides a more accurate calculation than the IPCC method, which relies on statistics and averaged factors.
3 . WORKING GROUP 1 RELATED A C T I V I T I E S (Inventory of C sinks and sources)
The Walloon Forest Inventory was set up as a permanent process by decree of the Wa l l o o n government (Moniteur Belge, 1995). The first inventory was conducted between 1980–1984 at the University of Gembloux (Lecomte, Rondeux, 1994). The inventory is drawn up by sampling to determine the surfaces by categories of property (Private or Public: State, Province, Community), type of forest, species, age, size and quality. It also provides estimates of the volume of standing timber and of the growth of these volumes, harvests and future potential yield for species of economic relevance. The sampling
points are selected according to a 1,000 m×500 m
grid directed from the East to the West on the National Geographic Institute maps at a scale of 1/25,000. Each grid intersection, located in the forests according to the map, is subject to measurement in the field.
If we consider that the Walloon forest area is about 550,000 ha, the sampling strategy includes around 11,000 measurement points (1 point per 50 ha). The rectangular grid has the advantage of going against the orientation of the relief elements oriented along a SW– N W axis and against ecological and geological gradients predominant in the N-S orientation.
A ten-year period was adopted to carry out all the measurements. In order not to favour a given region, it was decided to cover the whole territory each year. The grid sampled each year is always the same as the previous years. By increasing the number of sampling points by 10% each year, the original mesh is narrowed from year to year: 1 measurement per 500 ha
in 1994, the first year of the inventory, to 250 ha in 1995, to 100 ha in 1999, etc.
The sample plots are circles of 10 ares, for which the following information is collected: administrative data, topography, soil and vegetation, age, circumference at 1.5 m, total and dominant heights, commercial quality for broadleaf species bigger than 120 c m circumference, and as qualitative information: the regeneration technique, structure and development stage, quality, damage caused by game and the health and condition for harvest. For plots with edges or borders, the plot centre is moved towards the inside of the plantation.
The first forest inventory was completed in 1984, using a slightly different protocol than the one described here. By the end of 1999, 50% of the sample points of the second inventory had been measured, the data presented here represents a mesh of 100 ha over the whole territory. Walloon Forest Inventory data were processed using the conversion factors listed in t a b l e 2. We have fitted a linear regression between 1984 and 1999 to derive the values for the reference year presented in table 3.
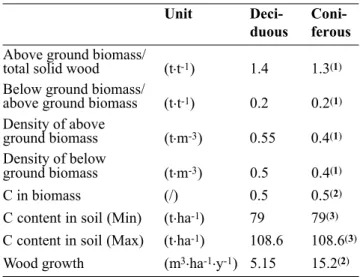
The carbon stocks in the biomass, as given in t a b l e 4, are calculated using the forest inventories and the conversion factors presented in t a b l e 2. Figures for soil carbon content in the Walloon forest soils date back to the sixties – seventies. We preferred using reference
values for France (79 t C.ha-1, as a minimum value)
and Germany (108.9 t C.ha-1as a maximum value) as
given in Arrouays et al., (1999) and Dupouey et al.,
(1999), in order to demonstrate the range and uncertainty.
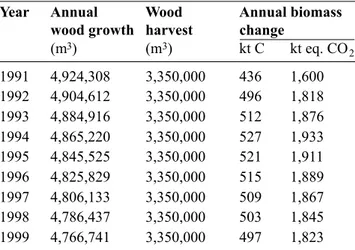
Ta b l e 5 gives the annual potential carbon sequestration, according to the IPCC methodologies
Table 2.Conversion factors used to derive forest inventory data for deciduous and coniferous forests, their units and sources.
Unit Deci-
Coni-duous ferous
Above ground biomass/
total solid wood (t.t-1) 1.4 1.3(1) Below ground biomass/
above ground biomass (t.t-1) 0.2 0.2(1) Density of above
ground biomass (t.m-3) 0.55 0.4(1) Density of below
ground biomass (t.m-3) 0.5 0.4(1)
C in biomass (/) 0.5 0.5(2)
C content in soil (Min) (t.ha-1) 79 79(3) C content in soil (Max) (t.ha-1) 108.6 108.6(3) Wood growth (m3.ha-1.y-1) 5.15 15.2(2)
Source: (1) (FAO/CEE, 1986); (2) Lecomte (personal
Belgian country report to COST E21 261
(IPCC, 1997) and our working hypothesis of a linear trend in forest areas and overall biomass increase between 1998 and 1999. A distinction was made between the deciduous and coniferous species allocation respectively 5.15 and 15.2 m3.y- 1.h a- 1. Lecomte (personal communication) extrapolates the annual solid wood harvests for harvests in the public
forests and gives an estimate of 3,350,000 m3. No
statistics were considered acceptable, whether from the National Statistics Institute, the Ministry of Economic Affairs, the wood industry unions or the trade sector.
Lecomte (personal communication) also estimates afforestation of agricultural land in the IPCC sense to be around 500 ha annually. Basing on forest inventories, we estimate land-use change to be around 149 ha and reforestation in the FAO sense around 4,000 h a a n n u a l l y. Ta b l e 6gives afforestation (A), deforestation (D) and reforestation (R) impacts on changes in C-sequestration according to the IPCC special report on
land use, land-use change and forestry (Watson et al.,
2000).
4. CONCLUSIONS
An estimate of 1,823 kt eq. CO2 change in forest and
other woody biomass stocks, limited to the Walloon
Region, should be compared to the 2 ,057 kt eq. CO2
as reported for the whole territory in the NCs. ARD activities, as calculated here, induce a very small change in the C stocks in the Walloon forests. Referring to the 1990 base year, ARD increase the C-sequestration potential by a maximum of 2,009 kt over the commitment period 2008–2012, say 1.6% of the 1997 emissions.
Acknowledgement
This study was carried out in the framework of the project “Carbon sequestration potential in the Walloon forest” (1999–2000). We are greatly indebted to Ir Hugues Lecomte and Ir Christian Laurent, Directorate-General for Natural Resources and Environment (DGRNE) for having provided us with the most recent data on the forest inventory in the Walloon region.
Bibliography
A r r o u a y s D., Deslais W., Daroussin J., Balesdent J . , G a i l l a r d J., Dupouey J., Nys C., Badeau V., Belkacem S . (1999). Stocks de carbone dans les sols de France. Quelle estimation ? C . R. Acad. Agric. Fr. 8 5 ( 6 ) , p. 278–292.
Table 3.Forested areas in the Walloon region, productive areas and solid wood volumes, based on the 1984 forest inventory (completed grid of 50 ha) and the 1999 forest inventory (50% of the sample points, grid of 100 ha) and estimates for 1990, the reference year using a linear regression.
Year Forested areas (ha) Productive areas (ha) Solid wood volumes(m3)
Total Deciduous Coniferous Total Deciduous Coniferous
1984 539,539 495,839 248,186 247,653 95,487,395 50,195,870 45,291,525
1990 541,643 488,623 249,032 239,592 104,385,677 53,906,842 50,478,835
1999 544,800 477,800 250,300 227,500 117,733,100 59,473,300 58,259,800
Table 4.Carbon stocks in the Walloon forest ecosystems.
Year (t) Carbon in Carbon in soil total biomass
(t.ha-1) (t.ha-1)
(1) (2) Min Max
1984 36,970,077 75 69 42,623,581 58,593,935 1990 40,277,010 82 74 42,789,829 58,822,473
1999 45,237,409 95 83 43,039,200 59,165,280
(1)Productive areas; (2)total forested areas
Table 5.Annual carbon sequestration potential in the Walloon forests according to the IPCC methodology.
Year Annual Wood Annual biomass
wood growth harvest change
(m3) (m3) kt C kt eq. CO
2
1991 4,924,308 3,350,000 436 1,600
1992 4,904,612 3,350,000 496 1,818
1993 4,884,916 3,350,000 512 1,876
1994 4,865,220 3,350,000 527 1,933
1995 4,845,525 3,350,000 521 1,911
1996 4,825,829 3,350,000 515 1,889
1997 4,806,133 3,350,000 509 1,867
1998 4,786,437 3,350,000 503 1,845
262 Biotechnol. Agron. Soc. Environ. 2000 4(4), 259–262 D. Perrin, M. Temmerman, É. Laitat
D u p o u e y J., Pignard G., Badeau V., T h i m o n i e r A., Dhôte J . , Nepveu G., Bergès L., Augusto L., Belkacem S., Nys C. (1999). Stocks et flux de carbone dans les forêts françaises. C. R. Acad. Agric. Fr.85(6), p. 293–310. FAO; CEE (1986). Les ressources forestières de la région
de la CEE. Paris: Nations Unies.
IPCC (1997). Revised 1996 IPCC guidelines for national g reenhouse gas inventories. Genève: Interg o v e r n e m e n t a l Panel on Climate Change.
L e c o m t e H., Rondeux J. (1994). L’inventaire forestier régional wallon. Brève présentation méthodologique. Silva Belg.101(6), p. 9–16.
MSAPHE (1997a). First Belgian national communication under articles 4 et 12 of the convention (unofficial t r a n s l a t i o n ). <http://www. e n v i r o n m e n t . f g o v. b e /R o o t / tasks/atmosphere/klim/pub/natcom/set—fr.htm>. MSAPHE (1997b). Second Belgian national communication
under articles 4 et 12 of the convention.Update of the first communication (unofficial translation). <http://www. e n v i r o n m e n t .f g o v. b e / R o o t / t a s k s / a t m o s p h e r e /k l i m / p u b / natcom/set-fr.htm>.
MSAPHE (1999). Inventory of greehouse gas emissions in Belgium 1990–1996/1997. Brussels: Ministère des A ff a i r e s sociales, de la Santé publique et de l’Environnement.
<http://www.environment.fgov.be/Root/tasks/ atmosphere/klim/pub/natcom/1999_en.pdf>.
Moniteur Belge (1995). Décret modifiant la loi du 19 décembre 1854 contenant le Code forestier et instaurant un inventaire permanent des ressources ligneuses, du 6 février 1995, published 4 july 1995. Monit. Belg. (08801).
Ve r o u s t r a e t e F., Patyn J., Myneni RB. (eds.) (1994). Forcing of a simple ecosystem model with FAPAR and climatic data to estimate regional scale photosynthetic assimilation. Vegetation, modelling and climatic change effects. In P roc. VITO-UIA. Antwerpen (Belgium), 25–26 February 1993. The Hague: SPB Academic Publishing, p. 151–177.
Wa t s o n R., Noble I., Bolin B., Ravindranath N., Ve r a r d o D . , Dokken D. (eds.) (2000). Land use, land-use change, and forestry. Special report of the Intergovernmental panel on climate change. Cambridge, UK: Cambridge University Press, 375 p.
(11 ref.) Manuscript received 3 October 2000 Table 6.Impacts of afforestation (A), deforestation (D) and reforestation (R) on changes in C-sequestration Article 3.3 of the Kyoto protocol.
Art. 3 3 Def Accounting Type a1 VarC1 a2 VarC2 acp VarCcp
Framework (ha) (kt C) (ha) (kt C) (ha) (kt C)
A IPCC Activity based Min 2,500 8 4,500 23 11,000 127
R Max 2,500 15 4,500 45 11,000 253
A FAO Activity based Min 2,500 8 4,500 23 11,000 127
Max 2,500 15 4,500 45 11,000 253
R FAO Activity based Min 20,000 60 36,000 180 88,000 1,012
Max 20,000 120 36,000 360 88,000 2,024
D IPCC/FAO Activity based Min -746 -58 -1,343 -106 -3,284 -253
Max -746 -65 -1,343 -120 -3,284 -268
Total IPCC Min 1,754 -50 3,157 -84 7,716 -127
Max 1,754 -50 3,157 -75 7,716 -15
FAO Min 21,754 10 39,157 96 95,716 886
Max 21,754 70 39,157 285 95,716 2,009