ABSTRACT: In the last few decades, many forests have been cut down to make room for culti-vation and to increase food or energy crops production in developing countries. In this study, carbon sequestration and wood production were evaluated on afforested farms by integrating the Gaussian diameter distribution model and exponential diameter-height model derived from sample plots of an afforested hardwood forest in Taiwan. The quantity of sequestrated carbon was determined based on aboveground biomass. Through pilot tests run on an age-volume model, an estimation bias was obtained and used to correct predicted volume estimates for a farm forest over a 20-year period. An estimated carbon sequestration of 11,254 t C was ob-served for a 189ha-hardwood forest which is equivalent to 41,264 t CO2. If this amount of carbon dioxide were exchanged on the Chicago Climate Exchange (CCX) market, the income earned would be 821 US$ ha–1. Carbon sequestration from rice (Oryza sativa) or sugarcane (Saccharum officinarum) production is discharged as a result of straw decomposition in the soil which also improves soil quality. Sugarcane production does not contribute significantly to carbon seques-tration, because almost all the cane fiber is used as fuel for sugar mills. As a result of changing the farming systems to hardwood forest in this study area, carbon sequestration and carbon storage have increased at the rate of 2.98 t Cha–1 year–1. Net present value of afforestation for a 20-year period of carbon or wood management is estimated at around US$ 30,000 given an annual base interest rate of 3 %.
Keywords: Taiwan, plantation on farm land, carbon capture and storage, aboveground biomass, forest management
Received November 05, 2011 Accepted October 31, 2012
Comparison of carbon sequestration potential in agricultural and afforestation
Chinsu Lin*, Chun-Hsiung Lin
Introduction
Land use has changed around the world in the last few decades. Many forests have been cut down to make room for cultivation and to increase food or en-ergy crops production in developing countries. One ex-ample is the Ex-Mega Rice Project (EMRP) in Indonesia where an area of around 146 million ha of peat swamp forest was converted to rice (Oryza sativa), palm (Elaeis guineensis)-oil production and settlement in the 1980s (Galudra et al., 2010). In addition, many agricultural lands are left fallow and not used for food production in some developed countries due to local development and free trade agreements. Agricultural lands are believed to be a major potential carbon sink to absorb large quanti-ties of carbon if trees are reintroduced with judiciously managed crops and/or animals (Albrecht and Kandji, 2003). Thus, the importance of agroforestry systems (AFS) is the land-use management. AFS has been proved to improve broader-level ecosystem services, includ-ing water quality enhancement, soil improvement, and carbon sequestration. The relative newness of research in environmental quality and AFS will pose additional challenges in the future, including the determination of tree-biomass, establishment of standardized norms in soil sampling depth, and resolutions for issues regarding limits of fixed-effect models (Nair, 2011).
The Kyoto Protocol is an international environ-mental treaty and requires ratified countries to commit
themselves to an appropriate reduction of greenhouse gases (GHG), which contributes to global warming and potentially impacts human society in many ways. In con-trast to reduce GHG by industrial sectors, afforestation on fallow farm land has obviously become an important alternative method to expand the potential pool of car-bon stock in terrestrial ecosystems. The Forestry Bureau in Taiwan (TFB) adopted an afforestation policy to en- adopted an afforestation policy to en-an afforestation policy to en-courage farmers to plant trees on fallow land starting 2002, particularly on unused crop and sugarcane farms. To answer Nair’s statements in 2011, the main purpose of this paper is to integrate the allometric parameters-based single tree growth model and stand structure mod-el in order to achieve three main objectives: measure-ment of the potential aboveground biomass and carbon stock of afforestation hardwood forest, evaluation of the carbon sequestration ability of the afforested farming system and the traditional paddy/sugarcane farming sys-tem, and prediction of the productivity and economic potential of hardwood farms.
Materials and Methods
Figure 1 shows a flowchart of the methods used in this study. In this figure, a crop farming system is also in-cluded to enable economic comparison of crop farming and forestry management. This study is only concerned with the present value of woods and/or crop products and the market value of carbon. A detailed cost/benefit National Chiayi University – Dept. of Forestry and Natural
Resources, 300 University Road – 60004 – Chiayi – Taiwan. *Corresponding author <chinsu@mail.ncyu.edu.tw>
analysis, including factors such as the opportunity cost of land use and marginal benefits are not considered.
Site description and sampling design
The studied afforested area has 188.59 ha and is located in Baihe Township, Tainan City, in southern Tai-wan which is centered at 23°19’47’’ N and 120°25’44’’ E. The average altitude of the study site is 37 m a.s.l and average annual precipitation and temperature are 1759.74 mm and 23.5 °C, respectively. Summer is usu-ally rainy in this area.
More than ten tree species at the farm (Baihe Farm) are planted in the early spring of 2002. Fraxinus formosana and Melaleuca leucadendron are the major spe-cies. The plantation area of these two species is 48.23 ha and 32.29 ha respectively. They occupy 43 % of the total area of the farm. Some other minor species are also pres-ent, for example Terminalia bovivinii, Melia azedarach, Zelkova serrata, Camphora formosana, and Liquidambar formosana, whose plantation area varies from 3 to 10 ha. Because the shape and size of the afforested regions in the farm are irregular, the sample plots used to make the forest inventory have variable dimensions of 50 × 50 m, 30 × 30 m, and 20 × 40 m representing areas of 0.25 ha, 0.09 ha, and 0.08 ha respectively. As a result, 24 plots ac-counting for 5.03 ha of the plantations were included in the forest inventory. The sampling inventory was carried out during Jul., 2008. The trees in the study site were considered to be eight years old after taking into account complete growing seasons and seedling age.
Calculation of individual volume
This study developed specific volume models (Eqns. 1-3) for Fraxinus formosana, Terminalia boivinii and Melia azedarach, respectively, based on the inven-tory data. The trunk volume for other species was de-termined using Eqn. (4) which was suggested for general use in determining the volume of broadleaf trees. Math-ematically, tree volume is calculated using a cylindrical
model, with a shape factor (f) of 0.45 representing the taper coefficient of the broadleaf tree stems. The param-eters DBH and H represent the tree diameter at breast height (in centimeters) and total height (in meters) of a tree. The volume models were used to determine a cubic meter unit of stem volume (V).
V = 0.0000280927 × DBH1.231 × H1.693 (1)
V = 0.0000199357 × DBH1.902 × H1.250 (2)
V = 0.0000438384 × DBH1.897 × H0.965 (3)
f DBH × × ×
= H
40000 V
2 π
(4)
Estimating volume growth stock in an eight year old forest stand
Estimating plantation volume involves a three-step process. First, the DBH structure or frequency (F) of the sample plots were fitted to a Gaussian PDF (probability distribution function) model (Eqn. 5) to derive a model representing the frequency of the stem diameter per hectare. Second, the DBH values were regressed with the total height of the sample trees in an “exponential rise to maximum” model (Eqn. 6). Third, the volumes of individual tree stems were determined using Eqns. (1-4) and summed to obtain the total stock volume per hectare for each species. Finally, the total stock volume of the afforested area was calculated based on the plan-tation area for each species.
−
−
×
=
2 0
5
.
0
exp
b
x
x
a
F
(5)H = y0 + a × (1 – exp(–b × x)) (6)
Predicting growth stock in the forest stand over 20 years
An age-volume estimation model (Eqn. 7) that uses tree age (A) as the regressor was used to predict the stock volume for an eight year old forest (Vm). The estimate was then used to derive an adjustment factor (E) for the age-volume model. This factor indicates the estimation bias when using the age-volume model in the predic-tion of volume stocks of the forest stand. So, the volume estimate should be adjusted so that it approaches the real value using the factor E. In this way, the volume estimate for the 20 year old hardwoods was determined. A survival probability of 70 % after 20 years was as-sumed in comparison to the original plantation density. In Eqn. (8), the percentage adjustment factor E can be determined using the measured volume (Vr) and the estimated volume (Vm) obtained from the age-volume model.
Vm = –0.00009 + 0.0047 × A + 0.00008 × A2 (7)
% 100
(%) ×
−
=
r r m
V V V
E (8)
Aboveground Biomass and carbon content estimation The carbon content of the forest was estimated using Eqn. (9), which is a modification of the IPCC (In-tergovernmental Panel on Climate Change) method (Pen-man et al., 2003) that has been successfully applied to carbon estimation by Lee et al. (2000), Lin et al. (2002), Lee et al. (2004), and Wu et al. (2005). In Eqn. (9), the total carbon in aboveground biomass (C) is the product
of volume (V, m3 ha–1), basic wood density (D), biomass
expansion factor for the conversion of volume to above-ground tree biomass (BEF
2), multiplied by the carbon
fraction of dry matter (CF, tonnes C).
C = (V × D × BEF2) ×CF (9)
The total forest volume was determined following the method used by Brown et al. (1986), Sedjo (1989), and Winjum et al. (1998). This study used a 1.65 expanding coefficient for restoring whole volume. The aboveground biomass was determined by multiplying the volume by the wood density. Wood densities for Cinnamomum cam-phora, Swietenia macrophylla, Zelkova serrata, Melaleuca leucadendron, Melia azedarach, Fraxinus formosana and Terminalia boivinii are 0.395 g cm–3, 0.490 g cm–3, 0.687 g
cm–3, 0.600 g cm–3, 0.498 g cm–3, 0.664 g cm–3 and 0.421
g cm–3. An average density of 0.536 g cm–3 was used for
the other hardwoods growing at Baihe Farm since the individual wood densities of these woods was not avail-able in the literature. Lin et al. (2002) demonstrated that some hardwoods have dry biomass carbon fraction (CF) ranging from 45 -48 % and suggested an average of 46.91 % as being suitable for application. Following this sug-gestion, this study used 46.91 % in determining the car-bon content of the forest.
Results
Diameter structures and height models of the Bie-he Farm Forest
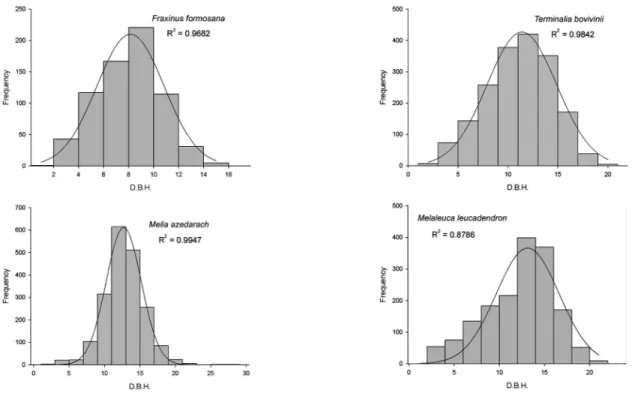
The study site yielded 24 samples of four domi-nant tree species, namely Fraxinus formosana, Melia azedarach, Terminalia bovivinii, and Melaleuca leucaden-dron. A Gaussian probability distribution function was applied to fit the DBH data for each of the dominant species. Figure 2 shows the fitted Gaussian model for each species. An ANOVA test was applied to examine the estimated coefficients. Each coefficient is significant at the 0.01 probability level, indicating that the hardwood forest in the cultivated land exhibited a normal diameter distribution. Additionally, the total tree height (y) is re-gressed with the DBH (x) to fit an exponential growth
model to represent the influence of diameter growth on height growth. Results are shown in Figure 3 and listed in Table 1. The R2 of the regression models suggests that
the models are able to explain 50-68 % of the variation in tree height.
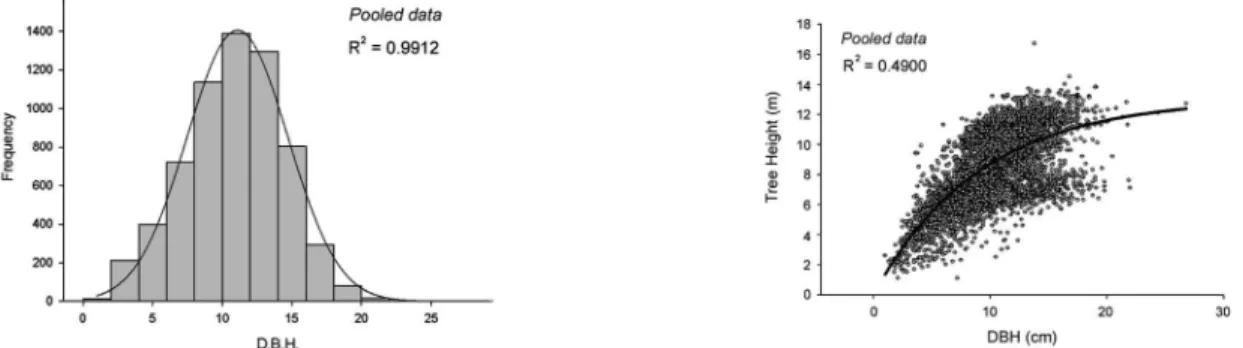
Sample data from the four dominant species and additional sample plots of the remaining six species were integrated and re-fitted to obtain a DBH Gaussian PDF model for Baihe Farm forest, and furthermore were fitted with an exponential growth model (Figure 4). The integrated regression model has a coefficient of deter-mination of 0.4900 (Table 1) and testing demonstrates the regression coefficients to be significant at 0.05 prob-ability level.
Estimation bias of the age-volume model of Liu and Wu
The total volumes of the inventoried four species (Fraxinus formosana, Melia azedarach, Terminalia bovivinii,
Table 1 – Tree height models for the tree species in Baihe Farm forest.
Speicies name Equations R2 P-value
Fraxinus formosana y = 9.5054(1-exp(-0.1558x)) 0.4958 <0.0001
Melia azedarach y = -3.8192+16.1710(1-exp(-0.2148x)) 0.6277 <0.0001
Terminalia bovivinii y = 13.4173(1-exp(-0.0997x)) 0.6765 <0.0001
Melaleuca leucadendron y = 7.9809(1-exp(-0.1462x)) 0.5511 <0.0001
The other species y = 13.055(1-exp(-0.1099x)) 0.4900 <0.0001
Figure 3 – Empirical exponential DBH (diameter at breast height)-height models of the stands for the four chosen dominant species in Baihe Farm forest. The P-value of the regressions is less than 0.0001 indicating that the models are statistically significant and could be applied for height prediction using DBH.
Table 2 – Estimation bias of the model based on the 8-years samples for different species.
Four major species Pooled data
Vr: Unitary volume stock (m3 ha–1) 54.70 58.11
Vm: Age-volume model estimation (m3 ha–1) 52.22 52.52
Bias (%) -4.53 -9.62
Melaleuca leucadendron) stands was 218.81 m3, and
aver-aged 54.70 m3 ha–1 (Vr). An age-volume model was used
to estimate individual stem volume taking tree age as a reference. This study used the total number of individu-al stems as a multiplier N to determine a unitary planta-tion volume using the age-volume model (Vm) where N estimates for each of the selected species are determined by their Gaussian PDF models. Consequently, Vm was considered to be an underestimate with an error E (%) of 4.53 % (Table 2).
re-Table 3 – Total carbon sequestration for the 188.59 hectare 20-years hardwood plantation of Baihe Farm.
Components Trunk volume Whole volume Dry biomass Carbon contents
(tonne or t C) t CO2 --- m3 --- tonne
Model estimation 24,932.64 41,138.85 21,884.86 10,266.19 37,642.69
Bias adjustment 2,398.52 3,957.56 2,105.33 987.61 3,621.24
Determined 27,331.15 45,096.41 23,990.19 11,253.80 41,263.93
*Averaged carbon management efficiency is 2.98 t C ha–1 year–1 and the farm forest carbon storage density is 59.67 t C ha–1; Compared to the urban forest carbon storage density ranging from 25.1 to 53.5 t C ha–1 in the USA (Nowak and Crane, 2002), intensively managed afforestation hardwoods on farm land can effectively promote carbon sequestration.
Figure 4 – Diameter distribution and DBH (diameter at breast height)-height model of the pooled data for the species at Baihe Farm. The P-value of the pooled data regression model is less than 0.0001. It indicates that the pooled model is statistically significant and could be applied for height prediction using DBH for the minor species in the farm forest.
fitted using a Gaussian diameter PDF model. The stem estimation of the proposed model in the sample plots was 1,232 and the volume estimate was 52.52 m3 ha–1.
The estimate was underestimated with an error or bias of 9.62 % (see Table 2). This study largely focused on es-timating the stock volume of forest cultivated on a farm over a period of 20 years. Because numerous tree species are growing on the farm, the pooled diameter distribu-tion model should be appropriate. This study thus adopt-ed an adjustment coefficient of 1.0962 to represent the potential expansion of the predicted volumes, biomass, and carbon contents.
Evaluation of afforestation carbon economy and crop economy
Afforestation carbon benefit
Farmers who afforest cultivated farmland will be supplied with seedlings free of charge. Afforestation costs include seedling packing, transportation from the nursery to the planting site, soil preparation, labor for distributing seedlings among individual planting holes, planting, and weeding, and these expenditures were estimated based on the data for the plantation of BAT-TAIWAN (British American Tobacco Taiwan) in Nantou County, Taiwan. The total cost comes to US$ 9,403.01 (hereafter the monetary amounts will be given in US dollars). The estimated trunk volume for the entire area (188.59 ha) of Baihe Farm is 24,932.64 m3; this
quan-tity was magnified up to 27,331.15 m3 together with the
9.62 % underestimation bias of the age-volume model.
Accordingly, aboveground biomass was determined by multiplying the whole volume expansion coefficient (BEF2) 1.65 by the wood densities (D) for the individual species; carbon content sequestrated in the Baihe Farm forest was determined to be 11,253.80 metric tons over a 20 year period. This quantity of carbon is identical to 41,263.93 t CO2 which can be obtained by multiplying the metric tons of carbon with the CO2 conversion coef-ficient of the molecular mass percentage of carbon and oxygen (Table 3). Though trees (C3 plant) can sequester more significant carbon in the deep soil profile than C4 plants (Nair et al., 2007), the below-ground biomass of farm forest was not counted in the carbon determina-tion because carbon markets do not yet recognize below-ground biomass in the estimation of storage for carbon credits.
If all the carbon to be sequestered in a 20 year management period is exchanged in the CCX CFI car-bon market, the income realized will be 820.51 $ ha–1.
Considering both costs and income, including subsidies and carbon trading, the profit per hectare of afforesta-tion with hardwoods on Baihe Farm was $ 43,036.61 for the CCX CFI carbon markets.
Profit from agriculture crops
each crop representing production costs of US$ 3,255.90 ha–1 and income of US$ 3,358.13 ha–1. Consequently, rice
farmers average a profit of just US$ 204.46 ha–1 from
their crops, representing just US$ 4,089.20 ha–1 over 20
years of rice farming. Sugarcane needs 12 or 18 months growing time to mature to sugar production size dur-ing the first or the second generation farmdur-ing, and each generation produces gross material totaling 78 metric tons ha–1. Over 20 years, farmers will harvest 16
genera-tions, producing 1,248 metric tons of gross materials per hectare. According to TSC just 10 % of this gross mate-rial can be made into sugar. The spot price of sugar was US$ 0.80 kg–1 in 2001. Therefore, the income for a single
term cane crop is US$ 6,221.49 ha–1 meaning that after
deducting production costs of US$ 2,350.75 ha–1, cane
farmers achieve a profit of US$ 3,870.74 ha–1 per term
or US$ 61,931.84 ha–1 over 20 years of continuous
farm-ing. The potential benefits of the afforestation system in comparison to the cropping system over a 20 year period are shown in Table 4.
Discussion
Productivity and economic potential of hardwoods farming system
The predicted volume productivity of hardwood afforestation at Baihe Farm is approximately 7.2 m3 ha–1
year–1. According to the timber logging database of the
Taiwan Forestry Bureau, there were 67.38 ha (clear cut-ting) and 0.22 ha (selection cutcut-ting) of hardwood forest harvested from southern Taiwan in 2007, denoted as the South Taiwan Hardwood case (abbreviated STH). These represent a total timber yield of 2,861.56 m3. The age of
the logged hardwoods is assumed to be 20 years based on the forest lifespan required by the afforestation policy of TFB, and the fact that mountainous hardwoods have a productivity of 2.1 m3 ha–1 year–1. The results of this
study demonstrate that farm afforestation productivity is approximately three times that of hill and mountain hardwood plantations. Baihe Farm is located in Tainan City, one of the main sites for rice and sugarcane produc-tion in Taiwan, and its site quality is considered much better than that of mountainous and hill sites. Farm af-forestation hardwoods thus have a higher potential pro-ductivity than hill/mountainous hardwoods.
From the STH case, the income from hardwood production is approximately US$ 89.87 m–3. Although
no cost data is available for the STH case, such data
is available for another data set that is the production cost of timber logging, gathered from all of the private hardwood plantations in Taiwan during 2007 (denoted as case WTH). This case involved a logged volume of 3,366.43 m3. Cost items listed in the WTH data set are
considered for cost correction, with the exception of the woodland path cost, since the road network on the flat-land areas of Taiwan is well developed. Consequently, the adjusted cost is US$ 183.72 m–3 and income is US$
200.60 m–3, and thus the total benefit can be calculated
as US$ 16.88 m–3, representing approximately 8.4 % of
total income. This percentage is employed as a coeffi-cient of forestation benefit and applied to determine the benefit of growing forest in the STH case. Accordingly, it is estimated that TSC, which manages the Baihe Farm hardwood forest, will achieve a profit of US$ 7.55 per cubic meter volume of wood with the total profit ranging from US$ 188,240 to 206,350. A median value of US$ 197,296 can be considered as a generalization, assuming the trees grow for 20 years.
In considering the carbon sequestration rate (CSR), the Baihe farm hardwood forest has a potential of 2.98 t C ha–1 year–1, equivalent to 10.93 t CO
2 ha –1
year–1 based on a 20-years growing period. This amount
of aboveground carbon is less than 5.02 t C ha–1 year–1
(18.41 t CO2 ha–1 year–1) the CSR of farm forest but
great-er than 2.52 t C ha–1 year–1 (9.24 t CO
2 ha–1 year–1) the
CSR of tubestock revegetation forest in Victoria, Aus-tralia. Carbon sequestration rates for USA cases are available from CCX reforestation carbon accumulation tables, which can be found in a landowner’s guide to carbon sequestration credits by Current et al. (2007). In a densely planted forest with more than 250 stems per acre, the carbon sequestration rates of 20 year old mixed hardwoods in Northern Plains, bottomland hardwoods in Central States, mixed hardwoods in Corn Belt, and bottomland hardwoods in South Central are 5.76, 5.33, 10.80, and 4.89 t CO2 ha–1 year–1 respectively. Additional
research such as that investigating a hybrid poplar for-est (Updegraff et al., 2004) and a coniferous-deciduous mix afforestation forest (Niu and Duiker, 2006) have car-bon sequestration rates around 8.98 and 9.53 t CO2 ha–1
year–1 after 20 years. Carbon sequestration rates of forest
in New Zealand can be found in work by Hollinger et al. (1993), Tate et al. (1997), Scott et al. (2000), and Trotter et al. (2005).
The CSR varies from 8.10 for 40 year old affor-ested/reforested pasture lands, 9.52 for 25 year old
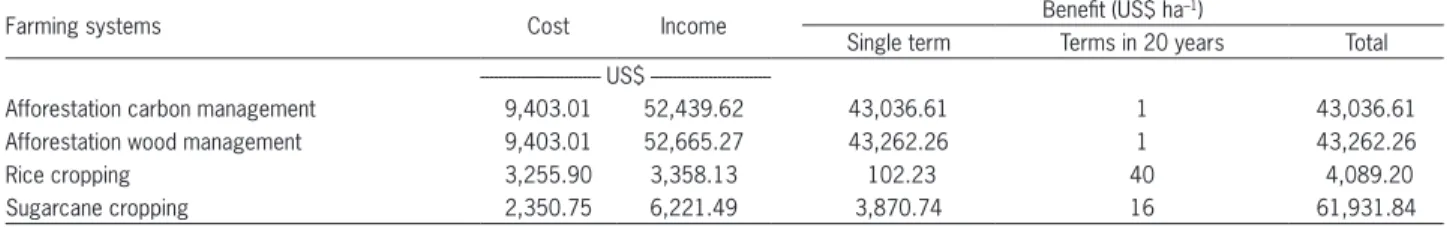
scru-Table 4 – A potential benefits comparison to the cropping system and afforestation system in a 20-years continuous period.
Farming systems Cost Income Benefit (US$ ha
–1)
Single term Terms in 20 years Total US$
---Afforestation carbon management 9,403.01 52,439.62 43,036.61 1 43,036.61
Afforestation wood management 9,403.01 52,665.27 43,262.26 1 43,262.26
Rice cropping 3,255.90 3,358.13 102.23 40 4,089.20
bland, to 18.33 t CO2 ha–1 year–1, for planted forests. By
comparing these observed data, it can be seen that farm afforestation in Taiwan has a relatively good potential for increased carbon sequestration rate. This value is very close to the 3.00 t C ha–1 year–1 growth rate of the
aboveground standing stock estimation model described by Marland and Marland (1992). Although afforested hardwoods have a 3.00 annual carbon sequestration rate, this is still well short of the 8.50 t C ha–1 year–1 of
an eight year old bamboo stand of Phyllostachys pubescens in Japan observed by Isagi et al. (1997). It seems that growing bamboo is an easier way to meet the carbon sequestration goal of 13.00 t C ha–1 year–1 as suggested by
Hiroshima (2004) for Japanese plantation forests.
Net contribution of paddy/sugarcane farming sys-tem to carbon sequestration
Carbon sequestration of farm crops is a major concern of this study. Fire is generally a simple tool for agricultural management. It is used very often in many countries particularly for the development of shrub for-est/savanna/cerrado. While the conversion of native land cover through slash and burn followed by cultivation re-sults in a decrease in carbon stocks and an associated increase in CO2 emissions (Detwiler, 1986; Brown and Lugo, 1990; Lal, 2003; Franchini et al., 2007; Carvalho et al., 2009). In Taiwan, farmers sometimes burn rice straw into ash or more commonly, bury it directly in the soil to provide nutrition for the next growing season. Burning rice straw will directly release sequestrated carbon into the air, strongly influence air quality, and will cause a danger to traffic if it is carried out near roadways. Rice straw burning is thus prohibited by law in Taiwan. An alternative method involves burying the straw under a layer of earth and allowing it to degrade naturally. Bury-it to degrade naturally. Bury- to degrade naturally. Bury-ing straw increases the quantity of organic matter in the soil, saves labor and other costs, and increases the yield of the next rice crop. This not only avoids the problem of air pollution, but also helps to improve soil nutri-ents. As indicated by Guo (2005), following three years of continuously burying straw in a paddy field, the or-ganic matter contents of the soil will increase by 2.1-2.7 %, increasing quantities of essential chemical elements such as phosphorus, potassium, calcium, and iron. Fur-thermore, burying straw improves soil granule structure and physical properties. As a result, rice production will be increased by 5-10 %. No matter what the rice straw will be burned or buried, the sequestrated carbon will be released.
Sugarcane pulp is the biomass remaining after crushing sugarcane stalks for sugar production. Accord-ing to the methods of sugar production used by TSC, sugarcane pulp is frequently used as a primary fuel source for sugar mills. When burned in quantity it pro-duces sufficient heat energy to supply all the needs of a typical sugar mill, with energy to spare. Meanwhile, the ash can be used as soil fertilizer. This also leads the release of carbon. This study thus concludes to the
simi-lar point assumed by Shively et al. (2004) that little crop carbon is conserved and no carbon economy is available for both rice and sugarcane cropping systems. Concern-ing about the belowground biomass, suitable agricul-tural practices are able to increase soil carbon stocks by around 1.5 time (Carvalho et al., 2009). Even though the below-ground carbon could be increased by appropriate tillage operation, the soil organic carbon content in for-est is significantly four times higher than agroecosystem (Singh and Ghoshal, 2011).
Decision making related to feasible afforestation management goals
Economic benefits as top priority
In the case of the study site, Baihe Farm, the plantations cover 188.59 hectares and grow more than ten hardwood species. In the case where a farm owner wishes to become involved in wood management, and the benefits can be calculated as 52439 - 9403 = 43036 dollars for implementing an afforestation policy (see Table 4), TFB regulations require that afforested forests must be continuously managed for at least 20 years and the owners can determine the use of the forest following this period of regulation growth. This study thus sets 20 years as the rotation age of the hardwoods grown on the study site, providing the owner with an additional ben-efit from wood harvesting; based on estimates of trunk volume, the average value is expected to be $197,296. On average, a profit of $1,046.16 can be achieved from one hectare of farmland converted to forest. Summing these two amounts, the farm owner will achieve a total benefit of US$ 43,262 ha–1 over a 20 year management period. In
comparison, if the farm owner grows rice the economic benefit over 20 years will be US$ 4,089 ha–1 and for
sug-arcane US$ 61,932 ha–1. Clearly, growing rice paddies
is far less profitable than afforestation, while growing sugarcane is 1.4 time more profitable. Net present value (NPV) is used in capital budgeting to analyze the profit-ability of an investment or project. The prelisted future values of forest management and food production can be calculated at the base of 0.03 discount rate with a NPV level of US$ 30,390 for wood management, US$ 30,265 for carbon management, US$ 18,091 for sugarcane pro-duction, and US$ 3,042 for rice production.
At the study site, the owner grows various spe-cies for landscape gardening use, including Terminalia bovivinii, Cinnamomum camphora, and Bischofia javanica. Generally, trees used for landscaping are sold individu-ally and sold at a higher price. Thus, we would recom-mend that landowners grow special trees suitable for garden use, since they offer a more profitable method of afforestation than growing trees for wood production.
Carbon trading management as top priority
al-lowances, and/or that need to purchase credits to offset increased emissions. Prices for credits on the carbon market have varied greatly over time. In this study, the carbon price is determined 3.75 $ t–1 CO
2 using the CCX
CFI annual average price in 2008, the forest inventory year. During a 20 year period of forest management, Baihe Farm forest will produce dry biomass totaling 23,990.19 tonnes. Consequently some 11,253.80 metric tons of carbon, equivalent to 41,263.93 t CO2 in the air, will be sequestrated and conserved in the woods. If this quantity of carbon is exchanged on the CCX carbon mar-kets, it will have a value of approximately US$ 154,740. The average benefit of carbon trading is thus US$ 820.51 ha–1 when the forest reaches 20 years of age.
Includ-ing the afforestation subsidy, the total benefit becomes US$ 43,036.61 ha–1 over a 20 year management period.
The total benefit thus closely approaches that of wood production which equals US$ 43,262.26 ha–1, but is less
than growing sugarcane.
According to the LULUCF (land use, land use change and forestry) principles for ensuring environ-mental integrity of the Kyoto Protocol, there are some important accounting rules that must be satisfied. Some examples of the rules are: i) continuity of responsibility must be ensured, ii) emissions and removals should con-tinue to be reported and accounted for when they occur, iii) asymmetries in accounting should be removed. Thus, there should be no swapping of sinks or forest cutting if afforested forests are to be used for carbon trading. Carbon trading cannot occur if the forest is managed for timber cutting. The stock volume of afforested forest is continuously increased hence enlarging the afforestation carbon pool. It therefore results in an increased amount of carbon trading in the future.
Seeking environmentally friendly management methods
Results of this study demonstrate the benefits of afforestation of cultivated land over 20 years involving both wood-production and carbon trading. However, without government subsidies, afforestation manage-ment on cultivated land is impossible for farmers owing to the limited US$ 820.51 ha–1 benefit available over a 20
year timeframe. Even if farmers obtain no subsidies for the 20 years following the initial afforestation, the forest remains environmentally valuable because of its ability to conserve wood carbon or act as a carbon reservoir. Af-forestation is also a good option as it is inevitable that an increasing amount of cultivated land will cease to be uti-lized for cropping under the combined impact of WTO entry and an ageing agricultural labor force.
As is widely postulated, growing sugarcane is environmentally beneficial. Although carbon conserva-tion cannot be achieved during sugar producconserva-tion, burn-ing sugarcane biomass in quantity produces sufficient heat energy to fully supply the needs of a typical sugar mill. Burning sugarcane biomass thus offers an effective means of reducing energy use and hence carbon dioxide
emissions. Farm afforestation may also result in a forest landscape which might offer highly attractive scenery suitable for human recreation. In addition to direct car-bon storage, farm forest close to urban areas can also help to reduce energy consumption and further decrease carbon emissions. Farm forest biomass will continuous-ly increase and might enlarge the potential amount of carbon storage. Moreover afforested hardwoods might induce a significant contribution of biodiversity. These factors all serve as a positive recommendation for farm afforestation carbon management for the farmer who is trying to reduce levels of crop production. Soto-Pinto et al. (2010) addressed agroforestry systems such as sil-vopastoral systems, improved fallow, Taungya and cof-fee (Coffea spp.) (polyculture-shade coffee and organic coffee) systems which have good potential to sequester carbon via growing trees. If burning is avoided in agro-forestry systems, it could also contribute to carbon se-questration and reducing emissions. Peichl et al. (2006) also addressed silvicultural management and suggested that this method can contribute to the quantity of carbon accumulation in agroforestry. It is therefore suggested that agrosilvicultural systems consisting of planting trees in croplands (Nair, 1993) might bring benefits to both farming systems and afforestation systems.
Combining farming with forestry creates some additional social benefits such as high aesthetical value and biodiversity of landscape which were not the origi-nal objectives designated by the farmers for the rural area. This brings the “farm forest” itself into a much safer situation reducing the probability of anthropogenic interferences and stochastic events (forest fires or wind storms). By providing recreational facilities and land-scape enhancement (ranging from cooling effects and air purification, to attraction of bird species), the forest will in turn be appreciated by local citizens who are likely to play a role in its protection (i.e. against forest fires). In addition a more mature forest will be less prone to dam-age by typhoons that frequently damdam-age trees in Taiwan. With the inherent ability of the biophysical systems, the carbon sequestration rate will continuously increase in the commitment period of emission reduction. It is known that forests do not sequester carbon at the same rate during their lifespan. The forest will start slowly, and eventually taper off once the forest has matured, and finally the old matured trees will re-emit the carbon when they die and decompose. Harvesting is considered as an emission activity by LULUCF principles. There-fore, it is necessary to propose a suitable management framework for “farm forest” regeneration to ensure the environmental integrity of the removal of CO2 from the atmosphere.
Acknowledgements
forestry team at the Taiwan Sugar Corporation is ap-preciated for their valuable assistance in the farm forest inventory.
References
Albrecht, A.; Kandji, S.T. 2003. Carbon sequestration in tropical agroforestry systems. Agriculture, Ecosystems and Environment 99: 15–27.
Brown, S.; Lugo, A.E.; Chapman, J. 1986. Biomass of tropical tree plantations and its implications for the global carbon budget. Canadian Journal of Forest Research 16: 390–394.
Brown, S.; Lugo, A.E. 1990. Effects of forest clearing and succession on the carbon and nitrogen contents of soil in Porto Rico and U.S. Plant and Soil 124: 53–64.
Carvalho, J.L.N.; Cerri, C.E.P.; Feigl, B.J.; Píccolo, M.C.; Godinho, V.P.; Herpin, U.; Cerri, C.C. 2009. Conversion of Cerrado into agricultural land in the south-western Amazon: Carbon stocks and soil fertility. Scientia Agricola 66: 233–241.
Current, D.; Scheer, K.; Harting, J.; Zamora, D.; Ulland, L. 2007. A landowner’s guide to carbon sequestration credits: in association with the commonwealth project. CINRAM, Toronto, Canada.
Detwiler, R.P. 1986. Land use change and the global carbon cycle: the role of tropical soils. Biogeochemistry 2: 67–93.
Franchini, J.C.; Crispino, C.C.; Souza, R.A.; Torres, E.; Hungria, M. 2007. Microbiological parameters as indicators of soil quality under various soil management and crop rotation systems in southern Brazil. Soil & Tillage Research 92: 18–29.
Galudra, G.; van Noordwijk, M; Suyanto; Sardi, I.; Pradhan, U. 2010. Hot spot of emission and confusion: land tenure insecurity, contested policies and competing claims in the central Kalimantan ex-mega rice project area. World Agroforestry Centre, Bogor, Indonesia. 34p. (Working paper, 98).
Guo, T.C. 2005. A Newsletter of Kaohsiung District Agricultural Research and Extension Station. Council of Agriculture, Taipei, Taiwan. (No. 94036).
Hiroshima, T. 2004. Strategy for implementing silvicultural practices in Japanese plantation forests to meet a carbon sequestration goal. Journal of Forest Research 9: 141–146. Hollinger, D.Y.; MacLaren, J.P.; Beets, P.N.; Turland, J. 1993.
Carbon sequestration by New Zealand’s plantation forests. New Zealand Journal of Forest Science 23: 194–208.
Isagi, Y.; Kawahara, T.; Kamo, K.; Ito, H. 1997. Net production and carbon cycling in a bamboo Phyllostachys pubescens stand. Plant Ecology 130: 41–52.
Lal, R. 2003. Global potential of carbon sequestration to mitigate the greenhouse effect. Critical Reviews in Plant Sciences 22: 151–184. Lee, K.J.; Lin, J.C.; Chen, L.C. 2000. The potential of carbon
sequestration and its cost-benefit analysis for Taiwania plantations. Taiwan Journal of Forest Science 15: 115–123. Lee, K.J.; Lin, J.C.; Lain, C.S.; Lin, L.C. 2004. Carbon sequestration
effects in different forest ecosystem management scenarios in experimental forest, National Taiwan University. Journal of the Experimental Forest of National Taiwan University 18: 261–272.
Lin, Y.J.; Liu, C.P.; Lin, J.C. 2002. Measurement of specific gravity and carbon content of important timber species in Taiwan. Taiwan Journal of Forest Science 17: 291–299.
Marland, G.; Marland, S. 1992. Should we store carbon in trees? Water, Air, and Soil Pollution 64: 181–195.
Nair, P.K.R. 1993. An introduction to agroforestry. Kluwer, Dordrecht, Netherlands.
Nair, P.K.R. 2011. Agroforestry systems and environmental quality: introduction. Journal of Environment Quality 40: 784–793.
Nair, V.D.; Haile, S.G.; Michel, G.; Nair, P.K.R. 2007. Environmental quality improvement of agricultural lands through silvopasture in southeastern United States.Scientia Agricola 64: 513–519. Niu, X.; Duiker, S.W. 2006. Carbon sequestration potential by
afforestation of marginal agricultural land in the Midwestern U.S. Forest Ecology and Management 223: 415–427.
Nowak, D.J.; Crane, D.E. 2002. Carbon storage and sequestration by urban trees in the USA. Environmental Pollution 116: 381– 389.
Peichl, M.; Thevathasan, N.V.; Gordon, A.; Huss, J.; Abohassan, R.A. 2006. Carbon sequestration potentials in temperature tree-based intercropping systems, southern Ontario, Canada. Agroforestry Systems 66: 243–257.
Penman, J.; Gytarsky, M.; Hiraishi, T.; Krug, T.; Kruger, D.; Pipatti, R.; Buendia, L.; Miwa, K.; Ngara, T.; Tanabe, K.; Wagner, F. 2003. Good practice guidance for land use, land-use change and forestry. Institute for Global Environmental Strategies, Tokyo, Japan.
Scott, N.A.; White, J.D.; Townsend, J.A.; Whitehead, D.; Leathwick, J.R.; Hall, G.M.J.; Marden, M.; Rogers, G.N.D.; Watson, A.J.; Whaley, P.T. 2000. Carbon and nitrogen distribution and accumulation in a New Zealand scrubland ecosystem. Canadian Journal of Forest Research 30: 1246–1522.
Sedjo, R.A. 1989. Forests to offset greenhouse effect. Journal of Forestry 87: 12–15.
Shively, G.E.; Zelek, C.A.; Midmore, D.J.; Nissen, T.M. 2004. Carbon sequestration in a tropical landscape: an economic model to measure its incremental cost. Agroforestry Systems 60: 189–197. Singh, M.K.; Ghoshal, N. 2011. Impact of land use change on soil organic
carbon content in dry tropics. Plant Archives 11: 903–906.
Soto-Pinto, L.; Anzueto, M.; Mendoza, J.; Ferrer, G.J.; de Jong, B. 2010. Carbon sequestration through agroforestry in indigenous communities of Chiapas, Mexico. Agroforestry Systems 78: 39–51.
Tate, K.R.; Giltrap, D.J.; Claydon, J.J.; Newsome, P.F.; Atkinson, A.E.; Taylor, M.F.; Lee, R. 1997. Organic carbon stocks in New Zealand’s terrestrial ecosystems. Journal of the Royal Society of New Zealand 27: 315–335.
Trotter, C.; Tate, K.; Scott, N.; Townsend, J.; Wilde, H.; Lambie, S.; Marden, M.; Pinkney, T. 2005. Afforestation/reforestation of New Zealand marginal pasture lands by indigenous shrublands: the potential for Kyoto forest sinks. Annual of Forest Science 62: 865–871.
Updegraff, K.; Baughman, M.J.; Taff, S.J. 2004. Environmental benefits of cropland conversion to Hybrid poplar: economic and policy considerations. Biomass Bioenergy 27: 411–428. Winjum, J.K.; Brown, S.; Schlamadinger, B. 1998. Forest harvests
and wood products: sources and sinks of atmospheric carbon dioxide. Forest Science 44: 272–284.