THE QUANTITATIVE COMPONENT’S DIAGNOSIS OF
THE ATMOSPHERIC PRECIPITATION CONDITION IN
BAIA MARE URBAN AREA
S. ZAHARIA
1Abstract:-The atmospheric precipitation, an essential meteorological element for
defining the climatic potential of a region, presents through its general and local particularities a defining influence for the evolution of the other climatic parameters, conditioning the structure of the overall geographic landscape. Their quantitative parameters sets up the regional natural setting and differentiation of water resources, soil, vegetation and fauna, in the same time influencing the majority of human activities’ aspects, through the generated impact over the agriculture, transportation, construction, for tourism etc. Especially, through the evolution of the related climatic parameters (production type, quantity, duration, frequency, intensity) and their spatial and temporal fluctuations, the pluviometric extremes set out the maxim manifestation of the energy gap of the hydroclimatic hazards/risks which induce unfavourable or even damaging conditions for the human activities’ progress. Hence, the production of atmospheric precipitation surpluses conditions the triggering, or reactivation of some intense erosion processes, landslides, and last but not least, floods. Just as dangerous are the adverse amounts of precipitation or their absence on longer periods, determining the appearance of droughts, aridity phenomena, which if associated with the sharp anthropic pressure over the environment, favours the expansion of desertification, with the whole process of the arising negative effects.
In this context, this paper aims to perform the diagnosis of atmospheric precipitation condition in Baia Mare urban area, through its quantitative component, in multiannual condition (1971-2007), underlining through the results of the analyzed climatic data and their interpretation, the main characteristics that define it. The data bank from Baia Mare station from the National Meteorological Administration network, representative for the chosen study area, was used. Baia Mare urban area overlaps Baia Mare depression, situated in the north-west side of the country, belonging, from a geographic perspective, to the West Hills, being limited by the Igniúúi Massif, Gutâi la Mountains at north north-east, by the Chioarului and Codrului Hills at west and south, being drained by Lăpuú, Săsar, Bârsău, Firiza, Jidovaia Rivers and others.
The occupied geographic area by Baia Mare Depression benefits of a warm summer continental climate with predominant oceanic influences, being for most
1
part of the year under the influence of oceanic air masses rich in humidity, due to west and north-west advections.
Key words: temporal fluctuations, atmospheric precipitation, climatic data,
rainfall, thermoconvection, , solid shape, pouring rains.
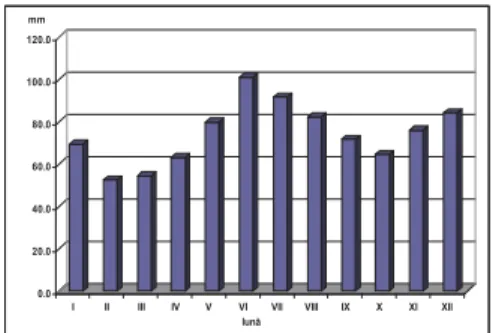
Monthly and annual average rainfalls are larger than in other hilly sectors with similar altitude, situated at the exterior of the Carpathians. During the year, the monthly average rainfalls present a relatively uniform distribution, having an irregular energy gap between almost 50 mm in February/March and 100 mm in June, the annual average from the analyzed period (1971-2007) equalling 890,8 mm (table 1 and Figure 1).
Table 1. Monthly and annual rainfalls’ averages at Baia Mare meteorological station
(1971-2007)
I II III IV V VI VII VIII IX X XI XII Annual
69.5 52.4 54.5 63.0 79.8 101.1 91.6 82.2 71.8 64.7 76.0 84.3 890.8
The largest monthly rainfall is gathered both during the warm semester of the year (the main maximum amount in June-July), and at the beginning of the winter (the second maximum amount in December), the frequency on precipitation types – liquids, solid and mixed – being relatively uniform.
Usually, in the months April-September from the rainiest years 200 mm were exceeded (1912, 1913, 1915, 1924, 1970, 1974, 1985, 2001, 2004-2006). After the year 1983, the benchmark year of the current climatic modifications, we observe in the winter months and especially in December rainfalls that exceed the monthly rainfalls from the warm semester of the year. The same pluviogenetic is observable in the November months and sometimes January which, most of the times, when overlapped with moderate towards high temperatures, triggers floods especially in the small hydrographic basins tributary to Săsar and Lăpuú. Such situations are characteristics to the years: 1985 (November and December), 1990 (November), 1993 and 1994 (December), 1995 (November and December), 1999, 2004, 2007 (November and December).
The historical pluviometric annual record (table 2) for the analyzed climatic area reached remarkable values at Baia Mare meteorological station (1493,0 mm in the year 1915), and the monthly ones from 1896...2007 period is presented in this manner:
Figure 2. Monthly average rainfalls’ allotment on value categories at Baia Mare meteorological station (1971-2007)
0.0 20.0 40.0 60.0 80.0 100.0 120.0
I II III IV V VI VII VIII IX X XI XII mm
lună
Figure 1. Average monthly rainfalls at Baia
Mare station (1971-2007)
In annual, multiannual average condition, the maxim of rainfalls in diurnal condition, and in periods of two and three consecutive days reach and exceed, in Baia Mare, the necessary values for triggering the climatic hazards/risks
represented by pouring rains.
Table 2. The largest monthly and annual rainfalls at Baia Mare
meteorological station (1896-1915; 1921-1943; 1950-2007).
Months
Extre-mes I II III IV V VI VII VIII IX X XI XII Annual
Max 157.7 170.0 202.0 204.0 235.1 235.7 327.0 304.0 217.0 229.7 201.1 222.0 1493.0
Year 1976 1912 1914 1924 1970 1974 1913 1915 1912 1941 1923 1915 1915
Source: database National Meteorological Administration
The pluvial intensity in the analyzed area reaches the highest values in the country, the average of the highest five downward values of the pluvial intensity from the 1971-2000 period being in Baia Mare between 3-4 mm/min.
In June 1974 (236.7 mm), June 1982 (214.5 mm) and also in June 1988 (194.3 mm), but also in December 1978 (152.8 mm) and 1993 (175.5 mm) the largest rainfalls were identified.
The monthly rainfalls distribution on five value categories shows their sharp unevenness during the year, in the same time indicating the predominance of precipitation fallen in the category between 50 and 100 mm (53.1% of the cases). The extreme categories 50.0 mm and 200.0 mm are less represented or underrepresented (comprising 14.0&, respectively only 1.1%), indicating that Baia Mare urban area is more susceptible to monthly average rainfalls lower than 50.0 mm, rather than higher than 200.0 mm (table 3).
Table 3. Frequency of rainfalls in monthly multiannual condition on value categories
Frequency of monthly rainfalls (1971-2007) Value categories Absolute
(no. of cases)
Aggregate value
(no. of cases) Relative (%)
50.0 62 444 14.0
50.1 - 100.0 236 382 53.1
100.1 - 150.0 113 146 25.5
150.1 - 200.0 28 33 6.3
200.1 5 5 1.1
Average seasonal rainfalls. In the study area, the spring season sums up the lowest rainfalls (22.1% from the annual rainfalls), even if the May month brings a substantial contribution, and the summer season sums up the richest rainfalls (30.9%) from the entire year (June-August). However, it is observable a seasonal value energy gap relatively tight, motivated by the rich pluviometric condition during the entire year. Autumn and winter have relatively close balances (23.9%, respectively 23.1% from the annual rainfalls) motivated also by the lower temperatures, unfavourable for the thermoconvection, but also by the predominance of anticyclone baric situations.
The average semester rainfalls are rather balanced, meaning that 55% of the annual total comes to the warm season of the year (April-September), while the
cold season only accumulates 45% (table 4).
Table 4. Average seasonal and semester multiannual (1971-2007) rainfalls (mm) at Baia
Mare meteorological station.
Seasonal rainfalls (mm) Semester rainfalls (mm)
Winter Spring Summer Autumn Warm Cold
206.2 197.3 274.9 212.5 489.6 401.4
Figure 3. Annual rainfalls’ allotment in the Baia Mare municipality area and in the surroundings.
For the period of 1971-2007 the multiannual average reaches 890.8 mm, the multiannual variation energy gap being of 541.3 mm. The rainiest year from the period under observation was 2001 when 1160.0 mm were totalled due to the domination of a cyclonic activity, and the most arid year 2003 with only 618.7 mm being favoured by the presence of more consecutive months of an anticyclone condition.
The absolute share of the annual rainfalls deviation, in comparison with the multiannual average, is in favour of those positive (19 cases), in comparison with those negative (14 cases), which shows one more time the rich pluviometric characteristic from Baia Mare area.
0.0 200.0 400.0 600.0 800.0 1000.0 1200.0 1400.0 1 971 1 972 1 973 1 974 1 975 1 976 1 977 1 978 1 979 1 980 1 981 1 982 1 983 1 984 1 985 1 986 1 987 1 988 1 989 1 990 1 991 1 992 1 993 1 994 1 995 1 996 1 997 1 998 1 999 2 000 2 001 2 002 2 003 2 004 2 005 2 006 2 007
mediile anuale media multianuală Polinomială. (mediile anuale) Liniară (mediile anuale)
mm
an
Figure 4. Annual rainfalls variation and their evolution tendency,
750.0 800.0 850.0 900.0 950.0 1000.0
1971-1980 1981-1990 1991-2000 2001-2007
decenii
mm
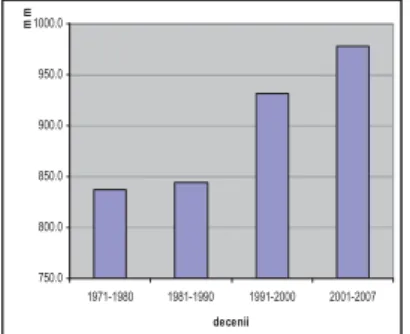
Figure 5. The evolution of decade
rainfalls average at the Baia Mare meteorological station.
From figure 4 the yearly variation of rainfalls is evident, which presents fluctuations due to their dependence of the general atmospheric circulation, which interacts with the radiation factor and the subjacent active area, the latter assuming a special role in their generation.
Another cause is the enlargement of the urban space and so, the sharpening of the “heat island” effect generated by built areas, overheated during summer and which amplifies the thermal convection, by increasing the cloudiness level. Meanwhile, the increase in meal content from the industrial units, the intense road service, or from burning fuels, contributes to the local increase of cloudiness through the existence of a large number of inspissation kernels in the air. All these, based on increased temperatures of the urban area, in comparison with those from bordering areas, contributed to the speed-up of the processes triggering precipitation and to the increase of annual rainfalls, especially in the last years in the north and north-west side of the country.
The evolution tendency of the annual rainfalls in Baia Mare municipality area and its bordering area is to increase, highlighted by the straight-line of their linear regression. In most parts, this tendency is supported by the sequence of some rainy years after 1997, when it is observable an increase of air temperature,
correlated with high values of air humidity, specific for the north-west side of the country. The polynonimal evolution tendency of the precipitation indicates two quantitatively richer periods (1971-1981 and 1992-2006) interrupted by an intermediary period for these, where lower quantities than the multiannual average were annually registered.The distribution of rainfalls on decades highlights the same value increase in the last seven years (2001-2007), based on the evolution’s increased general tendency (figure 5).
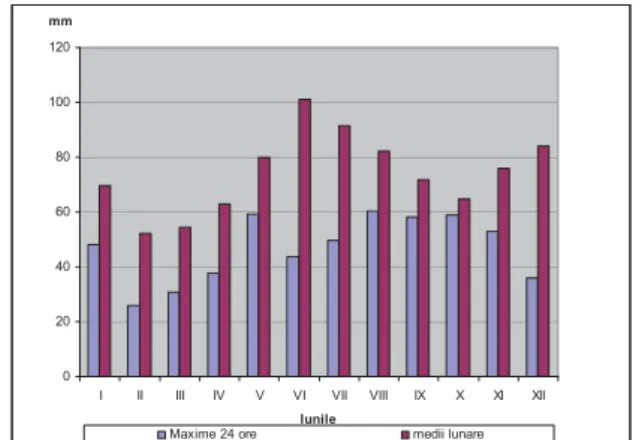
The maxim amount of rainfalls in 24 hours. The predominant characteristic of this parameter is given by the fact that the diurnal maxims have a non-regional character, representing high pluvial intensities, of small duration, affecting, in the same time, small areas, therefore, restricted action areas. Compared to the monthly average of rainfalls, the diurnal maxims highlight their exceptional abundant character, underlined by the fact that most of the times, the maximum amount of added rainfalls in a day represent in value at least half, if not even two thirds from the monthly averages (figure 6 and table 5).
0 20 40 60 80 100 120
I II III IV V VI VII VIII IX X XI XII
lunile
Maxime 24 ore medii lunare
mm
Figure 6. The comparative graph of maximum amount
of rainfalls in 24 hours, compared with the monthly average ones (1971 - 2007) at Baia Mare
meteorological station
period (60.2 mm/1977), with small differences from the months of May and October.
The absolute maximum amount of rainfalls registered 121.4 mm/13.05.1970. Most of the times, these have downpour character, with damaging mechanical effects for the environment, causing, not rarely, floods in the small
hydrographical basins (Dragotă, 2006). Such low monthly values are signalled in the cold period of the year when the anticyclone baric situations prevail, with a high degree of instability of air masses.
Being a parameter with an irregular sharp evolution, the diurnal maximum amounts of rainfall vary a lot from one month to another, their occurrence depending on a series of factors. Most of such rainfalls are related to the frequent and intense hermoconvective processes in the warm semester of the year, overlapped with the frontal ones (the predominant low intensity circulation).
Table 5. The maximum and average amounts of rainfalls in 24 hours, in comparison with
the multiannual monthly averages at Baia Mare meteorological station (1961-2007)
Parame-ters I II III IV V VI VII VIII IX X XI XII
Max. mounts in
24 h 48.2 26.0 30.9 37.9 59.4 43.8 49.8 60.2 58.0 58.8 53.0 36.1 Year of
occurrence 1986 1997 1977 1989 1991 1982 1984 1977 1984 1996 1995 1993 Average of the
max. amounts in 24 h
17.1 13.6 13.8 18.1 25.2 27.9 27.9 26.5 21.4 19.5 19.5 21.0
Monthly average 69.5 52.4 54.5 63.0 79.8 101.1 91.6 82.2 71.8 64.7 76.0 84.3
The frequency of days with equal or higher than certain thresholds rainfalls.
Table 6. The Annual average number of the days with rainfalls higher or equal with certain thresholds in Baia Mare (1971-2007)
Quantitative thresholds 0.1 mm 1.0 mm 5.0 mm 10.0 mm 20.0 mm
Absolute frequency 156.5 114.0 55.7 28.1 8.1
Relative frequency 100.0 72.8 35.6 18.0 5.2
In the interest area the phenomena of drought or aridity are not characteristic. Yet, in the analyzed period and in some adverse years under pluviometric aspect, like the 2000 drought year record at the level of the entire country, in Baia Mare, 33 consecutive dayswithout precipitation were totalled as well (24 September – 26 October 2000).
The main component of the rainfalls in Baia Mare urban area is made from
solid precipitation, represented mainly by snow and genetically conditioned hydrometeors, by the negative air and soil temperatures, for consecutive days, as well as high values of the air humidity. In multiannual condition, the first snows appear in October and are due to the interaction of cold polar and arctic masses of air (Greenlandic, Scandinavian, East-European, and rarely the Siberian Anticyclones). The subjacent area’s particularities influence the character of the snow beddings.
In Baia Mare municipality the annual average frequency of the days with snow is annually marked with 42.3 cases, the best represented being January, December and February (table 7).
Table 7. The multiannual monthly average number of days (1971-2007) with snow at Baia
Mare meteorological station
Months VIII IX X XI XII I II III IV V VI VII
Days 1.4 5.2 9.5 9.8 8.5 4.7 2.2 1.0
The formation of the snowpack is a consequence of rainfalls with solid shape in conditions of negative temperatures. In multiannual average condition, in Baia Mare it is annually registered 61 days with snowpack soil, this is from October until April (table 8).
Table 8. The average number of days with snowpack at Baia Mare meteorological station
(1971-2007)
Months X XI XII I II III IV Annual
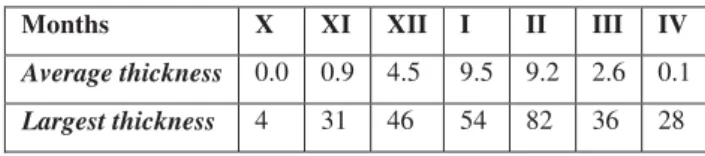
The thickness of the snowpack. Parameter with multiple practical implications for the agriculture, constructions, transportation, water supply, tourism etc, the thickness of the snowpack is of great utility especially for the Transportation, Roads and Traffic Security Agency in relation to the resizing of access routes, of local, national or European importance roads etc. During the cold season, this parameter reaches the highest average values in January and February, having measurable thicknesses starting from November until April (table 9).
Unlike the average values, its largest thicknesses are generated by conditions of synoptic order, able to have an accidental character, or representing the sign for some long and cold winters (1962-1963; 1984-1985; 1995-1996). In Baia Mare the largest thickness from the analyzed period reached 54 cm in January 1976
.
Table 9. The average and largest thickness of the snowpack
at Baia Mare meteorological station (1971-2007)
Months X XI XII I II III IV
Average thickness 0.0 0.9 4.5 9.5 9.2 2.6 0.1
Largest thickness 4 31 46 54 82 36 28
Under the conditions of a favourable structure of the air dynamics, strongly related with the air temperature getting through the critical thresholds and with the presence or absence of excess water in nature, it is possible for some hydrometeors to appear and to develop, which sometimes can get a dangerous character, or even of a climatic hazard/risk. The pouring rains are the most important dangerous meteorological phenomena in the geographic area of interest. These, through their characteristic parameters (intensity, duration, quantity), depend on the very active air dynamic, altitude, landform, solar radiation and the role of orographic barrage of the Carpathians for the humid air advections, usually triggering floods, especially in the small hydrographical basins. For the hill regions in which the analyzed geographic area can be included, floods’ occurrence is conditioned by a certain water quantity that comes from precipitation (Milea et. al., 1976):
In case of a dry soil it is necessary to have a rainfall of 30 l/m2 in 24 hours; For a humid or drenched soil, a larger quantity of/or between 10 and 20 l/m2 in 24 hours.
depends on the ration between the spread and duration of the pauses or the decrease periods of the rain’s intensity, on the dislocation method of the cloudy cells over the respective basin, depending on the type and orientation of the subjacent area’s flanks, on the covering degree with vegetation and its type, on the soil’s type etc. The water quantity totalled during pouring rains in a certain area is usually in invers ratio with the spread speed of the air front which it generates. The most dangerous rains are those that come from fronts with slow speed and immediate high intensity, measured with the radiolocation.
In the Baia Mare Depression the most dangerous are the dislocations of the cloudy cells along the front towards the cyclone’s centre, and the well defined front at a synoptic scale gets dislocated on the north-west towards south-east, from south-west towards north-east and from north towards south directions. To these the pouring rains are added that are generated by quasi-stationary fronts with continuous reconstruction during the entire rain in the respective region, which give large quantities, although the rainfall intensity is moderate.
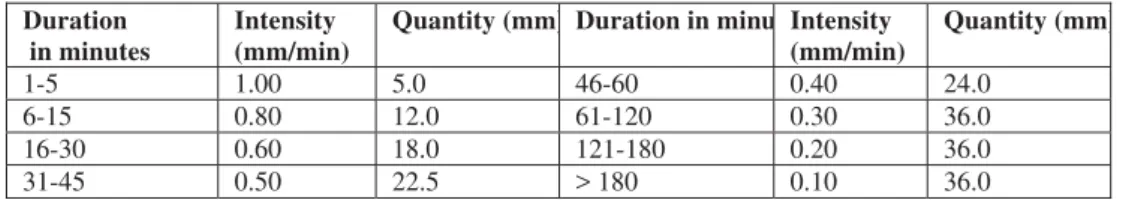
On the territory of Romania, the pouring rains have a frontal or local character, their intensity showing sudden changes during fall. Those with frontal character have longer durations, covering large areas, triggering big floods, both in the big and small hydrographical basins, the water quantities frequently exceeding 100mm/min. The local pouring rains affect small areas, trigger significant floods in the small hydrographical basins (up to 200-300km2) especially due to their reduced areas, rather than the added water quantities. The ranking of rains’ pouring character (Dragotă, 2006) shows distinct limits (table 10):
Table 10. Rains’ pouring limits in Romania.
Duration in minutes
Intensity (mm/min)
Quantity (mm) Duration in minu Intensity (mm/min)
Quantity (mm)
1-5 1.00 5.0 46-60 0.40 24.0
6-15 0.80 12.0 61-120 0.30 36.0
16-30 0.60 18.0 121-180 0.20 36.0
31-45 0.50 22.5 > 180 0.10 36.0
In Baia Mare Municipality the highest absolute intensity reached 8.00mm/min in the case of a rain from 18th of July 1991, simultaneously with a wind speed of 6m/sec (which intensified the damaging effects), and the largest quantity of water added in a pouring rain sequence with the intensity of 1.83mm/min was of 11.0mm on the date of 19th of June 1977. Usually, the pouring rains with intensities of over 5mm/min have a duration of 3-5 minutes, being associated with wind intensifications and hails.
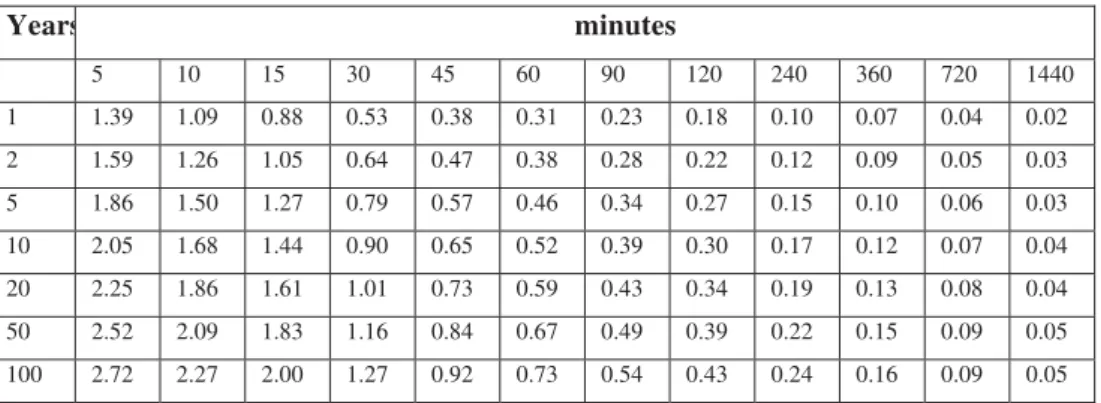
certain recurrence periods (table 11), it was possible to evaluate the pouring level at Baia Mare meteorological station, depending on the practical necessities and the applicability level of the pluviometric parameter.
Table 11. The intensity of pouring rains (mm/min) with different recurrence periods (years)
at Baia Mare*.
Years minutes
5 10 15 30 45 60 90 120 240 360 720 1440
1 1.39 1.09 0.88 0.53 0.38 0.31 0.23 0.18 0.10 0.07 0.04 0.02
2 1.59 1.26 1.05 0.64 0.47 0.38 0.28 0.22 0.12 0.09 0.05 0.03
5 1.86 1.50 1.27 0.79 0.57 0.46 0.34 0.27 0.15 0.10 0.06 0.03
10 2.05 1.68 1.44 0.90 0.65 0.52 0.39 0.30 0.17 0.12 0.07 0.04
20 2.25 1.86 1.61 1.01 0.73 0.59 0.43 0.34 0.19 0.13 0.08 0.04
50 2.52 2.09 1.83 1.16 0.84 0.67 0.49 0.39 0.22 0.15 0.09 0.05
100 2.72 2.27 2.00 1.27 0.92 0.73 0.54 0.43 0.24 0.16 0.09 0.05
*Source: Romania’s Climate, 2008
Conclusions.
Baia Mare urban area totals significant rainfalls, at all analyzed temporal levels (monthly, seasonal, semester, annual, decade).
During the year, the rainfalls’ variation is relatively uniform. The large quantities added in short periods of time (24 hours) ensures every month the necessary water for triggering floods.
The study of the quantitative component’s particularities of the atmospheric precipitation is imperative to be taken into account for the design and planning of the hydrotechnical construction, sewage works and urban and rural planning, hydroameliorative works for the infields, for the design, construction and maintenance of streetscapes, the transportation etc
.
REFERENCES
1. Dragotă Carmen-Sofia (2006). PrecipitaĠiile excedentare din România, Editura Academiei Române, Bucureúti, 174.
2. Dragotă Carmen-Sofia, Grigorescu Ines, Dumitraúcu Monica, Dumitraúcu C., ( 2009),
Regionalization of the main climatic hazard phenomena in the South-West Development Region. Romania, Proceedings of the 11th International Conference on Environmental Science and Technology, 3-5 September, 2009, Chania, Crete.
hazard phenomena and their environmental impact in the Râmnicu Vâlcea – Ocnele Mari Depression, Environment & Progress nr. 13/2009, 131-140, Cluj-Napoca. 4. Dragotă Carmen-Sofia, Grigorescu Ines, (2010), Climatic hazards in the Bucharest
Metropolitan Area. The assessment of the main extreme climatic phenomena in the Bucharest municipality and its surroundings, LAP Lambert Academic Publishing, ISBN 978-3-8433-6911-4, paperback, 108 p.
5. Grecu, Florina (2006), Hazarde úi riscuri naturale, Edit. Universitară, Bucureúti 6. Gotiu D, Surdeanu V. (2007), Notiuni fundamentale în studiul hazardelor naturale,
Edit.Presa Universitară Clujeană, Cluj-Napoca.
7. Moldovan, Fl.(2003), Fenomene climatice de risc, Editura Echinox, Cluj-Napoca. 8. Pandi G., Moldovan F. (2003), – ImportanĠa prognozelor în diminuarea riscurilor
meteorologice úi hidrologice“, Riscuri úi catastrofe, vol. II, Edit. Casa CărĠii de ùtiinĠă, Cluj-Napoca.
9. Sandu, I., Pescaru, V., I., Poiană, I., Geicu, A., Cândea, I., ğâútea, D., , (2008), Clima României, Editura Academiei Române, Bucureúti,
10. Sorocovschi, V., (2005), Prevenirea riscurilor naturale Riscuri úi catastrofe 2 An IV, Edit. Casa CărĠii de ùtiinĠă ,Cluj Napoca
11. Zaharia S., Driga B.V., Dragota Carmen (2010), P.U.G Baia Mare cap.5 Zone de risc