FUNDAÇÃO GETÚLIO VARGAS
ESCOLA BRASILEIRA DE ADMINISTRAÇÃO PÚBLICA E DE EMPRESAS
MESTRADO EM ADMINISTRAÇÃO
TÍTULO:
OPENING ILT BLACK BOX: EXPLORING RECOGNITION-BASED LEADERSHIP PECEPTIONS WITH CONJOINT ANALYSIS
Dissertação apresentada à Escola Brasileira de Administração Pública e de Empresas para a obtenção do grau de MESTRE
Apresentada por:
GUSTAVO MOREIRA TAVARES
Ficha catalográfica elaborada pela Biblioteca Mario Henrique Simonsen/FGV
Tavares, Gustavo Moreira
Opening ILT black box: exploring recognition-based leadership perceptions with conjoint analysis / Gustavo Moreira Tavares.– 2016.
40 f.
Dissertação (mestrado) - Escola Brasileira de Administração Pública e de Empresas, Centro de Formação Acadêmica e Pesquisa.
Orientador: Filipe Sobral. Inclui bibliografia.
1. Liderança. 2. Capacidade executiva. I. Sobral, Filipe. II. Escola Brasileira de Administração Pública e de Empresas. Centro de Formação Acadêmica e Pesquisa. III. Título.
The idea of this research project (using Conjoint Analysis to investigate individuals
ILTs) was first proposed in 2014 by Felipe Araújo, member of the Research Group on
Leadership at EBAPE/FGV. Because Felipe Araújo dropped the PhD program, in 2015 I took
charge of this project, reframing it both theoretically and methodologically. None of the data
previously collected by Felipe Araújo was used in this paper.
I would like to thank my advisor, Professor Filipe Sobral, for providing me wise
guidance during all the research process. His availability and expertise were determinants for
the high quality of this work.
I thank my wife, Luana Mattos, for her comprehension and abnegation, that allowed
me to keep my focus on this project. I dedicate this work to her, and to my son, Pedro de
Oliveira. I also dedicate this work to my parents, Geraldo Tavares and Maria Rita. Their
Opening ILT Black Box: Exploring Recognition-based Leadership
Perceptions with Conjoint Analysis
ABSTRACT
Although research on Implicit Leadership Theories (ILT) has put great effort on
determining what attributes define a leader prototype, little attention has been given to
understanding the relative importance of each of these attributes in the categorization process
by followers. Knowing that recognition-based leadership perceptions are the result of the
match between followers’ ILTs and the perceived attributes in their actual leaders,
understanding how specific prototypical leader attributes impact this impression formation
process is particularly relevant. In this study, we draw upon socio-cognitive theories to
explore how followers cognitively process the information about a leader’s attributes. By
using Conjoint Analysis (CA), a technique that allows us to measure an individual’s trade-offs
when making choices about multi-attributed options, we conducted a series of 4 studies with a
total of 879 participants. Our results demonstrate that attributes’ importance for individuals’
leadership perceptions formation is rather heterogeneous, and that some attributes can
enhance or spoil the importance of other prototypical attributes. Finally, by manipulating the
leadership domain, we show that the weighting pattern of attributes is context dependent, as
suggested by the connectionist approach to leadership categorization. Our findings also
demonstrate that Conjoint Analysis can be a valuable tool for ILT research.
Keywords:
INTRODUCTION
Implicit Leadership Theories (ILTs) are defined as cognitive structures or prototypes
constituted by individuals’ conceptions of what characterize a leader in terms of traits and
behaviors (Lord & Maher, 2002). The relevance of ILTs to leadership studies relies on the
premise that followers use these prototypes as a benchmark to evaluate and guide their
behaviors towards leaders (Epitropaki & Martin, 2004). The closer a leader is to a followers’
idealized image of a leader, the more positively s/he will be evaluated (Van Quaquebeke, Graf
& Eckloff, 2014). As such, an important goal in the leadership literature has been
investigating what constitutes a leadership prototype, and how this prototype is used by
followers to categorize their leaders (see Lord, Foti & De Vader, 1984).
Several ILT studies have focused on identifying the attributes mostly linked to
leadership from perceivers’ (e.g., followers) standpoint (e.g. Lord, Foti & De Vader, 1984;
Offerman, Kennedy & Witz,1994; Epitropaki & Martin, 2004; Schyns & Schilling, 2011).
This stream of research examined what are the factors or dimensions (e.g., intelligence,
attractiveness, charisma) that make up a leadership prototype. Other studies have analyzed the
effects of the overall match between ones’ ILTs and the recognized attributes in their leaders
(e.g., Epitropaki & Martin, 2005). These studies have measured the consequences of the
perceived distance between ones leadership prototypes and their actual leaders (hereafter
distance). Results show that this distance can impact the LMX quality and, subsequently,
many other organizational outcomes, such as followers’ identification with the leader,
organizational commitment, job satisfaction, and well-being (Epitropaki & Martin, 2005;
Topakas, 2011; Van Quaquebeke et al., 2014).
However, although these studies can demonstrate the consequences of the perceived
distance from the leadership prototype as a whole, they can say little about the importance of
each of the attributes that make it up. This happens because they use measures that
variables. As such, we cannot know the extent to which each leader’s attribute separately
(e.g., sensitivity or intelligence) contributed for those outcomes, or what attributes from the
prototype are the more or less relevant for followers’ leadership impression formation.
Since a leadership prototype is made up by some key attributes that followers expect
leaders to have, such as sensitivity, dedication, dynamism, and intelligence (Epitropaki &
Martin, 2004), we believe that a leader can be perceived by his/her followers as being close to
the prototype in some dimensions (e.g., sensitivity), but distant from the prototype in other
dimensions (e.g., intelligence). Consequently, we argue that different combinations of
perceived attributes’ levels (e.g., an intelligent but insensitive leader vs. a sensitive but
unintelligent leader) can lead to different outcomes in term of followers’ leadership
perceptions. This may happen because the perceptual information about each of a leader’s
attribute can receive different weights when they are cognitively integrated by followers (see
Anderson, 2008).
For example, suppose that in a scale from 1 (very low) to 9 (very high), an individual
expect leaders to be 8 in terms of both intelligence and dynamism. Now assume that this
individual is forming impressions of two different leaders: the first one is perceived as being 8
in intelligence and 5 in dynamism, while the second one is 5 in intelligence and 8 in
dynamism. Numerically, both leaders are, on average, equally distant from the expected 8
points. However, holding all other attributes constant (e.g., communication skills), will both
leaders be equally evaluated? Do followers perceive the distance from an expected level of
intelligence and dynamism the same way? According to our results, the answer is no.
We argue that followers’ leadership perceptions formation is in part the outcome of a
kind of cognitive algebra (see Anderson, 1996, 2008), in which the information about
different traits of a leader receives distinct weights, depending on their contingent relevance.
However, we believe that this process is not purely additive, as a more elementalist approach
followers’ impression formation of a leader is closer to Asch’s (1946) configural model of
person perception, in which the meaning of individual attributes changes in the context of all
other attributes. This more dynamic view of the impression process is in line with the holistic
approach to impression formation (Baumeister & Finkel, 2010).
Furthermore, we consider that the way followers integrate the perceptual information
about their leaders’ characteristics is influenced by many external constraints. We base this
view on a more recent advancement of the ILT research: the connectionist approach (e.g.
Brown & Lord, 2001; Lord, Brown, & Harvey, 2001). This perspective theorizes about the
impact of the many contextual factors encompassing the leadership categorization process,
and considers the leadership schema activation by followers, that is, the mental activation of a
specific leader prototype, to be dependent on elements such as the task type, the culture, and
the leadership context.
Brown and Lord (2001, p. 187) pointed out that “in order to fully comprehend the
influence of leaders, it is necessary to explore the cognitive categorization mechanisms of
perceivers”. We consider that a quantitative examination of ILT factors’ relative importance
from perceivers’ point-of-view will considerably contribute to the comprehension of these
mechanisms. This analysis, however, was not made in ILT research so far. To address this
gap in the ILT literature, we propose the use of conjoint analysis (CA) – an experimental
method that allows for an orthogonal manipulation of a hypothetical leader’s attributes, and
for the assessment of each attribute’s effect on individuals’ leadership perceptions.
ILT AND LEADERSHIP CATEGORIZATION
The initial use of ILTs was proposed by Eden and Leviatan (1975) based on the
implicit personality theories from psychology. In their research, Eden and Leviatan (1975)
asked students to rate leadership attributes in a hypothetical situation. After conducting a
and goal emphasis) were the same as those from prior studies in which individuals rated the
leaders of their own organizations (Halpin & Winer, 1957). The results indicated that a
connection between attributes of leadership was already in the participants’ minds,
independently of whom they were evaluating.
Lord and colleagues (Lord, Foti & De Vader, 1984) advanced the ILT research by
using the principles of the Categorization Theory (Rosch, 1978) to propose the existence of a
leadership prototype. According to Rosch (1978) the prototype for any category can be
defined as the object that carries the most attributes in common with other members of that
category and the fewest attributes in common with members of contrasting categories. Thus,
we can define a leader prototype as an abstract cognitive structure formed by the attributes
mostly associated to leaders (Epitropaki et al., 2013). The relevance of this prototype stems
from the assumption that people are categorized as leaders on the basis of the perceived match
between their characteristics and the attributes that make up a leader prototype (Epitropaki &
Martin, 2005).
A next natural step in ILT research was to identify this leader prototype. From Lord et
al. (1984) to the most recent works (e.g., Epitropaki & Martin 2004), a large number of
attributes were found to be connected with leadership or effective leadership. For the purpose
of this paper, we use the framework proposed by Epitropaki and Martin (2004), derived from
the work of Offerman, Kennedy, and Witz (1994). Epitropaki and Martin (2004) focused on
increasing the generalizability of individuals’ ILTs by using different employee groups as
respondents. The eight original factors proposed by Offerman et al. (1994) were reduced to
six, with four being related to the leader prototype, and two to the leader anti-prototype.
According to their model, intelligence, sensitivity, dedication, and dynamism represent the
prototypical characteristics of a leader, while masculinity and tyranny represent
anti-prototypical factors (Epitropaki & Martin 2004). Anti-anti-prototypical factors represent
expected to express low levels of both masculinity and tyranny. Results found by Epitropaki
and Martin (2004) were consistent over time and presented little variance among different
employee groups.
By reviewing the ILT literature, we verify that researchers use two types of leadership
prototypes: central-tendency based and ideal ones (Junker & van Dick, 2014; Van
Quaquebeke et al., 2014). Central-tendency based prototypes are closely related to Rosch’s
(1978) concept of a prototype, and represent how leaders in general are in terms of traits and
behaviors, i.e., a typical leader. Differently, an ideal leader prototype (see Barsalou, 1985)
represents how leaders should be. Because these two types of prototypes are found in the ILT
literature, Van Quaquebeke et al. (2014) investigated which of them is more relevant for
followers’ leadership perceptions. They concluded that when the image of an ideal leader is
used as the benchmark, followers’ responses towards their leaders are better predicted, in
comparison to when the image of a typical leader is used as the reference point. This finding
supported our choice to use the concept of effective leader in our study (an ideal type), and
not just a leader.
A more recent approach of leadership categorization – the connectionist model (e.g.
Brown & Lord, 2001; Lord, Brown, & Harvey, 2001), gives great attention to the contextual
factors encompassing followers’ perceptual processes. More specifically, it introduces the
concept of leadership schema or prototype activation. That is, depending on many factors
such as the culture, perceivers’ characteristics, the leader type, or the nature of the task,
different leadership prototypes will be activated by followers. Such a model allows
individuals’ prototypes to be fluid and contextually sensitive, yet maintaining its coherence
and consistency (Brown, & Harvey, 2001). In other words, leader prototypes are expected to
be at the same time relatively stable and dynamic cognitive structures.
Although some studies have empirically examined the consequences of the perceived
Epitropaki & Martin, 2005; Topakas, 2011; Van Quaquebeke, Graf & Eckloff, 2014; Nye &
Forsyth, 1991), the ILT literature has not focused in determining which attributes from the
leader prototype are most relevant for leadership categorization. Maybe it derives from the
assumption that the leaders’ attributes are first order reflexive latent variables in a model with
the leader prototype as a second order construct (see Epitropaki and Martin, 2004), so these
attributes must covary in the same direction. We argue, however, that the perception of a
leader’s attributes does not need necessarily to be correlated. For instance, a leader perceived
as highly intelligent does not necessarily need to be perceived as highly dynamic nor
dedicated, while another leader seen as insensitive, does not necessarily need to be seen as
unintelligent. Maybe the high correlation between the ILT factors found by Epitropaki and
Martin (2004) was caused by respondents’ liking of leaders or other higher-order constructs
(see James & James, 1989; Brown & Lord, 2001), or even by common-method bias
(Podsakoff, MacKenzie, & Podsakoff, 2012).
From our perspective, followers’ recognition-based leadership perceptions (Lord &
Maher, 2002) would result from the integration of the perceived level of each attribute of a
leader (mainly the attributes that compose followers’ ILTs), thus following, in general terms,
Information Integration Theory’s (IIT) principles (see Anderson, 1996, 2008). This theory
provides an explanation of how perceivers cognitively integrate the many characteristics of an
object (e.g., the traits of a target person). According to it, a common way of cognitively
integrating information of a multi-attributed object is averaging the perceived level of its
attributes. However, the weight each attribute receives by perceivers does not need to be
constant. In other words, IIT allows for unequal weights being ascribed to the different
attributes of a target person. Additionally, IIT allows for the interaction of the attributes with
one another, thus going beyond the simple “piecemeal integration” (see Anderson, 2008).
This way, IIT approximates Asch’s (1946) configural model of people perception, which
In order to tackle this issue and explore the integration by followers of a leader’s
attributes with the backdrop of a leadership prototype, we propose the use of an unusual
methodological tool in leadership studies: conjoint analysis.
CONJOINT ANALYSIS
Conjoint analysis (CA) has been used for decades by scholars from different
disciplines such as Sociology (Wallander, 2009) and Marketing (Carroll & Green, 1995), and
its use has recently been advocated in fields such as Entrepreneurship (Lohrke & Woolley,
2010) and Political Science (Hainmueller, Hopkins, & Yamamoto, 2014). Different names
have been used for CA, including protocol analysis in information systems studies, or
contingent preference in the field of social policy research (Aiman-Smith, Scullen & Barr,
2002). In organizational contexts, this method is typically called policy-capturing and is used
to study decision making in areas such as personnel selection, job choice, and turnover
(Aiman-Smith, Scullen & Barr, 2002).
Karen and Barringer (2002) undertook a review of organizational studies that use
policy-capturing methods, and found no study that focuses on leadership. Indeed, the use of
CA to study leadership is scarce, with the exception of a study conducted by Soutar and
Ridley (2008). The authors argue that CA helps respondents to discriminate leader attributes,
while presenting a clearer picture of how followers perceive their leaders. However, they only
analyzed attributes’ main effects on followers’ willingness to work with a leader.
Conjoint analysis consists of a specific type of experimental design in which a (usually
large) set of factors is jointly manipulated. Standard experimental designs tend to focus on a
small set of factors and do not allow researchers to estimate which components of the
manipulation produce the observed outcome (Hainmueller, Hopkins, & Yamamoto, 2014).
For example, in the field of ILT, Lord, Foti, and De Vader (1984) used vignettes to study the
and anti-prototypical leaders. Although their design allowed the test of the aggregate effect of
prototypes, it was not able to estimate the effect of specific characteristics of the leader. Such
examination is precisely what conjoint analysis allows us to do.
By generating distinct leader profiles as a combination of different attributes (e.g., low
dedication, high intelligence and low sensitivity) and having the set of profiles evaluated by
different respondents, conjoint analysis allows for the decomposition of the effect of a
leader’s overall prototypicality level into specific attributes. In other words, the usual
conjoint analysis can be regarded as a within-subject experiment which allows for the
examination of the effects of each leader attribute (Hainmueller, Hopkins, & Yamamoto,
2014).
Besides the aforementioned distinction in the design (use of a higher number of
factors), another fundamental difference between the statistical analysis of CA and usual
experimental studies is the focus not only in the significance of each factor’s effect, but also
in their magnitudes (partworths) and relative magnitudes (importance). For instance, we can
find that intelligence is more relevant than dedication from perceivers’ standpoint, and
measure by how much a highly intelligent leader is preferred over a less intelligent one. The
difference between the partworths of the highest and lowest levels of each factor scaled to
percentage (so that the sum of all factors reaches 100%) is called the importance of that
factor, and offers a more intuitive measure of the relevance of the attribute (Rao, 2014). In the
end, the importance of an attribute represents the weight ascribed to it by perceivers during
impression formation processes (Anderson, 1996; Fiske, 1980).
In CA, data are usually analyzed using a regression model with the evaluation of each
leader profile as the dependent variable and the factors as independent variables (Lohrke &
Woolley, 2010). Effects coding (Cohen, Cohen, West, & Aiken, 2013) is used so that the
coefficients of the dummy variables representing the factors indicate deviations from the
Thus, hypothesis tests about partworths become tests about coefficients of a regression model,
which can be readily estimated in standard statistical packages. The usual assumptions of
regression analysis hold for CA, while the fact that different profiles are rated by the same
respondent have to be considered using clustered standard errors (Hainmueller, Hopkins, &
Yamamoto, 2014).
However, estimated partworths are average effects, which may be heterogeneous
across different groups of respondents (e.g., certain attributes of the leader may be differently
endorsed by men or women). This heterogeneity may be tackled by mixed designs using CA
(Moore, 1980, Rao, 2014), including between subjects factors (e.g., respondent gender or age)
that may interact with a leader’s attributes. In addition, the effect of an attribute may be
contingent to the level of another attribute (e.g., for charismatic leaders, intelligence may not
be as valued by the subordinates). Thus, interactions between the leader’s factors can be
explored as well, in the same manner in which they are treated in usual factorial experiments.
The use of CA brings a number of advantages compared to simple ratings of
importance. When the importance of each attribute is independently rated (e.g. as individual
items of a survey), the respondent may consider all attributes as equally important, as there is
no necessary trade-off between them. On the other hand, in conjoint analysis, the respondent
has to rate not the attributes themselves, but a set of profiles formed by a combination of
attributes in different levels. So, in the evaluation of profiles, the respondent is forced to
consider trade-offs among different attributes (Rao, 2014). Second, because this trade-off is
necessary, it mitigates problems regarding social desirability (Ones & Viswesvaran, 1999,
Wallander, 2009). A recent work by Tomassetti, Dalal and Kaplan (2016) demonstrated that
CA (what they call police capturing) was much more resistant to socially desirable
responding than any of the commonly used self-report techniques, such as Likert-type, forced
choice, ranking, and points distribution techniques. Third, CA is more comparable to
attributes (Karren & Barringer, 2002). Finally, by manipulating the cues and creating an
orthogonal design, CA avoids problems of multicollinearity that are common in field data
(Karren & Barringer, 2002).
OPENING ILT BLACK BOX WITH CONJOINT ANALISYS
In the present study, however, we focus only on exploring the cognitive
(recognition-based) side of leadership impressions formation –the “cold” processing (see Brown & Lord,
2001). We argue that the use of CA enables us to better comprehend followers’ cognitive
mechanisms first by quantifying the weight each ILT factor receive by perceivers. Thus, our
primary goal is to use CA to find which factors from the leader prototype impact more, and
which impact less followers’ perception of leadership effectiveness.
Additionally, CA allows us for testing the heterogeneity of attributes’ relative
importance among different respondents groups. Demographic differences such as gender and
age may generate different perceptions of what a leader prototype should be like (Nye &
Forsyth, 1991; Offerman, Kennedy, & Wirtz 1994). Although this attribute/respondent
interaction was studied previously by Epitropaki and Martin (2004), we argue that CA can
measure a different facet of ILTs. While in Epitropaki and Martin (2004) the comparison
between groups was made in terms of attributes’ prototypicality (see Lord, Foti & De Vader,
1984), CA can compare groups in terms of the weight (the importance) ascribed to each
attribute during the categorization process. In fact, our results demonstrate that some
attributes rated high in prototypicality can receive very low weights when they are perceived
along with other attributes similarly high or even lower in prototypicality.
Conjoint analysis can also extend the ILT literature by exploring the interaction of
attributes with one another. It means that the presence or absence of some factors may be able
to attenuate or magnify the importance of other factors (Hainmueller, Hopkins & Yamamoto,
Baumeister & Finkel, 2010) and Asch’s (1946) configural model of person perception, which
states that the importance of individual attributes changes in the context of all other attributes.
For instance, for a leader perceived as very sensitive, the importance of other attributes, such
as intelligence, may be enhanced, while for a highly tyrannical leader, the effect of positive
attributes can be partially spoiled.
Finally, CA can contribute for a better understanding of followers’ cognitive
mechanisms by making an empirical investigation of the connectionist approach’s premises,
which theorizes about the contextual sensitivity of followers’ ILTs (see Brown & Lord, 2001;
Lord, Brown, & Harvey, 2001). More specifically, we discuss how the activation of different
leadership prototypes (business, political, religious, and military) influences the weighting
pattern of attributes by perceivers.
OVERVIEW OF STUDIES
Four studies were conducted with similar procedures. In total, 879 participants were
recruited to participate in this series of studies through Amazon’s Mechanical Turk, which
has been shown to provide data “as reliable as those obtained via traditional methods”
(Buhrmester, Kwnag & Gosling, 2011, p. 3). The samples are restricted to US residents to
control for cultural differences. Considering all studies, more than 95% of the respondents
informed having some prior job experience and a boss or supervisor at least once. Incentives
paid to participants varied depending on the expected completion time of each task.
In study 1, two different CA techniques (rating and ranking) are used with distinct
samples to measure the average importance given by perceivers to each attribute of a generic
leader. In study 2 we improve the realistic nature of respondents’ task by using more
contextualized vignettes to describe the leaders’ profiles. The vignettes were presented in two
different ways: to half of the participants, the positive attributes were presented first in the
order. In study 3, two different sets of profiles are randomly allocated to participants, thus
allowing the test of interactions between the attributes themselves. Finally, Study 4 examines
the variability of attributes’ weighting pattern when different leadership schemas are
activated: business, political, military, and religious leaders.
STUDY 1 –ILT factors’ relative importancefor ones’ leadership perceptions
Study 1 focus on the main effects of each leader attribute on respondents’ leadership
perceptions. By comparing these main effects, we obtain each attribute’s relative importance.
In this experiment, we used two different CA techniques (rating and ranking), with distinct
samples. In the first one (rating technique) the description of each leader profile was rated by
respondents from 0 to 100, being 0 “a very ineffective leader” and 100 “a very effective
leader”. This technique is easy to implement, however, it does not necessarily force
respondents to reveal a preference between two distinct profiles. Another common approach
in conjoint analysis is the ranking technique, in which the respondent is forced to order the
descriptions in terms of preferences. Indeed, rating scales have shown to present better
(Carmone, Green, & Jain, 1978) or similar results to ranking scales (Kalish & Nelson, 1991).
However, given the wide use of ranking scales in CA studies, we collected data from
independent samples to perform both analyses. The same descriptions of leaders’ profiles
used in the first collection were ranked by respondents from 1 to 8. In both cases (rating or
ranking), by estimating the partworth of each leader attribute (their main effects), we can
measure their relative importance, i.e., the weight ascribed by perceivers to each piece of
information about the leader.
Participants
The sample consisted of 210 US participants. 52.5% were male, with an average age
Procedures
Participants were told they would read the descriptions of eight distinct leaders, each
one presenting a different set of attributes. No further information about the leader type or the
context was provided. After reading the descriptions they were asked to rate (first research
design) or rank (second research design) the leaders in terms of expected leadership
effectiveness. Finally, all participants answered demographic questions.
The six factors validated by Epitropaki and Martin (2004) were used to create the
leader descriptions. These factors (intelligence, dedication, sensitivity, dynamism,
masculinity, and tyranny) were given two levels each (e.g. intelligent/unintelligent). They
were orthogonally combined to form the eight descriptions presented to each respondent. To
make the quote of each attribute more representative of the respective factor, two items that
composed each factor in Epitropaki and Martin’s (2004) study were used. Table 1 shows the
attributes, their levels and descriptions used to manipulate leaders’ characteristics.
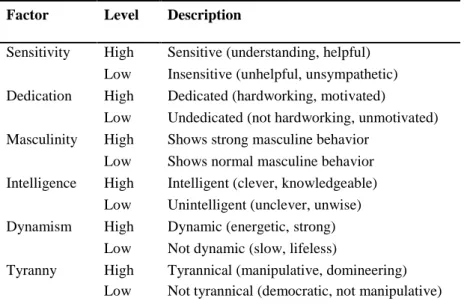
Table 1 -Attributes, levels and quotes used in the descriptions
Factor Level Description
Sensitivity High Sensitive (understanding, helpful)
Low Insensitive (unhelpful, unsympathetic)
Dedication High Dedicated (hardworking, motivated)
Low Undedicated (not hardworking, unmotivated)
Masculinity High Shows strong masculine behavior
Low Shows normal masculine behavior
Intelligence High Intelligent (clever, knowledgeable)
Low Unintelligent (unclever, unwise)
Dynamism High Dynamic (energetic, strong)
Low Not dynamic (slow, lifeless)
Tyranny High Tyrannical (manipulative, domineering)
Low Not tyrannical (democratic, not manipulative)
Assuming that “the best possible leader is rated high on the positive attributes and low
high on the negative attributes” (Junker & van Dick, 2014, p. 1157), we consider that when
we manipulate attributes’ levels, we are manipulating the distance from an ideal expected
value. In other words, we are manipulating the extent to which hypothetical leaders match
respondents’ prototypes.
To create a full factorial design, we would need 64 (26) profiles. However, by using a
fractional orthogonal design, the minimum number of profiles needed to allow for the study
of the main effects of each factor is 8 (Rao, 2014).
Results
When using a rating scale, the effects were estimated in a linear regression model with
the score ascribed to each leader profile as the dependent variable. In the case of the ranking
scale, we used rank-ordered logistic regression to estimate the coefficients, since the
dependent variable was categorical and ranked. In both cases, the independent variables were
the attributes represented by a set of effects coded variables (+1 [high], and -1 [low]). In these
models, the intercept (the constant term) represents the grand mean and the coefficients of
each variable are estimates of the deviations from the grand mean (partworths).
The results of the rating research design indicate that intelligence is the ILT attribute
that impacts most respondents’ leadership perceptions (33%, β=10.30, SE=.72, p<.001), when
compared to the other prototypical attributes (Table 2). Dynamism is the least important
factor (9%, β=2.75, SE=.62, p<.001). Among the anti-prototypical ones, only tyranny has a
significant effect on respondents’ perceptions (β=-1.61, SE=.69, p<.05). That is, the
masculinity level of a leader seems to be non-relevant for respondents’ cognitive processing
(β=-.10, SE=.55, p=.85). The partworth of tyranny is negative, which supports the idea that
this factor is part of an anti-prototype (Epitropaki & Martin, 2004).
The results of the ranking technique show little variation: the relative importance of
SE=.04, p<.001). Dynamism remains as the least important prototypical attribute (3%, β=.05,
SE=.04, p=.18), and, in this case, with a non-significant partworth (Table 2). Tyranny kept
negatively related to respondents’ leadership perceptions (β=-.13, SE=.04, p<.01), and
masculinity (β=-.07, SE=.04, p=.07), again, was non-significant at 5% significance level. On
aggregate, the relative importance of the attributes is: intelligence (31%), sensitivity (30%),
dedication (24%), dynamism (6%), tyranny (7%), and masculinity (2%).
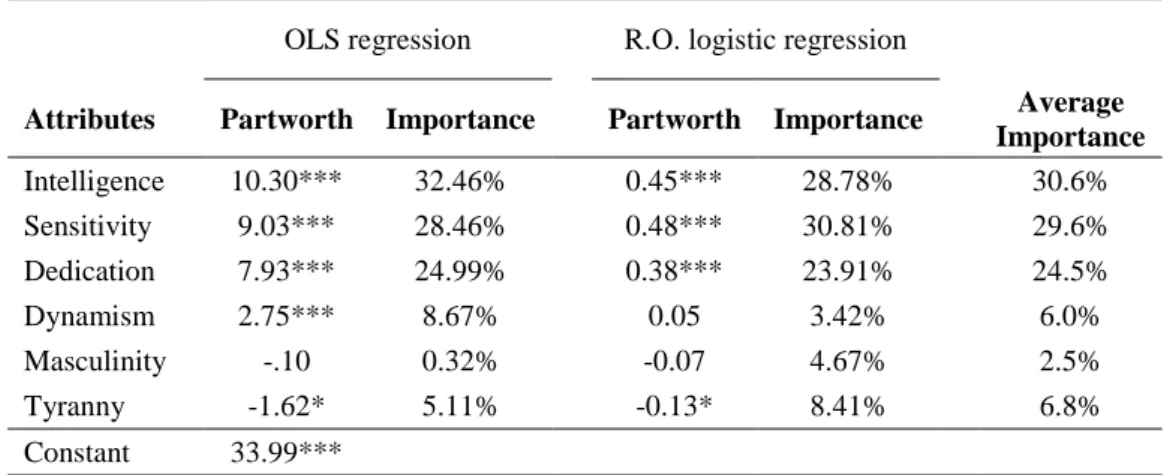
Table 2 –Attributes’ partworths and importance estimates
OLS regression R.O. logistic regression
Attributes Partworth Importance Partworth Importance
Average Importance
Intelligence 10.30*** 32.46% 0.45*** 28.78% 30.6%
Sensitivity 9.03*** 28.46% 0.48*** 30.81% 29.6%
Dedication 7.93*** 24.99% 0.38*** 23.91% 24.5%
Dynamism 2.75*** 8.67% 0.05 3.42% 6.0%
Masculinity -.10 0.32% -0.07 4.67% 2.5%
Tyranny -1.62* 5.11% -0.13* 8.41% 6.8%
Constant 33.99***
* p<.5; ** p<.01; *** p< .001. The OLS regression refers to the rating technique, while the rank-ordered logistic regression refers to the ranking technique.
The R2 of the linear regression model is 34.3%, which is limited for different reasons.
One of them is that the estimated partworths are not allowed to vary across individuals. In
other words, the model parameters consider that every respondent has the same leader
prototype. However, the conjoint model can be also analyzed at the individual level – with
one different set of partworths estimated for each respondent. In this case, the mean R2 is
94.4%, which is similar to the values usually obtained in this type of analysis (Rao, 2014).
This difference of the R2 between the aggregated and the individual level models suggests that
the partworths for the different levels of the leader’s attributes are quite heterogeneous across
it to some of respondents’ characteristics. Thus, we examine, in study 2, the influence of some
respondents’ demographic characteristics in this leader impression formation process.
Discussion
The results of Study 1 show that the ILT attributes are not equally considered by
respondents. While some attributes play an important role when forming impressions of a
leader, others are of little relevance, or not relevant at all. In other words, each leader
attribute, in fact, receives a different weight when they are integrated by perceivers (see
Anderson, 2008). That is, being a leader close/far to the prototype in some of the dimensions
impacted more respondents’ leadership perceptions than in other dimensions.
Across the two CA techniques, intelligence and sensitivity were the most important
factors among the prototypical ones, followed by dedication. Dynamism was consistently the
least important trait, reaching the point of being non-significant in the ranking design, which
suggests that a follower’s cognitive processing outcomes will be little affected by this leader
attribute. On the contrary, if a leader is perceived, for example, either as unintelligent or
insensitive, the perceived effectiveness of this leader can decrease considerably.
In relation to the anti-prototypical attributes, we found that the partworths of tyranny
and masculinity were always negative, although for masculinity it was consistently
non-significant. Regarding tyranny, the result was not surprising, considering that this attribute
“undermine the motivation, well-being or job satisfaction of subordinates” (Einarsen, Aasland
& Skogstad, 2007, p. 212). Although tyrannical leadership may actually help the organization
to reach its goals (Ashforth, 1994), it is clear that the subordinates did not perceive this
potentially positive effect of tyranny.
Additionally, the results shed some light on the debate of whether masculinity should
be used as an attribute of the leader anti-prototype. Topakas (2011), who also used Epitropaki
dimension of the anti-prototype construct after making goodness-of-fit tests. Accordingly, our
results suggest that masculinity is not a relevant leader attribute for followers’ cognitive
categorization processes, especially in comparison to other attributes.
Since the results of the rating and ranking technique are comparable (see Carmone,
Green, & Jain, 1978; Kalish & Nelson, 1991), and considering that the latter approach is more
demanding for respondents, who need to constantly compare each pair of profiles (Sayadi,
Roa & Requena, 2005), we decided to use the rating technique in next studies.
STUDY 2 – Improving the experimental realism by using vignettes
Since we consider that simply by combining traits’ short descriptions (see Table 1) to
form each leader profile could make them too artificial, thus threatening the external validity
of our findings, we created more contextualized vignettes based on the same combinations of
attributes used in the prior experiment. Vignettes can be defined as ‘‘a short, carefully
constructed description of a person, object, or situation, representing a systematic
combination of characteristics’’ (Atzmüller & Steiner, 2010, p. 128).
According to Aguinis and Bradley (2014) researchers often face a dilemma: deciding
between implementing experimental designs that yield high levels of confidence in terms of
internal validity, but present difficulties related to findings’ generalizability, or implementing
non-experimental designs that often maximize external validity but whose conclusions are
inconclusive in terms of causality. Aguinis and Bradley (2014), however, argue that the use of
vignettes in experiments, such as conjoint analysis, helps researchers to address the
aforementioned dilemma (see also Atzmüller & Steiner, 2010). They claim so, because by
using vignettes the level of realism present in the stimulus situation is enhanced. Indeed,
Hainmueller, Hangartner, and Yamamoto (2015) demonstrated that experimental vignettes
and conjoint analysis can approximate real-world decisions by comparing the results of these
However, in this study we were concerned about vignettes’ length, considering that
each respondent would have to rate 8 of them, and it could reduce response quality due to
fatigue (Aguinis & Bradley, 2014). Then, taking into account the recurrent non-significance
of masculinity in the two prior experiments, and the inconsistency of previous studies in
relation to the role of this attribute (see Topakas, 2011), we decided to not use the masculinity
factor in the next analyses.
The vignettes were presented to respondents in two different ways. To half of the
respondents, the positive attributes were presented first, and the negative ones last in the
vignette. To the remaining participants, the negative attributes of the leader were presented
first. Our main goal with this procedure is to analyze whether attributes’ relative importance
is robust after changing their presentation order. Additionally, we can verify the consequences
of a god/bad ‘first impression’ of leaders, i.e., the occurrence primacy effects in impression
formation (Anderson, 1961; Asch 1946). We finish Study 2 by analyzing the interaction
between a leader’s attributes and respondents’ gender, age, and education level. This analysis
allows us to assess the heterogeneity of attributes’ importance for different groups of
individuals.
Participants
The sample consisted of 209 US participants. 53.5% were male, with an average age
of 38.4 years. 63.5% of the respondents reported having at least a college degree.
Procedures
Participants were told they would read the descriptions of eight different leaders.
Again, no further information about the type of leader or the context was provided. After
reading the descriptions, they were asked to rate the effectiveness of each leader profile on a
A sample vignette used to describe the leader is “This leader is always understanding
and sincere with his followers, giving them psychological support when it is necessary
[Sensitivity]. Because he is clever and well educated, he can solve problems quickly and take
good decisions [Intelligence]. People say he is motivated and committed to the job
[Dedication], as well as he is very energetic and strong at work [Dynamism]. His weak point
is that he tends to be manipulative and domineering when dealing with followers [Tyranny]”.
The traits inside the brackets were not shown to respondents.
Results
The results were very similar to the ones found in the first study (Table 3), with no
change in the order of importance among prototypical attributes. That is, intelligence remains
as the most important attribute (β=7.22, SE=.47, p<.001), while dynamism was the least
important (β=2.31, SE=.38, p<.001). The only difference was related to the importance of
tyranny (β=-5.05, SE=.48, p<.001), which increased to 20% (in study 1 it was on average
7%). We hypothesize that it may be due, in part, to the exclusion of the masculinity factor. In
other words, tyranny may have concentrated now the negative effects that in study 1 were
shared with masculinity.
No statistically significant change of attributes’ relative importance was observed
between the two different conditions (positive/negative attributes first). Nonetheless, we
found that when the positive attributes were presented first in the vignette, leaders were, on
average, better evaluated than when the negative attributes were presented first (difference of
means = 11.13, SE = 1.87, p<0.001). It represents an expressive increase of 26.8% in terms of
leadership effectiveness perception. That is, although attributes’ partworths did not change
with attributes’ sequence reversal, the overall evaluation of the leader changes significantly.
Table 3 – Vigenettes design results
Attributes Partworths Importance
Intelligence 7.22*** 29.21%
Sensitivity 6.30*** 25.49%
Dedication 3.84*** 15.53%
Dynamism 2.31*** 9.34%
Tyranny -5.05*** 20.43%
Positive first 11.13*** -
Gender x Sensitivity 2.56*** -
Gendera -3.68* -
Constant 41.46***
* p<.5; ** p<.01; *** p< .001. "Positive first" refers to the condition where positive attributes were presented fist in the vignette. Its coefficient represents the increase in relation to the contrary condition. a0: male; 1: female.
In order to partially explain the heterogeneity of attributes’ partworths at the individual
level (see study 1) we performed interaction tests between attributes and respondents
characteristics. We have found a significant interaction between respondents' gender and a
leader’s sensitivity (β=2.56, SE=1.03, p<0.01), meaning that female respondents have given
more importance to this attribute (see Figure 1). We did not find any interaction between
leaders’ attributes and respondents’ age or educational level.
Figure 1 – Partworths of Sensitivity and Tyranny by Gender
Discussion
The results of study 2 shows that study 1’s findings are rather robust. By using
Hainmueller et al., 2015), the weighing pattern of attributes by respondents practically does
not change (Table 3). In other words, among the prototypical attributes, intelligence and
sensitivity are always the most valued ones, followed by dedication and dynamism. Although
we are cautious to claim for the external validity of these findings, we consider that the
consistency between study 1’s and 2’s results, which together contemplates 4 different
research designs, provides a good idea of ILT factors’ relative importance from perceivers’
standpoint. Our findings are robust to changes in the dependent variable (rating vs. ranking),
as well as to changes in the independent variables (normal description form vs. vignettes, and
‘positive first’ vs. ‘negative first’ when using vignettes).
The observed difference in perception of leadership effectiveness between respondents
that rated vignettes with positive leader attributes presented first and respondents that rated
vignettes with negative attributes presented first suggests the occurrence of primacy effects in
impression formation (see Anderson, 1961; Asch 1946). However, the change – a 26%
increase when positive attributes were presented first – was only in the constant term (the
grand mean), with no significant changes of attributes’ partworths. This finding suggests that
followers’ overall leadership perceptions can be quite influenced by a good/bad first
impression of a leader, but not the importance of each individual attribute.
Our analysis of interaction between a leader’s attributes and respondents’
characteristics also revealed a significant effect. Sensitivity was moderated by gender,
showing that women give more importance than men to this attribute. This result is in
conformity with Deal and Stevenson’s (1998) study, which found that female respondents
consider some attributes related to sensitivity (e.g., being helpful, and being aware of others
feelings) more characteristic of prototypical leaders than male respondents. Since individuals’
ILTs are developed through past interaction with leaders (see Epitropaki & Martin, 2004), it
However, our results show that the interactions between age and educational level, and the
leader attributes were non-significant.
Although the variability of ones’ leadership perceptions may be partially explained by
their demographic characteristics, we expect that this heterogeneity can be further explained
by the interaction effects between attributes themselves. It makes the perceptual process more
complex, since the relative importance of an attribute may be influenced by the presence or
absence of other attributes, such as a more holistic approach to impression formation would
suggest (see Fiske & Taylor, 2013; Baumeister & Finkel, 2010). The data collection for
studies 1 and 2, however, does not allow us to test the interaction between a leader's
attributes. For this purpose, we move on to study 3.
STUDY 3 – Interactions between a leader’s attributes
While the two prior studies aimed at identifying the relative importance of the ILT
factors proposed by Epitropaki and Martin (2004), that is, the cognitive weight ascribed by
perceivers to each of a leader’s attributes, study 3 examines a more complex feature of
leadership perceptions formation: the presence of some attributes can influence the weight
ascribed to others. Thus, now we use conjoint analysis to explore the interaction of ILT
factors with one another.
Participants
The sample included 150 participants. Participants were mainly female (59.3%), with
Procedure
As in the previous studies, participants were told they would read a series of
descriptions of different types of leaders. After reading the descriptions, they were asked to
rate the each leader profile in terms of effectiveness on a scale from 0 to 100. Finally, all
participants answered demographic questions.
In this study, both the main effects and the interactions between factors are analyzed;
accordingly, a different research design is required. Similar to Study 1, the ILT factors
described by Epitropaki and Martin (2004) were used to create the leader descriptions, with
the exception of masculinity, that showed to be consistently non-significant in prior
experiments. All attributes were given two levels (high or low, as shown in Table 1). Again
we used a fractional factorial design in order reduce the number of profiles each respondent
would have to rate. For an analysis of 2-way (but not all higher order) interactions, one of two
different sets of 8 leader profiles was randomly assigned to each respondent. In each set of 8
profiles (randomly ordered), main effects are orthogonal, and in the combination of both sets,
all two-way interactions are orthogonal as well.
Results
We found that the interaction between Tyranny with Dedication (β=-.85, SE=.42
p<.05) is negative and significant. This finding indicates that when a leader is seen as
tyrannical, dedication have a smaller positive effect on individuals’ perception of leadership
effectiveness. On the other hand, interactions of Dedication with Intelligence (β= 2.24,
SE=.55 p<.001), Sensitivity (β=2.57, SE=.63 p<.001), and Dynamism (β=1.06, SE=.52
p<.05) are significant and positive. It means that, for a dedicated leader, all other prototypical
attributes have a higher positive effect on individuals’ perception of leadership effectiveness.
All other interactions are non-significant. The R2 of the model was 33.7%, with a small,
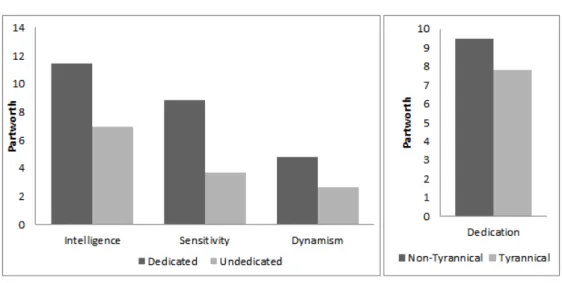
Figure 2 – Two-way interactions between attributes
Discussion
This study shows that leadership perceptions are not simply modeled by the linear
combination of a leader’s attributes. Instead, we observe that the presence of some factors are
able to enhance, or diminish, the effect of other factors, which is in accordance with Asch’s
(1946) configural model, and the holistic approach to impression processes (see Baumeister &
Finkel, 2010). In the case of dedication, the moderation effect of this attribute is positive and
very substantial. The importance of intelligence increased 64% when a leader was perceived
also as dedicated (Figure 2). In relation to sensitivity and dynamism, the increase was even
higher: 139% for sensitivity and 80% for dynamism. Dedication is characterized “by a sense
of significance, enthusiasm, inspiration, pride, and challenge at work” (Salanova, Agut &
Peiró, 2005, p. 1218), and a motivational force that leads to better performance (Van Scotter
& Motowidlo, 1996). The meaningful spillovers of dedication on other prototypical attributes’
effects confirm that this attribute is very powerful, and has a key role on individuals’
leadership perceptions formation.
Another effect captured by the interaction analysis was that, if a leader is perceived as
tyranny. This result shows that tyranny and abusive behaviors are so damaging to the
subordinate (Tepper, 2000), that it can partially spoil the positive effects of some prototypical
attributes of a leader.
Although our findings thus far permit a better comprehension of followers’
categorization heuristics relative to the use of their ILTs, all of the results are limited to a
general leader prototype. Thus, we move on to study 4 to examine how the activation of
specific leadership schemas (e.g., of a military or a business leader) can impact the
importance given by perceivers to each ILT factor.
STUDY 4 – Relative importance of ILT factors across domains
The connectionist approach to leadership categorization (e.g., Brown & Lord, 2001;
Lord, Brown, & Harvey, 2001) states that the leadership schema or prototype activation is
context dependent, which means that the characteristics a follower expect leaders to have in,
for instance, a business environment will be different from the characteristics expected from a
leader in a military environment. Thus, we presume that the relative importance of each ILT
factor will also vary when different leadership schemas are activated.
Since previous ILT studies have focused mainly on the business context (e.g., Van
Quaquebeke, Graf & Eckloff, 2014; Gerstner & Day, 1994; Epitropaki & Martin, 2004), we
believe that an empirical examination of leadership categorization across different domains
can contribute to a better knowledge of ILTs.
Participants
The sample included 310 participants. 53,3% were female, with an average age of 38.5
Procedure
The procedure in study 4 was similar to those used in previous studies using a rating
technique, with the only difference being that respondents were randomly assigned to one of
four leadership contexts (business, military, political, and religious). In order to activate these
specific leadership prototypes in their minds, before starting the CA experiment, respondents
were asked to write down two activities commonly performed by a leader in that context.
Additionally, we asked the participants assigned to each condition to indicate, on a 9-points
Likert scale, the extent to which they thought each ILT factor was characteristic of an ideal
leader, being 1 “Not at all characteristic” and 9 “Very characteristic”. For example, the
participants ascribed to the religious context had to indicate how much they thought each
attribute was characteristic of an ideal religious leader. This measure can be taken as the
prototypicality of an attribute (Lord, Foti & De Vader, 1984), and we use it to make a
comparison between the actual weight ascribed to attributes (captured by CA) and the stated
prototypicality by respondents. Finally, all participants answered demographic questions.
Results
In order to assess the heterogeneity of attributes’ partworths across domains we
created dummy variables for each of the leadership contexts. We found significant
interactions between attributes’ levels and the context, meaning that some attributes receive
different weights, depending on the type of leadership schema activated in respondents’
minds.
As shown in Table 4, the partworth of intelligence was found to be significantly
higher for business leaders than for political (βdiff =2.24, SE=1.16, p=.05), and religious ones
(βdiff =2.82, SE=1.12, p<.05), while the partworth of tyranny was significantly more negative
for religious leaders than for military (βdiff =-4.15, SE=1.13, p<.001), political (βdiff =-2.30,
of tyranny was non-significant for military leaders (β =-.61, SE=.73, p=.41), meaning that this
attribute apparently does not affect people’s perception of leadership effectiveness when the
prototype of a military leader is activated. Also, sensitivity was significantly less important
for military leaders than for religious (βdiff =-2.96, SE=1.09, p<.001) and business ones (βdiff
=-1.97, SE=.83, p<.05), while dynamism was less important for religious leaders in
comparison to military ones (βdiff =-1.98, SE=1.04, p=.05). In relation to dedication, we found
that this attribute is more important for business leaders than to political (βdiff =1.93, SE=.59,
p=05) and religious leaders (βdiff =2.43, SE=1.09, p<.05).
Table 4 –Attributes’ partworths by leadership context
Partworths
Attribute Business Political Military Religious
Intelligence
11.61*** 9.37*** 10.63*** 8.78***
>P†; >R* <B† <B*
Dedication
9.00*** 7.06*** 8.06*** 6.65***
>P†; >R* <B† <B*
Sensitivity
8.42*** 7.31*** 6.44*** 9.41***
>M* <B*; <R** >M**
Dynamism
3.35*** 2.56*** 3.85*** 1.86*
>R† <M†
Tyranny
-1.71* -2.46*** -0.61ns -4.76***
>R*** <M†; >R* >P*; >R*** <B***; <P*; <M***
nsnon-significant; †p=0.05; *p<0.05; **p<0.01; ***p<0.001. B = Business; P = Political; M = Military; R = Religious.
The R2 ranged from 40.0% for business and 34.1% for military leaders to 31.7% for
political and 29.4% for religious leaders. The higher R2 associated to business leaders shows
that there is more consensus among respondents in relation to the role of each ILT factor in
this context, maybe because it is the leadership context individuals are more exposed to. It
may also derive from the fact that the ILT factors used in this study were determined by using
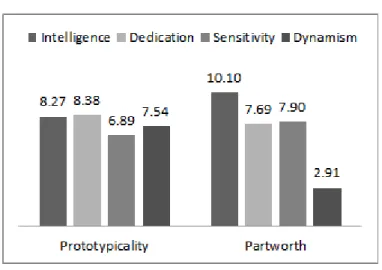
After the CA experiment, the respondents indicated, on a 9-points Likert scale, how
much they thought each ILT factor was characteristic of an ideal leader. In order words, they
were asked to indicate the prototypicality of the 4 prototypical ILT attributes. Figure 3 shows
both attributes’ average prototypicality and attributes’ average partworths, considering all
contexts. We verify that the weights ascribed by perceivers to a leader’s attributes are much
more heterogeneous than their prototypicality (see Lord, Foti & De Vader, 1984).
Interestingly, we found that the prototypicality of dynamism is higher than sensitivity’s one
(t(309) = 5.38, p<0.001), even though this attribute showed to be the least important across all
our studies.
Figure 3 –Comparison between attributes’ prototypicality and attributes’ partworths (average of all
leadership contexts)
Discussion
Ours results support the schema activation hypothesis proposed by the connectionist
theories (e.g. Brown & Lord, 2001; Lord, Brown, & Harvey, 2001). Indeed, the activation of
different leadership prototypes makes individuals integrate leaders’ attributes in different
ways, by ascribing higher or lower weights to them. Nevertheless, we also observe a stability
partworths with one another across the 4 leadership domains, we verify that intelligence is
always among the most important attributes, while dynamism is always the least important
among the prototypical ones. This means that, although individuals’ prototypes are fluid and
contextually sensitive, they tend to keep their coherence and consistency (Brown, & Harvey,
2001).
An interesting finding is that the importance of an attribute seems to be unrelated to its
prototypicality. For instance, although individuals state that dynamism is very characteristic
of effective leaders (even more characteristic than sensitivity), the importance that this
attribute receives when it is processed by respondents is very low. Actually, this is one of the
advantages of CA. While in a survey individuals indicate directly the importance of an
attribute (or how characteristic it is of a leader, for instance), in CA individuals rate an overall
profile composed by many attributes, without noticing exactly the importance they give to
each attribute. This corroborates our argument that CA can provide more accurate results
since it approximates real-world decisions, where judgments are made taking into account the
overall situation, and not isolated attributes (Karren & Barringer, 2002).
CONTRIBUTIONS, LIMITATIONS AND FUTURE RESEARCH
This article contributes to the ILT literature in several ways. First, we show that the
importance given by participants to a leader’s prototypical and anti-prototypical attributes is
very heterogeneous. In other words, some attributes (e.g., intelligence) are more important for
ones’ effective leadership perceptions than others (e.g. dynamism). This finding contributes to
ILT literature since, until now, the effects of the proximity to the prototype were analyzed
only in aggregate terms (e.g. Epitropaki & Martin, 2005). In other words, attributes were
taken as being similarly important. Backed by socio-cognitive theories on impression
formation, such as Information Integration Theory (Anderson, 1996, 2008), we showed that
Second, our results revealed that recognition-based leadership perceptions are not the
outcome of simple “piecemeal integration” (see Fiske & Taylor, 2013). That is, by performing
interaction analysis between attributes, we show that the importance of a leader’s attribute is
contingent on the presence of other attributes. Our results are consistent with the predictions
of Asch’s (1946) configural model of people perception and the holistic approach to
impression formation (Baumeister & Finkel, 2010).
Third, we found support for the leadership schema activation hypothesis proposed by
the connectionist approach (e.g. Brown & Lord, 2001; Lord, Brown, & Harvey, 2001). By
manipulating the leadership context, we demonstrated that some attributes can be more/less
valued by perceivers. However, in spite of this sensitivity to the context, we also verified that
individuals’ ILTs are somehow consistent, such as the connectionist theories also predict. For
instance, across all contexts, intelligence showed to be one of the most important factors,
while dynamism was always the least important attribute among the prototypical ones. It
supports the idea that a superordinate leadership prototype exists and affects all the more
basic levels (e.g., business, political, religious, and military leaders) (Lord, Foti & De Vader,
1984).
Our study also has a methodological contribution. Conjoint analysis showed to be a
rather valuable tool for ILT research since it can capture the importance ascribed by
perceivers to each of a leader’s attributes individually. Because each attribute is presented to
participants in the context of all other attributes simultaneously, CA’s experimental design
approximates real-world situations (Karren & Barringer, 2002). Additionally, CA presents
advantages when compared to common self-report methods, such as the resistance to socially
desirable responding (Tomassetti et al., 2016), and the mitigation of multicollinearity
problems, common in field data (Karren & Barringer, 2002).
Despite these contributions, our study presents some limitations. First, our study
However, we admit that these perceptions can have many other determinants, such as
followers’ affective processing, and causal attributions for performance (Hall & Lord, 1995).
Future research can include other elements in the CA experiments. Enriched experiments can
lead to a more complete comprehension of followers’ leadership perceptions formation.
Second, although we consider that the 6-factor ILT model proposed by Epitropaki and Martin
(2004) allowed us to test our argument, we also think it can impose some limitations to our
conclusions. It can be that followers in real-world situations give attention to other attributes,
besides the ones proposed by this model. Thus, future works can focus on different attributes,
proposed by other ILT studies (e.g., Offerman, Kennedy & Witz, 1994; Gerstner & Day,
1994; Schyns & Schilling, 2011; Hartog et al., 1999). Finally, our sample consisted of only
US residents, more specifically, Mturk respondents. Although more than 95% of them
reported having some job experience and a boss at least once in life, we are cautious to claim
for the generalizability of our findings. We believe that the investigation of followers’
leadership perceptions with CA in different contexts and cultures is an avenue for future
REFERENCES
Aiman-Smith, L., Scullen, S. E., & Barr, S. H. 2002. Conducting Studies of Decision Making
in Organizational Contexts: A Tutorial for Policy-Capturing and Other Regression-Based
Techniques. Organizational Research Methods, 5(4): 388–414.
Allenby, G. M., Arora, N., & Ginter, J. L. 1995. Incorporating prior knowledge into the
analysis of conjoint studies. Journal of Marketing Research, 32(2): 152–162.
Almoharby, D., & Neal, M. 2013. Clarifying Islamic perspectives on leadership. Education,
Business and Society: Contemporary Middle Eastern Issues, 6(3/4): 148–161.
Atzmüller, C., & Steiner, P. M. 2010. Experimental vignette studies in survey research.
Methodology.
Anderson, N. H., & Barrios, A. A. 1961. Primacy effects in personality impression formation.
The Journal of Abnormal and Social Psychology, 63(2), 346.
Anderson, N. H. 1971. Integration theory and attitude change. Psychological Review, 78(3),
171.
Anderson, N. H.1996. A Functional Theory of Cognition. Psychology Press.
Anderson, N. H. 2008. Unified social cognition. Psychology Press.
Aguinis, H., & Bradley, K. J. 2014. Best practice recommendations for designing and
implementing experimental vignette methodology studies. Organizational Research
Methods, 17(4), 351-371.
Asch, S. E. 1946. Forming impressions of personality. The Journal of Abnormal and Social
Psychology, 41(3), 258.
Ashforth, B. 1997. Petty tyranny in organizations: A preliminary examination of antecedents