Ayan Mukhopadhyay1,Suman Tiwari2, Ankit Narsaria3and Bhaskar Roy Karmaker4
1
Cognizant Technology Solutions India Pvt. Ltd. India
2Indian Institute of Foreign Trade
Kolkata, India
3
Cognizant Technology Solutions India Pvt. Ltd. India
4
RCC Institute of Information Technology Kolkata, India
Abstract
The question of financial health and sustenance of a firm is so intriguing that it has spanned numerous studies. For investors, stakeholders and lenders, assessing the risk associated with an enterprise is vital. Several tools have been formulated to deal with predicting the solvency of a firm. This paper attempts to combine Data Envelopment Analysis and Multi-Layer Perceptron (MLP) to suggest a new method for prediction of bankruptcy that not only focusses on historical financial data of firms that filed for bankruptcy like other past studies but also takes into account the data of those firms that were likely to do so. This method thus identifies firms that have a high chance of facing bankruptcy along with those that have filed for bankruptcy. The performance of this procedure is compared with MLP. The suggested method outperforms MLP in prediction of bankruptcy.
Keywords:Operation Research, Data Envelopment Analysis, Super Efficiency DEA, Bankruptcy, Artificial Neural Networks, Multi-Layer Perceptron, Finance.
1. Introduction
Bankruptcy prediction has been a widely studied topic in the last century. Prediction of corporate bankruptcy is particularly important as bankruptcy can affect the economy of a country severely. Successful prediction of bankruptcy is therefore an important area of study. Stakeholders also have significant interest in the prediction of bankruptcy because it can provide them with early warnings. It is also a matter of immense importance to banks, as they need to assess and judge the future of a firm before extending loans. Wrong credit decisions can have important consequences - commercial risk (e.g. loss of profit) or credit risk (loss of interest or principal).
Traditional statistical methods such as univariate approaches in [1], multivariate approaches, linear multiple discriminant approaches (MDA) in [2], [3], and multiple regression[4] are based on the linearity assumption, as well as normality assumptions which are difficult to apply to the real world problem. On the other hand, machine learning and artificial intelligence techniques have been successfully applied in corporate financial bankruptcy forecasting recently ([5] and [6]). Therefore, an artificially intelligent technique is the primary method used in this paper.
We note that most of the studies made regarding prediction of corporate bankruptcy are based on data pertaining to filing of bankruptcy i.e. companies that filed for bankruptcy and the ones that did not. It is interesting to note that laws pertaining to bankruptcy are different in different countries. The laws of a particular country affect the data and therefore the studies made in it. [7] pointed out that generally, the resolution of bankruptcy depends greatly on the broad institutional context within which firms in specific countries operate. In addition, as noted by [8], there are countries that have more bankruptcy options (such as reorganization and out-of- court mediation). This means that a particular company in a financial crisis may avoid bankruptcy while another company in a similar situation may not. When the historical financial data of such firms is used for the purpose of prediction of bankruptcy, erroneous results may be observed.
of the terms bankruptcy, insolvency, liquidation and dissolution. There is no regulation or statute legislated upon bankruptcy that denotes a condition of inability to meet the demand of a creditor i.e. the cash flow test as is common in many jurisdictions. Therefore, studies made using Indian data that are based on filing of bankruptcy are influenced by the absence of clearly mentioned laws.
In addition, companies whose general financial condition is poor can avoid bankruptcy by merger with another firm, selling off the company to a better management that avoids bankruptcy or by acquiring loans or funds from appropriate sources. In the real world, these are governed by the reputation of the company in the market, its history, influence and often the size of the firm. Another company, in the same financial condition may not be able to avoid bankruptcy because of its inability to avail the means mentioned before. For instance, formal bankruptcies are less common among firms with single banking relationships, and are more common in firms with more complex capital structures [10]. Therefore, the type of the firm under consideration is also important. Thus in order to avoid losses on the part of investors, shareholders and banks, it is important that the general financial condition of the firms is used forprediction of bankruptcy and judging an investment. An investment must therefore be judged on whether a firm has a high probability of being in a state from which it could get bankrupt or not, instead of only checking whether it is similar to other firms that have been bankrupt in the past
As already mentioned before, a company facing financial crisis may avoid or face bankruptcy. If one company that avoids bankruptcy is used for training the system, errors can arise in prediction of a firm in a similar financial condition as it may eventually face bankruptcy and vice-versa. This paper tries to combine Multi-Layer Perceptron (MLP) with Data Envelopment Analysis (DEA) and suggests a procedure that focuses not only on filing of corporate bankruptcy but also on the comparative financial condition of firms while predicting bankruptcy of other units.It also assesses the comparative performance of the suggested method with the standard MLP procedure.
The basic idea of this paper is that if a large number of non-bankrupt firms are used for training the system, then the worst performers among them clearly face financial situations that are significantly poorer than the rest. This set of worst performers, then merged with companies that actually faced bankruptcy can be used to identify firms who can face financial distress. This approach not only addresses the flexibility of bankruptcy laws in many nations and the financial conditions of firms while predicting bankruptcy, but also reduces the net misclassification cost of errors by reducing Type I
errors.This happens because by using the above merged set, the chances that a firm that has been predicted to be safe eventually faces bankruptcy are comparatively lower.
The rest of the paper is organized as follows. Section 2 provides a brief review of bankruptcy studies made so far. Section 3 describes the methodology used in the paper. Section 4 describes the dataset used and its descriptive statistics. Results and comparisons are provided in Section 5. Section 6, the last section, discusses the conclusions and future scopes of studies.
2. Review of literature
The study of prediction of bankruptcy dates back to the beginning of 1930s. In the era before late 1960s, the research was based on Univariate study as in [11]. [2] published the multivariate study regarding bankruptcy in 1968. [12] provided a comprehensive review that categorized the methodologies as follows - statistical models, artificially intelligent expert system models and theoretic models. Statistical models include Univariate Analysis ([13], [14]), Multiple Discriminant Analysis (MDA) ([2], [15]), Linear Probability model ([16], [17], [18]), Logit model ([16], [17]), Probit model ([16], [17]), Cumulative Sums (CUSUM) procedure ([19], [20]) and Partial Adjustment Process ([18], [21]). Artificial Intelligent Systems include Decision Tree based model, Case Based Reasoning (CBR) model ([22]), Neural Network based model ([23], [24]), Genetic Algorithm based model ([25], [26] and Rough Sets model ([27], [28]. Theoretic category of models includes Balance Sheet Decomposition measure (BSDM) ([29], [30]), Gambler’s Ruin theory ([14], [31]), Cash Management theory and Credit Risk theory ([32]). Data Envelopment Analysis does not fall into any of these categories as described by [12]. DEA as a classifier is studied in [32], [34], [35], [36], [37], [38], [39], [40] and [41]. Among these nine studies, the last five studies are direct application of DEA as a potential method for prediction of bankruptcy. This paper tries to suggest a new method for the prediction of bankruptcy by a combination of DEA and MLP.
3. Methodology
as is the case of MLP, although it was [20] who developed it. It takes the form of an iterative algorithm that minimizes an objective or error function that measures the difference between the predicted value (output of the network) and the dependent variable (target). This is an example of supervised learning, and is carried out through back-propagation, a generalization of the least mean squares algorithm in the linear perceptron. MLP thus maps sets of input data onto a set of appropriate output and can be usedto distinguish data that is not linearly separable.
Data Envelopment Analysis, the other method used in the paper was first suggested by [42]. DEA is a non-stochastic and nonparametric fractional linear programming approach. Formally, when ‘j’ units consume ‘i’ inputs to produce ‘r’ outputs, the efficiency of the j0th unit is computed as,
Maximize ∑ u y Subject to ∑ v x = 1
∑ u y − ∑ v x ≤ 0for all j, v, u ≥ Ɛ (1)
This normal output oriented DEA model classifies units on the frontier as efficient and units enveloped by the frontier as inefficient, where the latter, given their current input consumption, should be able to increase their output production to the extent indicated by their efficiency score. Thus, the bestperformers are on the envelopment surface or best practice frontier, and the poor performers are farthest away from the frontier.
This paper takes the super efficiency DEA under consideration. The super efficiency ranking method was developed in [43]. DEA score for the inefficient units is considered as their rank scale. In order to rank scale the efficient units, the efficient units are allowed to acquire a score greater than 1 by dropping the constraint that bounds the score of the unit being evaluated. The primal form of the model is given as-
Maximize ∑ u y Subject to ∑ v x = 1
∑ u y − ∑ v x ≤ 0for all j, j≠ j0,v, u ≥ Ɛ (1)
The unit under consideration is compared with the linear sample of all other units in the sample. Thus, the method measures the distance of the unit k from the new frontier that is obtained after it has been excluded. It is impossible to rank efficient DMUs obtained through CCR model, but the distribution among them is desirable to identify the ace performer among all the efficient DMUs. In principle, in super efficiency model, any DMU can take value more than unity, but DMUs having the score of less than unity
would find their relative score unaffected by the exclusion of super-efficient DMUs.
This paper suggests a method that primarily focuses on taking into account the overall financial situation of a group of firms usedfor prediction of bankruptcy. This includes firms that have filed for bankruptcy and the ones whose financial situation is the poorest among all the non-bankrupt firms under consideration. The basic idea, as mentioned above, is that filing of bankruptcy is not the most appropriate index for predicting bankruptcy. This is because rules and laws concerning bankruptcy and the real-world scenario show that a certain firm that faces bankruptcy can opt for other ways to avoid such a consequence. This needs to be taken into account while predicting the future of other firms.
In order to identify the firms whose overall financial condition is poor, we use the super-efficiency negative DEA on the set of non-bankrupt firms in the set that is used to train the system. All the firms among these, which produce an efficiency score of more than 1, are therefore the worst performers among the non-bankrupt firms as negative DEA is used. When a significant number of non-bankrupt firms are taken into consideration, this identified population represents the group whose general financial condition is significantly poorer than the others. These non-bankrupt firms are then labeled as bankrupt and later used for training the multilayer perceptron. The trained perceptron is then used for prediction of bankruptcy.
4. Data specification and variables chosen
Our initial sample consisted of 1437 non-bankrupt and 175 bankrupt firms from The Centre for Monitoring Indian Economy (CMIE), which is an independent economic think-tank headquartered in Mumbai, India. The firms considered have filed for bankruptcy either in 1996 or in 1997. In real world, the ratio of healthy firms to bankrupt firms is very high, somewhat like 100 to 1 for public companies.Similarly, our sample does not contain matched pair of instances of bankrupt and non-bankrupt firms, necessarily. It is kind of a mixed sample to prevent loss of information as mentioned by [38]. In addition, we need to mention that our database contains a diverse range of industries. Our intention to use such a sample is to judge the robustness of other methods and the performance of the suggested method as a tool to assess and predict bankruptcy. As data pertaining to two years was taken into consideration, there are instances where data from the same non-bankrupt firm has been selected for two different years. These have been treated as two separate decision making units for the calculation.
Current
Ratio NWCTA
Total debt
ratio ROA
M/B
Value CATA CLTA EBIT/TA
Interest Cov. Rat.
Mean 2.2247 22.3667 1.6614 4.6313 1.2400 0.5997 0.3564 0.1023 5.4455
Standard
Error 0.0744 0.3576 0.0791 0.1998 0.0417 0.0046 0.0040 0.0021 1.3931
Median 1.6000 20.0800 1.2100 4.2900 0.7300 0.6060 0.3522 0.1040 1.9775
Standard
Deviation 2.9621 14.2364 3.1508 7.9547 1.6608 0.1817 0.1589 0.0843 55.4633
Sample
Variance 8.7743 202.6742 9.9278 63.2771 2.7584 0.0330 0.0253 0.0071
3076.17 24
Table 2 Descriptive Statistics of Bankrupt Firms
Current
Ratio NWCTA
Total debt
ratio ROA
M/B
Value CATA CLTA EBIT/TA
Interest Cov. Rat.
Mean 1.6230 16.6833 4.7797 1.7723 0.8480 0.5332 0.3567 0.0821 1.5330
Standard
Error 0.0431 0.7533 2.1703 0.5700 0.1545 0.0123 0.0105 0.0048 0.1129
Median 1.4400 14.9600 1.9300 1.8600 0.5100 0.5424 0.3343 0.0870 1.2689
Standard
Deviation 0.6173 10.7856 31.0740 8.1618 2.2117 0.1761 0.1496 0.0684 1.6170
Sample
Variance 0.3811 116.3289 965.5912 66.6156 4.8916 0.0310 0.0224 0.0047 2.6147
Table 3 Use of Variables in Literature
Altman (1993)
• Working Capital / Total Assets • Retained Earnings / Total Assets • Earnings Before Interest and Tax / Total Assets
• Market Value of Equity / Total Liabilities
• Sales / Total Assets
Altman (1993)
• Working Capital / Total Assets • Retained Earnings / Total Assets • Earnings Before Interest and Tax / Total Assets
• Market Value of Equity / Total Liabilities
• Sales / Total Assets • Stability of Earnings
• Earnings Before Interest and Tax /Interest Expense
• Current Ratio
• Common Equity / Total Capital
Ward (1995)
•Lower operating payment outflows •Long term investment inflows + Capital assets inflows
•Long-term financing inflows • Short-term financing inflows
The choice of variables is very crucial to every study made for the prediction of bankruptcy. Table 3 shows some of the studies made and their choice of variables. A set of variables was identified for this study based on the literature. Wilcoxon’s Rank-Sum test was then used to identify eight variables that were used for the analysis, the
results of which (up to 5 places of decimal) are given in Table 4. The variables that were considered are:
Current Ratio: A liquidity ratio that measures a company’s ability to pay short-term obligations. The ratio is given by,
Current Ratio =
!" # (3)
Net Working Capital to Total Assets (NWCTA): Net Working Capital to Total Assets ratio, is defined as the net current assets (net working capital) of a company expressed as a percentage of its total assets.
NWCTA = ( )* + , !- !#
.* !# (4)
Return on Assets: It is an indicator of how profitable a company is relative to its total assets. ROA gives an idea as to how efficient management is at using its assets to generate earnings. ROA is displayed as a percentage.
ROA = .* !# ( 0 *1 (5)
Total Debt Ratio = .* !# 5 "
.* !# (6)
Market Value to Book Value (M/B Value): Market value is determined in the stock market through its market capitalization. Book value is calculated by looking at the firm's historical cost, or accounting value.
M/B Value =:! + ;!# *1 <= >
?**+ ;!# *1 <= > (7)
Earnings before Interest and Tax (EBIT) to Total Assets (EBIT/TA): It is the ratio of the EBIT to the Total Assets of a firm. A higher value would indicate that the cash flowing to the security holders in a firm is higher.
EBIT/TA = .* !# <?B. (8) Interest Coverage ratio: It represents the ability of a firm to meet its creditors. Interest coverage ratio is indicative of how many times more does a firm earn as compared to its debt obligations.
Interest Cov. Ratio = B <?B. E! , (9)
Current Assets to Total Assets (CATA): A ratio that indicates the liquidity of the asset position of a firm. A higher value indicates that the assets of the firm are more liquid.
CATA = .* !# (10)
Current Liabilities to Total Assets (CLTA): A ratio of the current liabilities to the total assets of the firm.
CLTA = !" #
.* !# (11)
The Descriptive statistics of the variables, along with the results of the Wilcoxon’s rank-sum test are for both non-bankrupt and non-bankrupt firms are given in Table 1 and Table 2, respectively. The variable CL/TA was excluded from the analysis, as it did not have significant difference between the two groups. Now, to select the input and the output variable among the set of variables we followed the approach found in [38]. Current ratio, Working Capital to Total Assets, Return on Assets, Market to Book ratio, Earnings before Interests and Tax to Total Assets and Interest Coverage ratio are positive in nature and contribute to better financial health of a firm. On the other hand, the Total Debt ratio is opposite in nature. So while evaluating the super-efficiency negative DEA model for identifying the worst performers among the non-bankrupt firms, we took Total Debt ratio as output and the rest as inputs. We also mention that for MLP, no such distinction is needed among the variables. All the variables are considered of the same nature for predicting the financial health of a firm.
Table 4 Wilcoxon Rank Sum Test
Current Ratio
NWCT A
Total debt ratio
(Times) ROA
M/B
Value CATA CLTA
EBIT/T A
Interest Cov. Rat.
P(>|Z|) 0 0 0 0 0 0 0.76523 0.00038 0
|Z| 4.74085 5.42079 9.01156 5.40966 5.96044 4.75004 0.29861 3.55328 7.6315
5. Results and Discussion
The initial sample consisted of 1437 bankrupt firms and 175 non-bankrupt firms. Super-Efficiency negative DEA was first used to identify the worst performers among the non-bankrupt firms. The purpose is to identify the firms that were the most efficient at being bad. While doing this, the ratios that are positive to a firm (Current Ratio, Working Capital to Total Assets and Return on Assets, etc.) were considered as input and ratio that is negative to the overall performance of a firm (Total debt ratio) was taken
as output. The result identified 9 super-efficient firms. These firms and their corresponding efficiency scores are mentioned in Table 5. These firms were then labelled as bankrupt and were added to the list of 175 bankrupt firms that were chosen for the training sample. The entire set – 1428 non-bankrupt firms and 184 bankrupt firms – was used for training the multilayer perceptron.
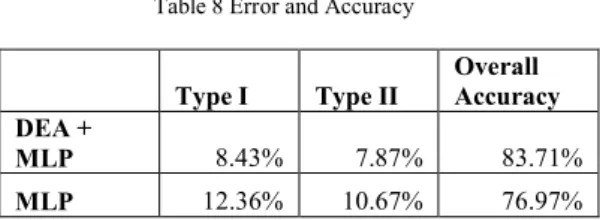
bankruptcy. The trained multilayer perceptron was then used for bankruptcy prediction of the firms in the test set. The result was compared with comparison made by a perceptron that doesn’t use DEA to identify the worst performing non-bankrupt firms. It was found that the suggested method outperformed MLP. There was a significant decrease in both Type I and Type II errors while predicting corporate bankruptcy of the firms using the suggested method. The predictions made by standard MLP show 12.36% Type I error and 10.67% Type II error while the suggested procedure records 8.43% Type I error and 7.87% Type II error, thereby validating the hypothesis of the suggested procedure. The confusion matrices of both the methods and their overall performance are summarized in Tables 6, 7 and 8.
Table 5 List of Super Efficient Worst Performing Non Bankrupt Firms
Sr.
No. Company
Efficiency Score
1 HERO HONDA MOTORS LTD. 3.1647
2 CHAMPAGNE INDAGE LTD. 2.2866
3 EVEREST ORGANICS LTD. 2.1460
4 HEMADRI CEMENTS LTD. 1.9116
5
KILBURN OFFICE
AUTOMATION LTD. 1.6451
6 BIRLA KENNAMETAL LTD. 1.5210
7 GWALIOR SUGAR CO. LTD. 1.3530
8 I T I LTD. 1.1763
9
GANDHIMATHI
APPLIANCES LTD. 1.0023
Table 6 Confusion Matrix of MLP
Non
Bankrupt Bankrupt
Non Bankrupt 129 19
Bankrupt 22 8
Table 7 Confusion Matrix of MLP post DEA
Non
Bankrupt Bankrupt
Non Bankrupt 134 14
Bankrupt 15 15
Table 8 Error and Accuracy
Type I Type II
Overall Accuracy DEA +
MLP 8.43% 7.87% 83.71%
MLP 12.36% 10.67% 76.97%
6. Conclusion and Future Scope
The suggested method identifies firms that have a high chance of facing corporate bankruptcy by considering the overall financial condition of firms as well as firms that actually faced bankruptcy. The method, as mentioned in Table 5, outperformed MLP and MDA. There was a significant reduction in the number of Type I errors. This also stresses on the fact that merely filing of bankruptcy is not the most suitable index for prediction of corporate bankruptcy. Due to several options that a company can chose from when it faces bankruptcy, the overall financial situation should also be taken into consideration. This will result in reduction in losses resulting from a company defaulting on a loan. Also, this method was successfully tested on a dataset prepared from a wide spectrum of industries which shows the robustness of the method while predicting bankruptcy.
The performance of this method can be compared with other existing methods that are used for bankruptcy prediction. The identification of worst performing non-bankrupt firms can be made using other methods too. This can also be done by using a layered DEA approach. The introduction of non-bankrupt firms, layer by layer into the bankrupt group can be a potential future research agenda.
References
[1]William H. Beaver, “Financial Ratios As Predictors of Failure”, Journal of Accounting Research, Vol. 4, Empirical Research in Accounting: Selected Studies 1966 (1966), pp. 71-111
[2]Edward I. Altman, “Financial Ratios, Discriminant Analysis and the Prediction of Corporate Bankruptcy” The Journal of Finance, Vol. 23, No. 4 (Sep., 1968), pp. 589-609
[3]Edward I. Altman, Robert G. Haldeman, P. Narayanan, “ZETATM analysis A new model to identify bankruptcy risk of corporations”, Journal of Banking & Finance, Volume 1, Issue 1, June 1977, pp. 29-54, ISSN 0378-4266, 10.1016/0378-4266(77)90017-6.
[5]Shi-Ming Huang, Chih-Fong Tsai, David C. Yen, Yin-Lin Cheng, “A hybrid financial analysis model for business failure prediction”, Expert Systems with Applications, Volume 35, Issue 3, October 2008, pp. 1034-1040, ISSN 0957-4174, 10.1016/j.eswa.2007.08.040.
[6]Esteban Alfaro, NoeliaGarcía, MatíasGámez, David Elizondo, Bankruptcy forecasting: An empirical comparison of AdaBoost and neural networks, Decision Support Systems, Volume 45, Issue 1, April 2008, pp. 110-122, ISSN 0167-9236, 10.1016/j.dss.2007.12.002.
[7]Scott, W. Richard, “Institutions and Organizations”, Thousand Oaks, CA: Sage, 1995.
[8]Seung-Hyun Lee, Mike W. Peng, Jay B. Barney, “Bankruptcy Law and Entrepreneurship Development: A Real Options Perspective”, The Academy of Management Review ARCHIVE, Volume 32, Number 1 / January 2007, pp. 257-272.
[9]Bob Jacobs, “Bankruptcy Law in India”, Ferriers Focus Asia, June 2009.
[10]L. A. Bebchuk “A New Approach to Corporate Reorganizations.” Harvard Law Review 101, 1988, pp. 775– 804.
[11]J. Bellovary, D. Giacomino and M. Akers, “A Review of Bankruptcy Prediction Studies: 1930 to Present”, Journal of Financial Education, Volume 33, Winter 2007.
[12]M. A. Aziz, H. A. Dar,“Predicting Corporate Bankruptcy: Whither do we stand?”,Corporate Governance, Vol. 6 Iss: 1, 2006, pp. 18-33.
[13]E. I. Altman,“Corporate Financial Distress and Bankruptcy: A Complete Guide to Predicting Avoiding Distress and Profiting from Bankruptcy”, Wiley Finance Edition, 1993. [14]R. Morris, “Early Warning Indicators of Corporate Failure:
A Critical Review of Previous Research and Further Empirical Evidence”, Ashgate Publishing Company, 1998. [15]W. R. Klecka,“Discriminant Analysis, London: Sage
Publications”, 1982.
[16]G. S.Maddala, “Limited Dependent and Qualitative Variables”, Econometrics Cambridge, Cambridge University Press, 1983.
[17]P. T.Theodossiou, “Alternative Models for Assessing the Financial Condition of Business in Greece”, Journal of Business Finance and Accounting, Vol. 18, No. 5, 1991, pp. 697-720.
[18]D. N. Gujarati, Basic Econometrics, Singapore: McGraw-Hill Inc., 1998.
[19]E. S. Page,“Continuous Inspection Schemes”, Biometrika, Vol. 41, 1954, pp. 100-114.
[20]J. D. Healy,“A Note on Multivariate CUSUM Procedures”, Technometrics, Vol. 29, 1987, pp. 409-412.
[21]E. K. Laitinen, T. Laitinen,“Cash Management Behaviour and Failure Prediction”, Journal of Business Finance and Accounting, Vol. 25 No. 7 & 8, 1998,pp. 893-919.
[22]J. Kolodner,“Case-Based Reasoning”, San Mateo, CA: Morgan Kaufmann Publishers Inc., 1993.
[23]L. M. Salchenberger, E. M. Cinar, and N. A. Lash, “Neural Networks: A New Tool for Predicting Thrift Failures”, Decision Sciences, Vol. 23, 1992,pp.899-916.
[24]P. K. Coats, L. F. Fant, “Recognizing Financial Distress Patterns using a Neural Network Tool”, Financial Management, Vol. 22, 1993, pp. 142-155.
[25]K. Shin, and Y. Lee, “A Genetic Algorithm Application in Bankruptcy Prediction Modelling”, Expert Systems with Applications, Vol. 23, No. 3, 2002pp. 321-328.
[26]F. Varetto, “Genetic Algorithms Applications in the Analysis of Inslovency Risk”, Journal of Banking and Finance, Vol. 22, 1998, pp. 1421-1439.
[27]Z. Pawlak,“Rough Sets”, International Journal of Information and Computer Sciences, Vol. 11, 1982,pp. 341-356.
[28]W. Ziarko,“Variable Precision Rough Set Model”, Journal of Computers and Systems Sciences, Vol .46, 1992, pp. 39-59. [29]H. Theil,“On the Use of Information Theory Concepts in the
Analysis of Financial Statements”, Management Science, Vol. 459-480, 1969.
[30]B. Lev, “Decomposition Measures for Financial Analysis”, Financial Management, 1973, pp. 56-63.
[31]J. Scott, “The Probability of Bankruptcy: A Comparison of Empirical Predictions and Theoretic Models”, Journal of Banking and Finance 5, 1981,pp. 317-344.
[32]S. Westgaard, N.Wijst, “Default Probabilities in a Corporate Bank Portfolio: A Logistic Model Approach”, European Journal of Operational Research, Vol. 135, 2001, pp. 338-349.
[33]M.D. Troutt, A. Rai, and A. Zhang, “The potential use of DEA for credit applicant acceptance systems”, Computers Operations Research, Vol. 23, No. 4, 1996, pp. 405-408. [34]D.Retzlaff-Roberts, and R. Puelz, “Classification in
automobile insurance using a DEA and discriminant hybrid”, Journal of Productivity Analysis, Vol. 17, 1996, pp. 417-427. [35]L.M. Seiford, J. Zhu, “An acceptance system decision rule
with data envelopment analysis”, Computers Operations Research, Vol. 25, No. 4, 1998, pp. 329-332.
[36]P.C. Pendharkar, “A potential use of data envelopment analysis for the inverse classification problem”, Omega, Vol. 30, 2002, pp. 243-248.
[37]A. Cielen, L. Peetersand K. Vanhoof, “Bankruptcy prediction using a data envelopment analysis”, European Journal of Operational Research, Vol. 154, 2004, pp. 526-532.
[38]J.C Paradi, M. Asmild, and P.C. Simak, “Using DEA and worst practice DEA in credit risk evaluation”, Journal of Productivity Analysis, Vol. 21, 2004, pp. 153-165.
[39]30. C. Kao, S.T. Liu, “Prediction bank performance with financial forecasts: A case of Taiwan commercial banks”, Journal of Banking and Finance, Vol. 28, 2004, pp. 2353-2368.
[40]I.M Premachandra, G.SBhabra, T.Sueyoshi, “DEA as a tool for bankruptcy assessment: A comparative study with logistic regression technique”, European Journal of Operational Research, 2009, pp. 412-424.
[41]J.C. Paradi, M. Asmild and P.C. Simak, “DEA based analysis of corporate failure”, Working Paper, CMTE, Department of Chemical Engineering, University of Toronto, (2001). [42]A. Charnes, W.W. Cooper and E.
AyanMukhopadhyay completed his Bachelors in Technology in Computer Science from RCC Institute of Technology, Kolkata in 2011 and is currently working for Cognizant Technology Solutions India Pvt. Ltd. His research interests are diverse. They primarily include Computational Aspect in Economics and Finance and Neural Networks,Risks and Returns in Finance. He has also worked on Visual Cryptography to design security systems.
Suman Tiwariis currently pursuing MBA (International Business) from The Indian Institute of Foreign Trade. He completed his Bachelors in Technology in Computer Science from RCC Institute of Technology, Kolkata in 2011. His research areas are varied and encompass Computational Aspect in Economics and Finance, Portfolio Theory, Efficient Market Hypothesis, Risks and Returns in Finance and Data Envelopment Analysis. His past work also includesVisual Cryptography based security systems.
AnkitNarsaria completed his Bachelors in Technology in Computer Science from RCC Institute of Technology, Kolkata in 2011 and is currently working for Cognizant Technology Solutions India Pvt. Ltd. His focus of research lies in Economics and Finance. He has worked with Biometric Security and identification systems as well.