ISSN 1549-3636
© 2009 Science Publications
Corresponding Author: M.S. Salam, Faculty of Computer Graphics and Multimedia, University Technology Malaysia, 81310 Johor Bahru, Malaysia Tel: (+60)-7-5531995
Improved Statistical Speech Segmentation Using Connectionist Approach
1
M.S. Salam,
1Dzulkifli Mohamad and
2S.H. Salleh
1Faculty of Computer Science and Information System,
2Faculty of Biomedical Engineering and Science,
University Technology Malaysia, 81310 UTM Skudai, Johor, Malaysia
Abstract: Problem statement: Speech segmentation is an important part for speech recognition, synthesizing and coding. Statistical based approach detects segmentation points via computing spectral distortion of the signal without prior knowledge of the acoustic information proved to be able to give good match, less omission but lot of insertion. These insertion points dropped segmentation accuracy. Approach: This study proposed a fusion method between statistical and connectionist approaches namely the divergence algorithm and Multi Layer Perceptron (MLP) with adaptive learning for segmentation of Malay connected digit with the aim to improve statistical approach via detection of insertion points. The neural network was optimized via trial and error in finding suitable parameters and speech time normalization methods. The best neural network classifier was then fusion with divergence algorithm to make segmentation. Results: The results of the experiments showed that the best neural network classifier used learning rate of value 1.0 and momentum rate of value 0.9 with data normalization based on zero-padded. The segmentation using fusion of statistical and connectionist was able to reduce insertion points up to 10.4% while maintaining match points above 99% and omission point below 0.7% within time tolerance of 0.09 second. Conclusion: The result of segmentation using the proposed fusion method indicated potential use of connectionist approach in improving continuous segmentation by statistical approach.
Key words: Speech segmentation, speech recognition, divergence algorithm, neural network
INTRODUCTION
Automatic speech segmentation has become a research study since more than 30 years ago. It is of much interest as an important pre-processing in most speech processing system that are intended to obtain some useful features carrying information in the auditory channel[1]. The study of automatic segmentation is necessary in works for phonetic analysis of speech[2], audio content classification[3] and many applications in the field of Automatic Speech Recognition (ASR), including word recognition[4]. Although human can easily classify perfectly connected and continuous speech; machine, on the other hand still struggling to do so. The task of automatic continuous speech segmentation is difficult due to the co-articulation effect where the adjacent signal influence each other and no specific cues as to shows the segmentation points.
In traditional widely used approach in speech processing, an overlap fix window of size between 10-50 ms is used for features extraction representing
since the approaches are linguistically unconstraint, they are expected to make a lot of insertions.
In general, segmentation of speech is done by identifying the changes of acoustic cues of each signal. The cue can be the signal’s energy, special features and properties of the analyzed signal. There are different approaches in segmentation of speech being done previously. In general, it can be either property based[8], statistical based[9,10], Hidden Markov based[11,12] or artificial intelligent[13,14] based approaches. These approaches applied either frame based or segment based.
Frame based analyzed portion of utterance data (frame) and determine the likelihood that a particular frame of utterance data is part of a particular linguistic unit such as phoneme. For example, a frame-based recognizer might analyzed a 20 ms frame utterance data and then determine the likelihood that the 20 ms frame is part of a word. Frames that are determined to be part of the same phoneme are then grouped together.
Segment-based, on the other hand analyzed frames of utterance data to find logical segment that define linguistic unit contained in the utterance data. Each segment is defined by two boundaries that define the start and end of a linguistic unit. Boundaries are typically characterizes by a sharp rise or fall in utterance data values. Segment-based analyzed frame data looking for segment boundaries. Once the boundaries have been identified, it determines the probability that each segment is a particular linguistic unit.
Segment-based are more accurate compare to frame based as it specifically determine the start and end of the linguistic unit. The widely use segment based approach is statistical based like divergence algorithm and Brandt’s BLR algorithm. However, the drawback for these approaches is insertion and omission depending on the parameters and threshold being set in the application. Present research with syllables shows that by having low threshold with moderate size of sliding processing window and auto regression order, gives above 95% detection match but a lot of insertions[15]. It is the aim of this study to detect insertion points by statistical approach namely divergence algorithm using neural network of type multi layer perceptron with adaptive learning.
Fusion statistical and connectionist: The fusion can be illustrated as in Fig. 1. The process starts by optimizing neural network classifier via experimenting the learning parameters and speech time normalization method.
Fig. 1: The fusion flow diagram
The optimizing of classifier uses training speech data with reference segmentation points. The process gives an optimized connection weight to be used in detection of insertion. The test data at another process are segmented using divergence algorithm by detecting any discontinuity in the speech signal that results segmented signal with a lot of insertion but high match to the reference points. The next step is to apply the optimized network classifier to detect insertion points and improved the segmented signal.
Divergence algorithm: Divergence Algorithm use statistical analysis in determining the segment points. The speech signal is assumed to be described by a string of homogeneous units, each of which is characterized by a statistical model of form:
p
n i n i n
i 1
y a y− e
=
=
∑
+ (1)where, en is the excitation of the acoustic channel and is an uncorrelated zero mean Gaussian sequence with:
2
n n
var(e )= σ
The model is parameterized by the vector
Θdefined by:
T T T
T
1 p
( , ) (a ,....,a )
Θ = θ φ
θ = (2)
where, φ is parameter vector which determines the sequence σn .
Divergence algorithm consists in performing on line a detection of changes in the parameter Θstarting from location of the previous detected. The algorithm is basically, (1) Detect when changes occurs. (2) Estimate the location of the changes.
Fig. 2: Location of the two models for the divergence algorithm
This distance is derived from the cross entropy between the conditional distribution of these two models. Consider:
T
1, m
m (y , y )
Y =
and denote by:
m m
0(y ||ym 1−) and 1(y ||ym 1−)
ϑ ϑ
The two conditional densities corresponding to the models of Fig. 1. Introduce the cross entropy between the two models, ϑ0 and ϑ1:
1 m 1 1 m 1
m 0 m 1
0 m 1 0 m 1
(y || ) (y || )
w (y || ) log dy log
(y || ) (y || )
y
y
y
y
y
− −
−
− −
ϑ ϑ
= ϑ −
ϑ ϑ
∫
which introduce the cumulative sum:
n
n m
m 1
W w
=
=
∑
It can be shown under hypothesis H0: Θ = Θ0, (Wn)n≥1 has a zero conditional drift while under hypothesis H1: Θ = Θ1 its conditional drift is negative.
In practical implementation, the long term model parameter Θ0 is identified using a sample-by-sample growing memory Burg algorithm; while the short term parameter Θ1 is identified using the autocorrelation method.
A change detection occur when the long term model disagree with the short term model in the sense of cumulative sum statistics. Detection is done by comparing the cumulative sum with threshold value as follow:
r r 1 r nmax W≤ ≤ −W > λ
and
n
n m
m 1
W w
=
=
∑
+ δwhere, δ is a bias value and λ is a threshold.
Neural network: The neural network applied in this experiment is a three layer MLP network with adaptive learning where there are constant multipliers for increment and decrement to dynamically change learning rate in the training process based on the learning performance. Basically it will enhance learning process. The learning scheme used to train the neural network is backpropagation with sigmoid as the activation function. The network basically works by minimizing the error through propagation of signal between layers or updating the connections weights. Eq. 3 shows summary of back propagation process,
∆wij(n + 1) = η(δpj - Opi) + α∆wij(n) (3)
Where:
η = Learning rate
α = The momentum constant and
δpj = Error signal at neuron j in layer L and Opi = Output of neuron i in layer L-1
Neural network performance depends on many factors. Some of them are the value of learning parameters like learning and momentum rate, the network topology like number of hidden nodes and number of layers and data preparation.
MATERIALS AND METHODS
Experimental data: The data use in this experiment is Malay connected digit. The language is called Bahasa Melayu where it is largely used in Malaysia, Brunei, most part of Indonesia, Singapore and southern part of Thailand and Philippine. Approximately there are 20-30 million people speak the language. Although, the language pronunciation and usage may slightly different between the mentioned countries most Bahasa Melayu speakers can understand each other.
Thailand and one from Pahang and Kedah. Based on their background, most of them have their slang in the use of Bahasa Melayu. Nevertheless, they were told to speak the standard Bahasa Melayu utterance. The data collected in lab environment. The speakers were asked to pronounce four connected digits in clear read mode without specifically give direction as how to pronounced each digit. Being novice speakers, they do not speak the words in standard read mode which require emphasis of each syllables of the words and avoiding slang. Nevertheless, the data collected become semi-spontaneous mode.
There are 1400 connected digit strings uttered which consists of 5600 words where each speaker has 100 strings utterances. The patterns are divided for Neural Network training and testing. Each of the patterns is then manually segmented into words. The manual segmentation is done through visually see the pattern abrupt changes and listen to the sound for verification. The manual segmentation throughout this study will be known as reference points. The reference points are used to extract words in the connected strings for Neural Network training purpose and measurement of accuracy in comparison with the automatic segmentation.
Optimization of neural network classifier: It is crucially important to find neural network suitable learning parameters, topology and data representation in order to get a good classifier. For that purpose this experiment chooses a set of learning parameters to find the best one. Table 1 shows the experimental parameters. Two methods of speech normalization are compared for better classifier. The topology used in this experiment is 820:100:10 where there are 3 layers with 820 nodes at the input, 100 nodes at the hidden layer and 10 nodes at the output layer. The 820 nodes represent the number of speech pattern’s features which is based on the average length of the digits utterances. The number of nodes at the hidden layer is a round up value to 100 based on geometric rule formula suggested by Master where ~h = m * n , m is the number of input
nodes and n is the number of output node[17]. Output nodes is equal 10 to represents the 10 digit class.
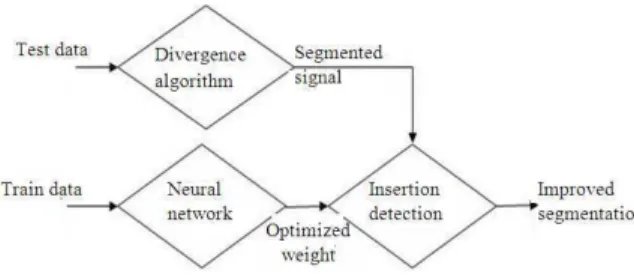
The pairs of learning and momentum rate used in this experiment are based on previous works on similar problems. The pair {0.25,0.5} is the pair suggested by Peeling and Moore[18], the pair {0.5,0.75} is the best pair gotten from experiment conducted by Salam[16], the pair {1.0,0.9} is suggested by Burr[19] and the pair {0.1,0.9} is consider standard for MLP by Rumelhart[20]. The values for the constant multipliers are the values used by Negnevitsky[21].
Table 1: Experimental parameters
Learning Momentum Increment Decrement
rate, η rate, α multiplier, η+ multiplier, η-
0.25 0.50 1.05 0.7
0.50 0.75 1.05 0.7
1.00 0.90 1.05 0.7
0.10 0.90 1.05 0.7
Fig. 3: Pseudo code for zero-padded
The two methods of normalization tested in this experiment are the zero-padded method and linear normalization. Basically the method of zero-padded operates by inserting zeros to fill empty frame for patterns that has less than the number of input nodes in neural network. If the pattern features exceeds the fixed size input nodes of neural network, it will feed in only up to the length of the fixed size nodes. The algorithm can be described as the psudo code at Fig. 3.
The linear normalization algorithm was based on extending and compressing features pattern to fit in the number of fixed size of the neural network input nodes. Basically, the pattern with number of features similar to fixed size will be copied back. While the pattern with number of features greater than fixed size, it will be linearly compressed to the fixed size based on the ration between the original size and fixed size. Similarly, if the number of features less than fixed size, it will be extended to the same length as fixed size linearly based on the ration of the original size and fixed size. The Pseudo Code at Fig. 4 shows the process
The speech features will also be amplitude normalized between value 0 and 1 before feed in the neural network for better neural network training.
Fig. 4: Pseudo code for linear normalization
Let U = {U1, U2, …., Un} and V = {V1, V2, …., Vp} be the points in second of the segmentation marks obtained respectively by an automatic algorithm and by manual procedure which acts as the reference segmentation points. For each Uj, a correspondence is done with the reference segmentation by determining the time instant Vkj which is closest to Uj. A sequence Vu = {Vk1, Vk2, …., Vkn} is built in order to compare both segmentations. Thus, omission is evaluated as points in Vu that is not in Uj and insertion is defined as extra points in Uj that is not in Vu. Match is calculated as number of similar points in Uj and Vu say, m divide by number of points in V, p. Thus, it can be defined as:
match = (m/p * 100)
and
accuracy = ((m/p+i) * 100)
where, accuracy will be influenced or degraded by number of insertion occurrences, i.
RESULTS
There are two general experiments done in this study which are to find neural network classifier based on isolated words training and testing and then use the classifier with divergence algorithm to segment the connected words.
Result on neural network: The results of the comparison between learning parameters and normalization methods can be summarized as in Table 2 and 3. The Ε sign indicates value error at the 10,000th epoch, Regis the regression value and Recoq is the recognition rate.
Fig. 5: Comparison of recognition rate between zero padded and linear normalization using different network parameter set
Table 2: Experimentation using zero-padded normalization data on different learning parameters
Data set 1 η α η+ η- Ε Reg. Recognition
Para set 1 0.25 0.50 1.05 0.7 0.016 0.9066 98.70 Para set 2 0.50 0.75 1.05 0.7 0.014 0.9191 98.90 Para set 3 1.00 0.90 1.05 0.7 0.012 0.9272 99.05 Para set 4 0.10 0.90 1.05 0.7 0.012 0.9277 99.00
Table 3: Experimentation using linear normalization data on different learning parameters
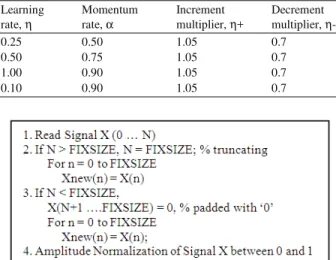
Data set 2 η α η+ η- Ε Reg. Recognition
Para set 1 0.25 0.50 1.05 0.7 0.033 0.7902 68.2 Para set 2 0.50 0.75 1.05 0.7 0.027 0.8349 71.7 Para set 3 1.00 0.90 1.05 0.7 0.024 0.8610 74.3 Para set 4 0.10 0.90 1.05 0.7 0.022 0.8650 74.9
The result shows a significantly different performance between the normalization methods. The zero-padded normalization seems able to enhance neural network classification ability for nearly all set of experimental learning parameters. Fig. 5 shows the comparison between zero-padded normalization and linear normalization using different parameter sets on recognition rate. The recognition rate for every parameter set is above 98% with good error convergence rate and regression value. On the other hand, linear normalization method which successfully applied previously[16] achieved recognition rate of no more than 75%. The best parameters pair of learning and momentum rate is 1.0 and 0.9 respectively
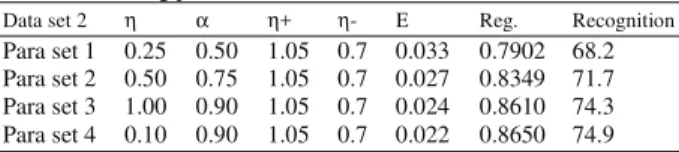
observed from the sample that some insertion points are detected and omitted by the fusion method. The result reported for fusion segmentation is based on the best classifier in previous experiment of neural network.
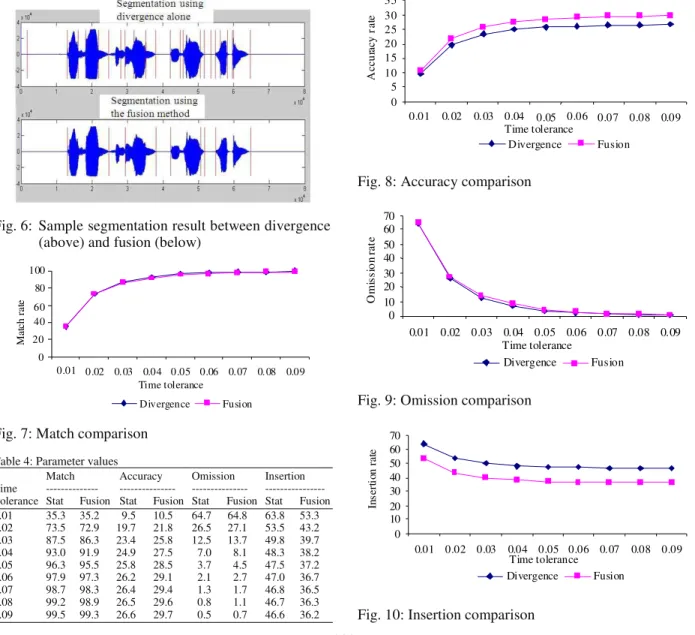
The result of match, accuracy, omission and insertion segmentation rate comparison versus time tolerance in second for all 472 test pattern strings between the divergence algorithm and the fusion approach are shown at Fig. 7-10 respectively.
Figure 7 shows that the fusion method is able to maintain high match and nearly similar value to the divergence algorithm. Table 4 shows the detail values for all the parameters. The different are only slightly between 0.1-1.2% reductions. The match is calculated based on number of similar points between reference segmentation with automatic segmentation.
Fig. 6: Sample segmentation result between divergence (above) and fusion (below)
0 20 40 60 80 100
0.01 0.02 0.03 0.04 0.05 0.06 0.07 0. 08 0.09 Time tolerance
M
at
c
h
r
a
te
Divergence Fusion
Fig. 7: Match comparison
Table 4: Parameter values
Match Accuracy Omission Insertion
Time --- --- --- --- Tolerance Stat Fusion Stat Fusion Stat Fusion Stat Fusion
0.01 35.3 35.2 9.5 10.5 64.7 64.8 63.8 53.3
0.02 73.5 72.9 19.7 21.8 26.5 27.1 53.5 43.2
0.03 87.5 86.3 23.4 25.8 12.5 13.7 49.8 39.7
0.04 93.0 91.9 24.9 27.5 7.0 8.1 48.3 38.2
0.05 96.3 95.5 25.8 28.5 3.7 4.5 47.5 37.2
0.06 97.9 97.3 26.2 29.1 2.1 2.7 47.0 36.7
0.07 98.7 98.3 26.4 29.4 1.3 1.7 46.8 36.5
0.08 99.2 98.9 26.5 29.6 0.8 1.1 46.7 36.3
0.09 99.5 99.3 26.6 29.7 0.5 0.7 46.6 36.2
On the other hand, accuracy takes into consideration number of insertion. Although, the percentage is still low, Fig. 8 shows that the fusion method improved divergence segmentation accuracy between 1-3.1% which indicates that the number of insertion is reduced. Figure 10 shows the comparison between the methods for insertion rate. The average reduction of insertion rate is 10.31%. As for omission rate, fusion method is able to maintain low omission with small different between 0.1-1.2% of omission increment. The omission performance comparison is illustrated at Fig. 9. In general, the fusion method is able improved statistical approach by maintaining the match and omission while reducing insertion.
0 5 10 15 20 25 30 35
0.01 0. 02 0. 03 0.04 0.05 0.06 0.07 0.08 0.09 Time tolerance
A
cc
u
ra
cy
r
a
te
Divergence Fusion
Fig. 8: Accuracy comparison
0 10 20 30 40 50 60 70
0.01 0.02 0.03 0.04 0.05 0.06 0.07 0.08 0.09 Time tolerance
O
m
is
si
o
n
ra
te
Divergence Fusion
Fig. 9: Omission comparison
0 10 20 30 40 50 60 70
0.01 0.02 0.03 0.04 0.05 0.06 0.07 0.08 0.09 Time tolerance
In
se
rt
io
n
r
at
e
Divergence Fusion
Fig. 11: Example of divergence segmentation for string “0938”
DISCUSSION
It is observed that the fusion method still give large insertion rate is due to the nature of divergence algorithm segmentation detection which detects any discontinuity in the signal and neural network mapped any pattern feed into it to the nearest class trained upon it which leads to detection of false pattern as true pattern. For example, Fig. 11 shows the segmentation points for string “0938”. The true points are {s2, s6} represent utterance 0, {s6, s11} for utterance 9, {s12, s16} for utterance 3 and {s18,s22} for utterance 8. However, the method will try out every possible pairs for example {s3, s6}, {s5, s8}, {s6, s10} which is false but neural network will mapped the pattern to some familiar classes. Based on a selected threshold value from the output node, some of these patterns will be recognized as true pattern and the points will not be rejected.
For future improvement, a better pre selection method in getting pattern from divergence segmentation points is to be introduced. The use of silence detection based on zero crossing rates as pre-determine possible patterns before feed into neural network can be used to reduce obvious false pattern. Another possible future enhancement can be made by introducing false patterns in the training of neural network.
CONCLUSION
In this study, a new method to improved statistical segmentation via fusion of divergence algorithm and multi layer perceptron neural network with adaptive learning is introduced. The neural network basically works as insertion point detection by classify true pattern based on the segmented points. The method is able to reduced insertion points, maintain match and omission rate and increased accuracy rate. Although, the insertion point still exists, the result indicates potential use of the fusion method for statistical speech segmentation improvement.
REFERENCES
1. Rasaen, O., 2007. Segmentation and clustering methods for a new speech recognition architecture. Master Thesis, Helsinki University of Technology. http://www.acoustics.hut.fi/publications/files/these s/rasanen_mst.pdf
2. Mermelstein, P., 1975. Automatic segmentation of speech into syllabic units. J. Acoust. Soc. Am., 58: 880-883.
http://www.ncbi.nlm.nih.gov/pubmed/1194547 3. Zhang, T. and C. Kuo, 1999. Hierarchical
classification of audio data for archiving and retrieving. Proceeding of Acoustics, Speech and Signal Processing on 1999 IEEE International Conference, Mar. 15-19, IEEE Xplore Press, USA.,
pp: 3001-3004. DOI:
10.1109/ICASSP.1999.757472
4. Antal, M., 2004. Speaker independent phoneme classification in continuous speech. Studia Univ. Babes-Bolyal, Informatica, pp: 55-64. http://www.cs.ubbcluj.ro/~studia-i/2004-2/6-Antal.pdf 5. Young, S., 1996. A review of large vocabulary
continuous speech. IEEE Signal Process. Mag., 13: 45-57. DOI: 10.1109/79.536824
6. Jarifi, S., D. Pastor and O. Rosec, 2005. Brandt’s GLR method and refined HMM segmentation for TTS synthesis application. Proceedings of the European Signal Processing Conference, Sept. 4-8, Antalya, Turkey, pp: 1-4. http://www.ee.bilkent.edu.tr/~signal/defevent/pape rs/cr1491.pdf
7. Michele, B. and V.N. Igor, 1993. Detection of Abrupt Changes: Theory and Application. 1st Edn., Prentice Hall, Englewood Cliffs, New Jersey, ISBN: 10: 0131267809, pp: 528.
8. Rabiner, L.R. and M.R. Sambur, 1976. Some preliminary experiments in the recognition of connected digits. IEEE Trans. Acoust., Speech Signal Process., 24: 170-182. http://ieeexplore.ieee.org/xpl/freeabs_all.jsp?arnum ber=1162794
9. Obrecht, R.A., 1988. Automatic segmentation of continuous speech signal. IEEE Trans. Acoust., Speech Signal Process., 36: 29-40. DOI: 10.1109/29.1486
11. Runqiang, Y., Z. Yiqing and Z. Yisheng, 2006. Automatic speech segmentation combining HMM-based approach and recurrence trend analysis. Proceeding of the International Conference on Acoustic, Speech and Signal Processing, May 14-19, IEEE Xplore Press, USA., pp: 797-800. DOI: 10.1109/ICASSP.2006.1660141
12. Farncisco, D., R. Manual, G. Pedro, N. Victor and R. Victorria, 2002. Using hidden markov models in segmentation of speaker-independent connected digits corpus.
http://labaudio.datsi.fi.upm.es/PUBLICACIONES/ ICOSSIP-02_Grecia.pdf
13. David, L., 1998. Learning spectral-temporal dependencies using connectionist networks. Proceeding of the International Conference on Acoustic, Speech and Signal Processing, Apr. 11-14, IEEE Xplore Press, USA., pp: 418-421. DOI: 10.1109/ICASSP.1988.196607
14. Abdulla, W.H., V. Kecmanand and N. Kasabov, 2003. Speech-background classification by using SVM technique.
http://www.aut.ac.nz/resources/research/research_i nstitutes/kedri/downloads/pdf/abdkeckasiconip2003.pdf 15. Salam, M.S., D. Mohamaed and S.H. Salleh, 2008.
Segmentation of malay syllables in connected digit speech using statistical approach. Int. J. Comput.
Sci. Sec., 2: 23-33.
http://www.cscjournals.org/Journals/IJCSS/Volum e2/Issue1/IJCSS-26.pdf
16. Salam, M.S., D. Mohamad and S. Hussain, 2001. Neural network speaker dependent isolated Malay speech recognition system: Handcrafted Vs genetic algorithm. Proceeding of the 6th International Symposium on Signal Processing and its Applications, Aug. 13-16, IEEE Xplore Press,
USA., pp: 731-734. DOI:
10.1109/ISSPA.2001.950252
17. Master, T., 1993. Practical Neural Network Recipes in C++. 1st Edn., Academic Press, New York,ISBN: 10: 0124790402, pp: 493.
18. Peeling, S.M. and R.K. Moore, 1988. Isolated digit recognition experiments using multi-layer. Speech Commun., 7: 403-409. DOI: 10.1016/0167-6393(88)90057-X
19. Burr, D., 1988. Experiments on Neural Net recognition of spoken and written text. IEEE Trans. Acoust. Speech Signal Process., 36: 1162-1168. DOI: 10.1109/29.1643
20. Rumelhart. D.E., G.E. Hinton and R.J. William, 1986. Learning representation by back-propagation errors. Nature, 323: 533-536. http://www.cs.missouri.edu/~chengji/mlbioinfo/rumelhar t_nn.pdf