RESEARCH ARTICLE
Left Atrial Appendage Closure Guided by
Integrated Echocardiography and
Fluoroscopy Imaging Reduces Radiation
Exposure
Christiane Jungen1,2☯, Tobias Zeus2☯, Jan Balzer2, Christian Eickholt1,2,
Margot Petersen2, Eva Kehmeier2, Verena Veulemans2, Malte Kelm2, Stephan Willems1, Christian Meyer1,2*
1Department of Cardiology—Electrophysiology, cNEP, cardiac Neuro- and Electrophysiology research group, University Heart Center, University Hospital Hamburg-Eppendorf, Hamburg, Germany, DZHK (German Center for Cardiovascular Research), partner site Hamburg/Kiel/Luebeck, Hamburg, Germany, 2Department of Cardiology, Pulmonology and Vascular Medicine, Medical Faculty, University Hospital Duesseldorf, Duesseldorf, Germany
☯These authors contributed equally to this work. *[email protected]
Abstract
Aims
To investigate whether percutaneous left atrial appendage (LAA) closure guided by auto-mated real-time integration of 2D-/3D-transesophageal echocardiography (TEE) and fluo-roscopy imaging results in decreased radiation exposure.
Methods and Results
In this open-label single-center study LAA closure (AmplatzerTMCardiac Plug) was per-formed in 34 consecutive patients (8 women; 73.1±8.5 years) with (n = 17, EN+) or without (n = 17, EN-) integrated echocardiography/fluoroscopy imaging guidance (EchoNavigator1
[EN]; Philips Healthcare). There were no significant differences in baseline characteristics between both groups. Successful LAA closure was documented in all patients. Radiation dose was reduced in the EN+ group about 52% (EN+: 48.5±30.7 vs. EN-: 93.9±64.4 Gy/ cm2; p = 0.01). Corresponding to the radiation dose fluoroscopy time was reduced (EN+: 16.7±7 vs. EN-: 24.0±11.4 min; p = 0.035). These advantages were not at the cost of increased procedure time (89.6±28.8 vs. 90.1±30.2 min; p = 0.96) or periprocedural compli-cations. Contrast media amount was comparable between both groups (172.3±92.7 vs. 197.5±127.8 ml; p = 0.53). During short-term follow-up of at least 3 months (mean: 8.1±5.9
months) no device-related events occurred. OPEN ACCESS
Citation:Jungen C, Zeus T, Balzer J, Eickholt C, Petersen M, Kehmeier E, et al. (2015) Left Atrial Appendage Closure Guided by Integrated Echocardiography and Fluoroscopy Imaging Reduces Radiation Exposure. PLoS ONE 10(10): e0140386. doi:10.1371/journal.pone.0140386
Editor:Giuseppe Andò, University of Messina, ITALY
Received:June 10, 2015
Accepted:September 22, 2015
Published:October 14, 2015
Copyright:© 2015 Jungen et al. This is an open access article distributed under the terms of the
Creative Commons Attribution License, which permits unrestricted use, distribution, and reproduction in any medium, provided the original author and source are credited.
Data Availability Statement:All relevant data are within the paper and its Supporting Information files.
Funding:CM and CE are funded by the Research Committee of the medical faculty of the University of Duesseldorf. CM also holds a research grant from Biotronik and the Hans-und-Gertie-Fischer Stiftung. The study was supported with a restricted grant from the federal state government of North-Rhine-Westphalia and the European Union (EFRE-Program
Conclusions
Automated real-time integration of echocardiography and fluoroscopy can be incorporated into procedural work-flow of percutaneous left atrial appendage closure without prolonging procedure time. This approach results in a relevant reduction of radiation exposure.
Trial Registration
ClinicalTrials.govNCT01262508
Introduction
Percutaneous left atrial appendage (LAA) closure is currently under investigation as a promis-ing catheter-based approach for stroke prevention in patients with atrial fibrillation (AF) [1,2,3]. This is important since the LAA is the source of thrombi in>90% of affected patients
with nonvalvular AF [4] while oral anticoagulation still bears several limitations including bleeding risk [2]. Importantly, LAA closure still remains technically challenging [5]. Recently, a novel system enabling integrated echocardiography and fluoroscopy imaging (EchoNaviga-tor1[EN]), Philips Healthcare), which might at least partly overcome these limitations includ-ing radiation exposure, has been introduced [6,7]. The EN integrates in real-time information from 2D-/3D-transesophageal echocardiography (TEE) and fluoroscopy in the same anatomi-cal alignment enabling improved visualization of catheters, guidewires and devices in relation to relevant anatomical structures [6]. The usefulness of this novel imaging approach during LAA closure procedures has not been systematically investigated so far. Herein, we investigated the utility of LAA closure guided by integrated echocardiography and fluoroscopy imaging. We hypothesized that this approach decreases radiation exposure.
Methods
The protocol for this trial and supporting CONSORT checklist are available as supporting information (S1 CONSORT ChecklistandS1 Protocol).
Study design
In this open-label single-center study patients with nonvalvular AF, a CHA2DS2-VASc score of
1, a relative contraindication to oral anticoagulation, and a life expectancy of at least 2 years [5] were assigned by a computer software to LAA closure with (EN+) or without (EN-) the guidance of automated real-time integration of 2D-/3D- TEE and fluoroscopy imaging (Fig 1).
Theprimary endpointof this study was the change of total radiation dose. Thesecondary endpointswere changes of fluoroscopy time, procedure time and contrast media amount. Suc-cessful LAA closure (residual flow<5mm) and acute (7-day) occurrence of death, ischemic
stroke, systemic embolism and procedure or device related complications requiring major car-diovascular or endovascular intervention were determined [8,9].
The ethics review committee of the Heinrich-Heine-University Duesseldorf (Ethics review committee of the medical faculty, building 13.41, Moorenstrasse 5, 40225 Duesseldorf, Ger-many) approved this study and written informed consent was given by each patient. Patients undergoing LAA closure between February 2012 and March 2014 were included. Philips did not influence study design, data analysis, or manuscript preparation.
Competing Interests:This study was funded in part by Biotronik. JB receives honoraria for lectures from Philips Healthcare. TZ receives honoraria for lectures from St. Jude Medical. There are no patents, products in development or marketed products to declare. This does not alter the authors' adherence to all the PLOS ONE policies on sharing data and materials.
Abbreviations:ACP, AmplatzerTMCardiac Plug; AF,
LAA closure
Percutaneous catheter-based LAA closure in all patients was performed with the AmplatzerTM Cardiac Plug (ACP) (AGA-St-Jude, Minneapolis, MN, USA) under conscious sedation by using boluses of midazolam and a continuous infusion of propofol (2%). A TEE probe was introduced to rule out intracardiac/LAA thrombus. An initial bolus of unfractionated heparin (80–100 IU/kg of body weight) was administered prior to a single transseptal puncture by using the modified Brockenbrough technique (LAMPTM, 45°, SWARTZTM, St. Jude Medical1, St. Paul, USA; BRKTM, SJM) under TEE control. The heparin dose was adjusted during the pro-cedure in all patients to achieve an activated clotting time>300 seconds. LAA orifice diameter
and landing zone were measured by using 2D-TEE (mid-esophageal view at 0°, 45°, 90°, 135°) and angiography (right anterior oblique 30/25 caudal and right anterior oblique 30/15 cranial). A 13 French delivery sheath (45°x45° Amplatzer TorqVue1, SJM) was used for LAA angiogra-phy and ACP positioning. The device was chosen to be 10–20% larger than the maximum diameter of the LAA [2]. The ACP lobe was placed 1mm from the LAA orifice with the device’s long axis being positioned parallel to the LAA wall with the disc of the ACP aligned with the plane of the LAA orifice. After performing a tug test to ensure a secure fit, the device was
Fig 1. CONSORT flow chart.
doi:10.1371/journal.pone.0140386.g001
released. A waiting period of at least 10 minutes was used to confirm a stable position of the LAA occluder. Clopidogrel and acetylsalicylic acid were prescribed for 3 months, followed by acetylsalicylic acid intake alone.
Integrated echocardiography and fluoroscopy imaging: The
EchoNavigator
For automated real-time integration of echocardiography and fluoroscopy imaging a novel image integration system, the EN (Philips Healthcare, Best, The Netherlands), has been intro-duced. The system enables presentation of echocardiographic images in the same anatomical alignment as the C-arm of the fluoroscopy unit (“C-arm”view) so that both images of 2D-/ 3D-TEE and fluoroscopy (“X-Ray”view) are concordant in size and orientation in 3D space [6]. Changes in angulation, rotation, or position of the TEE probe are immediately registered and updated on fluoroscopy images [6]. Movement of the C-arm induces updates of the echo-cardiography images with the same angulation. In a third window, the interventional cardiolo-gist can simultaneously rotate and zoom an echocardiography image (“Free”view)
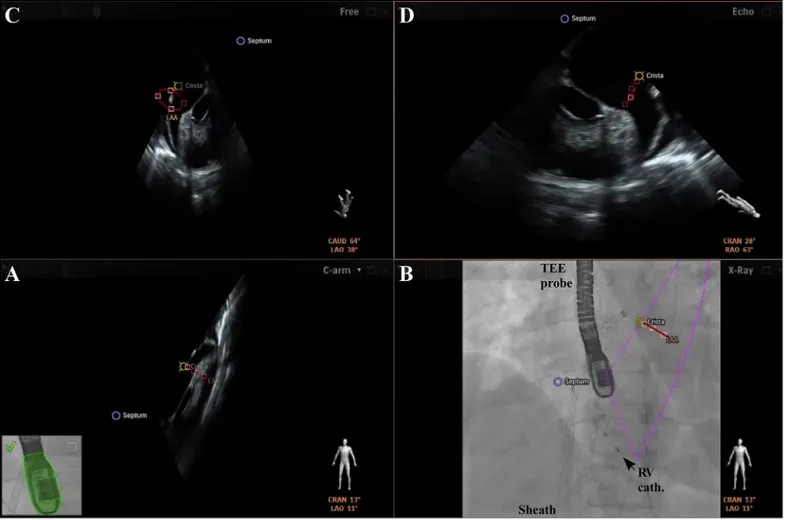
independently from the echocardiographer by using a tableside control. In a fourth window, conventional echocardiographic views (“Echo”view) are available. Each separate image display can further be modified by using features like contrast, panning or cropping. Depending on operator’s preferences two, three, or four windows are presented (Fig 2). Additionally, a
“marker feature”(Fig 3) allows setting markers on typical anatomical regions in the echocardi-ography image. These markers are simultaneously displayed in real-time on the fluoroscopy image. This feature is helpful to recognize anatomical landmarks including the interatrial sep-tum, the LAA orifice, the so called ridge (crista) between LAA and left pulmonary veins, and/ or the left circumflex artery (LCX). These markers have been introduced to support orientation in general and to facilitate catheter and device guidance during live fluoroscopy. Usually, label-ling of soft tissue targets takes place in the echocardiographic image, which is then displayed on the other image modality, e.g. in fluoroscopy. When the gantry is moved all markers are automatically updated on the fluoroscopy image without obvious lag time or need for re-regis-tration. During LAA closure procedures this approach might support (1.) transseptal puncture, (2.) anatomical orientation and device positioning, and (3.) verification of adequate sealing and device stability. Therefore, depending on the interventionalist’s choice, the transseptal punc-ture was facilitated after setting a marker at the optimal puncpunc-ture site by using the x-plane fea-ture allowing simultaneous demonstration of two orthogonally orientated echocardiographic image planes (Fig 2). Afterwards, the EN was used for anatomical orientation in the left atrium and for positioning of the occluder within the LAA (Fig 3) following LAA measurements. The LAA orifice and additional anatomical landmarks were marked and optimal device positioning was evaluated in different angles simultaneously by using the C-Arm-, X-Ray-, Free-, and/or Echo view. After device release correct positioning was verified in 2D-/3D-TEE combined with color doppler and fluoroscopy/angiography (Fig 4) [10].
Echocardiographic analysis
biplane method [17,18]. We also compared several LAA measurements in different imaging methods (S1 TableandS1 Fig). In 2D-TEE the maximum and minimum diameter of the LAA orifice were obtained in orthogonal planes and measured as previously recommended [14]. The LAA orifice area was then calculated by using the equation [19]: LAA orifice area =πx
(Dmax/2) x (Dmin/2). For comparison with 3D-TEE derived data, the larger of the two
calcu-lated orifice areas was used [13].
Statistical analyses
Continuous variables are presented as mean values with standard deviation (SD) and categori-cal variables as numbers. For comparisons between groups with continuous variables an unpaired t-test was used. To compare differences across subgroups with not normally uted data we used the Mann-Whitney test. To compare multiple subgroups of normally distrib-uted data a one-way ANOVA was used. All analyses were performed using Prism 5 (GraphPad Prism 5.0, GraphPad Software Inc., San Diego, USA). As reported by prior studies showing a significant reduction of fluoroscopy exposure, we assumed a reduction by 10% compared with conventional procedures. The prospectively calculated sample size using 2-sidedt-test analysis aiming for a power of 95% and an alpha of 0.05 was 14 patients per group. With a drop-out rate of 15% we assumed a group size of 17 patients.
Fig 2. Overview of integrated echocardiography and fluoroscopy imaging.The image acquisition angles during transseptal puncture are depicted in the lower right corner of each image. A+B) Concordant views of TEE and fluoroscopy images. C) In the“Free view”echocardiographic images can be rotated and zoomed independently from the echocardiographer by using a tableside control. D) Conventional echocardiographic view using the x-plane mode for identification of the preferred transseptal puncture site (Septum, blue). Sheath with transseptal needle; Pigtail cath. = pigtail catheter; RV cath. = catheter in the right ventricle.
doi:10.1371/journal.pone.0140386.g002
Results
Baseline characteristics
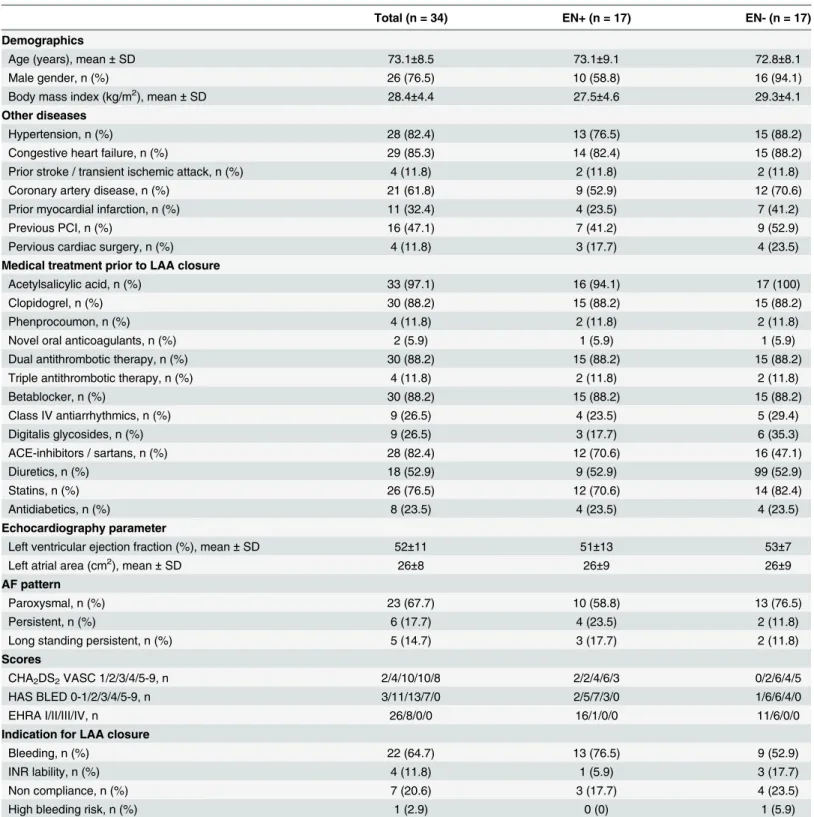
Patients’baseline characteristics are depicted inTable 1. Thirty-four patients (8 women; mean age: 73.1±8.5 years; body mass index 28.4±4.4) were included. For all patients, a CHA2DS2
-VASC score between 1 and 6 (mean 3.6±1.2) and a HAS-BLED score between 1 and 4 (mean 2.7±0.9) were calculated. Calculated stroke and bleeding risks did not differ between the EN+ (n = 17) and EN- (n = 17) group.
LAA closure
All patients underwent successful LAA closure. LAA access by transseptal puncture (n = 34) was guided by TEE in 32 patients (EN+: n = 16 vs. EN-: n = 16; p = 1.0000). The“marker fea-ture”was used in all patients in the EN+ group (for a representative image integration demon-strating the EN seeS1andS2Moving Images). Covering of the LAA orifice by the disk of the ACP was documented by TEE and angiography in all patients in the EN+ and the EN- group after device release.
Fig 3. Visualization of the LAA and surrounding structures preceding occluder positioning.The LAA orifice (red), the crista (yellow), and the septum (blue) are marked by landmark setting. A) 2D-TEE image in the same anatomical alignment as the C-arm. B) Outlines of 2D-TEE (pink lines) are fused with the fluoroscopy image. C+D) 2D-TEE with anatomical landmarks depicted in different angles. Note the sheath in close proximity to the left superior pulmonary vein as supported by the matching landmarks in different views. RV cath. = catheter in the right ventricle.
LAA measurements varied relative to the used imaging modality. The maximum LAA ori-fice diameter (ANOVA; F = 1.589, p = 0.2110) and length (ANOVA; F = 0.6821, p = 0.5087) did not differ between 2D-, 3D-TEE and angiography. LAA orifice area was smaller in 2D-TEE measurements (2.4±4 cm2) compared to 3D-TEE (2.9±1.1 cm2; p = 0.01) (S1 Table). The mean device size did not differ between the EN+ and the EN- group. In 5 of 34 patients (15%) devices needed to be changed during the procedure due to initial mis-sizing (2 times in the EN+ and 3 times in the EN- group).
Primary and secondary endpoints
Total radiation dose was reduced about 52% in the EN+ group (EN+: 48.5±30.7 Gy/cm2vs. EN-: 93.9±64.4 Gy/cm2; p = 0.01) compared to the EN- group (Table 2). Corresponding to the radiation dose fluoroscopy time was reduced (EN+: 16.7±7 minutes vs. EN-: 24.0±11.4 min-utes; p = 0.035). Procedure time (EN+: 89.6±28.8 minutes vs. EN-: 90.1±30.2 minmin-utes; p = 0.96) and contrast media amount (EN+: 172.3±92.7 ml vs. EN-: 197.5±127.8 ml; p = 0.53) did not differ between both groups (Table 2).
Follow-Up
No periprocedural cardiovascular events and procedure or device related complications requir-ing major cardiovascular or endovascular intervention occurred (Table 2). During short-term follow-up of at least 3 months (mean: 8.1±5.9 months) no cerebrovascular complications occurred. Unfortunately, one multimorbid patient (female, 61 years, EN+ group) with a porce-lain aorta and previous transapical aortic valve implantation died following paravalvular leak closure (Amplatzer Vascular Plug III 10 x 5 mm; AGA Medical Corporation, Plymouth,
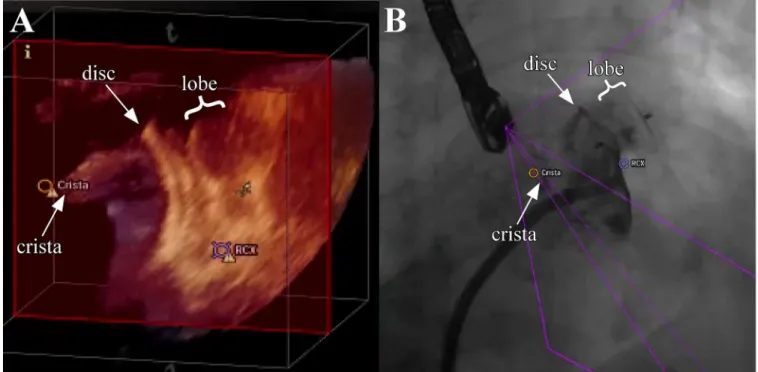
Fig 4. Evaluation of adequate device position and stability by using 3D-TEE and fluoroscopy.After LAA occluder release correct positioning is verified simultaneously by rotation and zoom of the 3D-TEE image and angiography. The LAA occluder is shown in the 3D-TEE“Free view”(A) by using the tableside control and the fluoroscopy (B) demonstrating the relationship to surrounding structures (LCX, crista). Note the relatively large crista which could not be fully covered by the disc of the LAA occluder, while contrast agent injection demonstrated good LAA sealing.
doi:10.1371/journal.pone.0140386.g004
Minnesota) due to a rapidly progressive aortic regurgitation (pressure half time 440 ms, Jet/ LVOT 28%). The paravalvular leak closure had to be performed due to cardiac decompensa-tion and advanced dyspnoea. There was no evidence for dislocadecompensa-tion or thrombus formadecompensa-tion
Table 1. Baseline characteristics.ACE: angiotensin converting enzyme; AF: atrial fibrillation; INR: international normalized ratio; PCI: percutaneous coro-nary intervention; SD: standard deviation.
Total (n = 34) EN+ (n = 17) EN- (n = 17)
Demographics
Age (years), mean±SD 73.1±8.5 73.1±9.1 72.8±8.1
Male gender, n (%) 26 (76.5) 10 (58.8) 16 (94.1)
Body mass index (kg/m2), mean±SD 28.4±4.4 27.5±4.6 29.3±4.1
Other diseases
Hypertension, n (%) 28 (82.4) 13 (76.5) 15 (88.2)
Congestive heart failure, n (%) 29 (85.3) 14 (82.4) 15 (88.2)
Prior stroke / transient ischemic attack, n (%) 4 (11.8) 2 (11.8) 2 (11.8)
Coronary artery disease, n (%) 21 (61.8) 9 (52.9) 12 (70.6)
Prior myocardial infarction, n (%) 11 (32.4) 4 (23.5) 7 (41.2)
Previous PCI, n (%) 16 (47.1) 7 (41.2) 9 (52.9)
Pervious cardiac surgery, n (%) 4 (11.8) 3 (17.7) 4 (23.5)
Medical treatment prior to LAA closure
Acetylsalicylic acid, n (%) 33 (97.1) 16 (94.1) 17 (100)
Clopidogrel, n (%) 30 (88.2) 15 (88.2) 15 (88.2)
Phenprocoumon, n (%) 4 (11.8) 2 (11.8) 2 (11.8)
Novel oral anticoagulants, n (%) 2 (5.9) 1 (5.9) 1 (5.9)
Dual antithrombotic therapy, n (%) 30 (88.2) 15 (88.2) 15 (88.2)
Triple antithrombotic therapy, n (%) 4 (11.8) 2 (11.8) 2 (11.8)
Betablocker, n (%) 30 (88.2) 15 (88.2) 15 (88.2)
Class IV antiarrhythmics, n (%) 9 (26.5) 4 (23.5) 5 (29.4)
Digitalis glycosides, n (%) 9 (26.5) 3 (17.7) 6 (35.3)
ACE-inhibitors / sartans, n (%) 28 (82.4) 12 (70.6) 16 (47.1)
Diuretics, n (%) 18 (52.9) 9 (52.9) 99 (52.9)
Statins, n (%) 26 (76.5) 12 (70.6) 14 (82.4)
Antidiabetics, n (%) 8 (23.5) 4 (23.5) 4 (23.5)
Echocardiography parameter
Left ventricular ejection fraction (%), mean±SD 52±11 51±13 53±7
Left atrial area (cm2), mean±SD 26±8 26±9 26±9
AF pattern
Paroxysmal, n (%) 23 (67.7) 10 (58.8) 13 (76.5)
Persistent, n (%) 6 (17.7) 4 (23.5) 2 (11.8)
Long standing persistent, n (%) 5 (14.7) 3 (17.7) 2 (11.8)
Scores
CHA2DS2VASC 1/2/3/4/5-9, n 2/4/10/10/8 2/2/4/6/3 0/2/6/4/5
HAS BLED 0-1/2/3/4/5-9, n 3/11/13/7/0 2/5/7/3/0 1/6/6/4/0
EHRA I/II/III/IV, n 26/8/0/0 16/1/0/0 11/6/0/0
Indication for LAA closure
Bleeding, n (%) 22 (64.7) 13 (76.5) 9 (52.9)
INR lability, n (%) 4 (11.8) 1 (5.9) 3 (17.7)
Non compliance, n (%) 7 (20.6) 3 (17.7) 4 (23.5)
High bleeding risk, n (%) 1 (2.9) 0 (0) 1 (5.9)
related to the LAA occluder. In one patient of the EN- group a slight peri-device flow was docu-mented 3 months after LAA closure and oral anticoagulation was reinitiated due to the patient’s wish to reduce the risk of thromboembolism. During follow-up no accompanying car-diovascular events occurred.
Discussion
The major findings of the present study are: 1. Automated real-time integration of echocardi-ography and fluoroscopy was found to reduce radiation dose and fluoroscopy time during per-cutaneous left atrial appendage closure. 2. This approach did not prolong procedure time or increase periprocedural complications.
The combination of TEE and fluoroscopy is well established for percutaneous LAA closure due to the well known limitations of each of these modalities [15,20]: 2D-TEE ensures imaging quality of relevant anatomical structures but often needs several adjustments to visualize the course of intracardiac catheters and their relationship especially with the LAA orifice and body. The latter are only partly overcome by 3D-TEE [13,16]. Fluoroscopy optimally visualizes catheters, guidewires, and devices but is limited by its 2D projections of the complex 3D anat-omy of the LAA and surrounding structures. The automated real-time fusion of echocardiogra-phy and fluoroscopy combines the advantages of both imaging modalities. This might improve percutaneous LAA closure as supported by the present findings.
Integrated echocardiography and fluoroscopy imaging during LAA
closure
According to EHRA/EAPCI expert consensus on catheter-based LAA occlusion TEE is the gold standard for imaging the LAA and guiding LAA closure [21]. Nevertheless, TEE is an inte-gral part for guidance in most but not all LAA occlusion procedures. Whether the automated real-time integration of 2D-/3D-TEE and fluoroscopic images in the same anatomical align-ment might increase the number of TEE guided procedures is unknown. However, several potential benefits might be noteworthy [6]. First, landmark setting supports complex transsep-tal punctures [6] and LAA occluder positioning. Second, objects which are best visualized in
Table 2. Procedural data.
Total (n = 34) EN+ (n = 17) EN- (n = 17) p-value
Radiation dose (Gy/cm2), mean±SD 70.5±54 48.5±30.7 93.9±64.4 0.01
Fluoroscopy time (min), mean±SD 20.3±10 16.7±7 24.0±11.4 0.035
Contrast media amount (ml), mean±SD 184.9±110.6 172.3±92.7 197.5±127.8 0.53
Procedure time (min), mean±SD 89.9±29 89.6±28.8 90.1±30.2 0.96
Device sizes (mm), mean±SD 25±2 25±3 26±2 0.2
Lobe diameter (mm): 22/24/26/28/30, n 6/9/11/6/1 5/3/5/3/0 1/6/6/3/1
Major complications
Serious pericardial effusion - -
-Systemic embolism - -
-Ischemic stroke - -
-Hemorrhagic stroke - -
-Minor complications
Pericardial effusion, without tamponade - -
-Femoral hematoma, n (%) 2 (5.9) 1 (5.9) 1 (5.9)
Others - -
-doi:10.1371/journal.pone.0140386.t002
different imaging modalities (i.e. the LAA orifice in echocardiography and the device in fluo-roscopy) are directly and in real-time displayed in the same orientation. Especially during device deployment, when the anatomical target is best visualized in ultrasound and the device in fluoroscopy, the integrated imaging displays both modalities in the same perspective so that mental work is reduced for the operator. Third, integrated imaging provides in real-time sev-eral information for device deployment and stability in variable, patient-specific LAA anato-mies in one image. Features like free rotation and zoom of an echocardiographic image, which are controlled by a tableside control, add additional information to TEE color doppler and angiography regarding adequate LAA sealing and device stability. Some of these advantages might also be realized by intracardiac echocardiography [22]. This cannot be answered by the present study. The wider use of the latter might be influenced by operateur preferences and its availability while the EN incorporates modalities which are available in every catheterization laboratory.
Importantly, although the integrated imaging system can facilitate the procedure for the operator, it has also a potential safety concern. A shift between both imaging modalities may occur, so that the two images will not be displayed in the same orientation any more. Although this kind of shift is visualized on the screen (see green coloring of TEE probe in Figs2and3
which would turn red) procedural mistakes could occur.
Radiation exposure
The finding that the radiation exposure was reduced by using integrated imaging suggests that the software module facilitates left atrial visualization. It is likely that integrated images of the LAA obtained with echocardiography and fluoroscopy predominantly reduced the need for multiple LAA angiograms. Whether or how a pre-procedure computer tomographic angiogra-phy or an intra-procedure C-arm rotational angiograangiogra-phy might impact the identification of the optimal gantry position for device deployment in challenging cases was beyond the scope of the present study and needs to be determined. Although the impact of radiation dose reduction is not known, it may be relevant for several patient populations (e.g. obese and younger patients) and may in the future reduce the lifetime risk of cancer for medical staff performing fluoroscopy guided procedures over many years [23].
While radiation exposure was reduced, procedure time was similar in both groups. This might be in part explained by the fact that landmark setting and measurements during the pro-cedure are time-consuming [6]. This is in line with findings by Sündermann and colleagues who nicely demonstrated the feasibility of using the EN during edge-to-edge mitral valve repair [6]. In addition, angiographies are relatively standardized in our approach. The resulting pro-cedure time is still a noteworthy issue. Whether technical improvements like direct overlay might overcome this and other limitations has not been systematically investigated. It needs to be demonstrated if those upgrades might finally translate into improved outcome and patient safety.
Procedural success and follow-up
Although early in its clinical use, we investigated the potential impact of integrated imaging on short-term outcome.
drawn regarding the safety of integrated imaging from the present data. Variables like anatomi-cal variations or difficult TEE image acquisition may influence procedural success. Whether and how the presented approach might be useful to overcome technical challenges in some patients is yet not known. Further large-scale trials are warranted to ultimately assess the safety of this novel fusion imaging approach. However, there are no reasons to expect any unforeseen limitations when automated real-time image integration is used since its reliability and stability could be shown.
Conclusion
Automated real-time integration of echocardiography and fluoroscopy can be easily incorpo-rated into procedural work-flow of percutaneous left atrial appendage closure without prolong-ing procedure time. This approach results in a relevant reduction of radiation exposure for patients and medical staff.
Supporting Information
S1 CONSORT Checklist. CONSORT checklist.
(DOC)
S1 Protocol. Trial protocol.
(DOC)
S1 Table. Comparison of 2D-TEE and 3D-TEE LAA measurements.The LAA orifice area was smaller in 2D-TEE measurements (2.4±1.4 cm2) compared to 3D-TEE (2.9±1.1 cm2; p = 0.01). The maximum LAA orifice diameter (ANOVA; F = 1.589, p = 0.21) and length (ANOVA; F = 0.6821, p = 0.51) did not differ between 2D-, 3D-TEE and angiography. (DOCX)
S1 Fig. LAA characterization by using 2D- (A), 3D-TEE (B), and angiography (C).All three imaging modalities show different morphological details in a patient with nearly identical diameters of the LAA orifice. Note the LCX which is optimally visualized in 2D-TEE only. 3D-TEE derived LAA measurements have been described to be more accurate reflecting the
“real”LAA anatomy and morphology. In our experience a“stepwise approach”combining dif-ferent imaging modalities in a systematic manner give greater confidence during critical steps of the procedure.
(TIF)
S1 Moving Image. Integrated echocardiography and fluoroscopy imaging during LAA clo-sure.First, the conventional echocardiographic view using the x-plane mode (left panel) and the fluoroscopic view (right panel) including angiography are displayed. Outlines of 2D-TEE (right panel, pink lines) are fused with the fluoroscopy image. Next, in the four window view the 2D-TEE image (lower left panel) is in the same anatomical alignment as the C-arm (lower right panel). In a third window (upper left panel), the interventional cardiologist can simulta-neously rotate and zoom an echocardiography image (“Free”view) independently from the echocardiographer by using a tableside control. In the fourth window (upper right panel), the left atrium is shown in the conventional echocardiographic views (“Echo”view). Markers dem-onstrating the crista and LCX have been used.
(AVI)
S2 Moving Image. 3D Visualization of the left atrium during integrated imaging. Fluoros-copy (lower right) and 3D-TEE imaging are used to confirm correct device positioning. The LAA occluder is scanned in the 3D-TEE“Free view”(upper left) by using the tableside control
demonstrating the relationship to surrounding structures (LCX, crista). The sheath is displayed in the upper right panel. Note the large crista, which could not be fully covered by the occluder. (AVI)
Acknowledgments
We thank Friederike Jonas for excellent technical support.
Author Contributions
Conceived and designed the experiments: CJ CM. Performed the experiments: TZ JB CM. Ana-lyzed the data: CJ CE CM. Contributed reagents/materials/analysis tools: CE JB MK CM. Wrote the paper: CJ TZ JB CE MP EK VV MK SW CM.
References
1. Reddy VY, Möbius-Winkler S, Miller MA, Neuzil P, Schuler G, Wiebe J, et al. Left atrial appendage clo-sure with the watchman device in patients with a contraindication for oral anticoagulation. J Am Coll Cardiol. 2013; 61: 2551–2556. doi:10.1016/j.jacc.2013.03.035PMID:23583249
2. Landmesser U, Holmes DR. Left atrial appendage closure: a percutaneous transcatheter approach for stroke prevention in atrial fibrillation. Eur Heart J. 2012; 33: 698–704. doi:10.1093/eurheartj/ehr393 PMID:22041550
3. Lockwood SM, Alison JF, Obeyesekere MN, Mottram PM. Imaging the Left Atrial Appendage Prior to, During, and After Occlusion. J Am Coll Cardiol Img. 2011; 4: 303–306.
4. Stoddard MF, Dawkins PR, Prince CR, Ammash NM. Left atrial appendage thrombus is not uncommon in patients with acute atrial fibrillation and a recent embolic event: a transesophageal echocardio-graphic study. J Am Coll Cardiol. 1995; 25: 452–459. PMID:7829800
5. Reddy VY, Sievert H, Halperin J, Doshi SK, Buchbinder M, Neuzil P, et al. Percutaneous Left Atrial Appendage Closure vs Warfarin for Atrial Fibrillation. JAMA. 2014; 312: 1988–1998. doi:10.1001/jama. 2014.15192PMID:25399274
6. Sündermann SH, Biaggi P, Grünenfelder J, Gessat M, Felix C, Bettex D, Falk V, et al. Safety and feasi-bility of novel technology fusing echocardiography and fluoroscopy images during MitraClip interven-tions. EuroIntervention. 2014; 9: 1210–1216. doi:10.4244/EIJV9I10A203PMID:24103772
7. Gafoor S, Schulz P, Heuer L, Matic P, Franke J, Bertog S, et al. Use of EchoNavigator, a Novel Echo-cardiography-Fluoroscopy Overlay System, for Transseptal Puncture and Left Atrial Appendage Occlu-sion. J Interv Cardiol. 2015; 28: 215–217. doi:10.1111/joic.12170PMID:25676602
8. Viles-Gonzalez JF, Kar S, Douglas P, Dukkipati S, Feldman T, Horton R, et al. The Clinical Impact of Incomplete Left Atrial Appendage Closure With the Watchman Device in Patients With Atrial Fibrillation. J Am Coll Cardiol. 2012; 59: 923–929. doi:10.1016/j.jacc.2011.11.028PMID:22381428
9. Camm AJ, Kirchhof P, Lip GY, Schotten U, Savelieva I, Ernst S, et al. Guidelines for the management of atrial fibrillation: the Task Force for the Management of Atrial Fibrillation of the European Society of Cardiology (ESC). Eur Heart J. 2010; 31: 2369–2429. doi:10.1093/eurheartj/ehq278PMID:20802247 10. Nietlispach F, Gloekler S, Krause R, Shakir S, Schmid M, Khattab AA, et al. Amplatzer left atrial
appendage occlusion: single centre 10-year experience. Catheter Cardiovasc Interv. 2013; 82: 283– 289. doi:10.1002/ccd.24872PMID:23412815
11. Douglas PS, Garcia MJ, Haines DE, Lai WW, Manning WJ, Patel AR, et al. ACCF/ASE/AHA/ASNC/ HFSA/HRS/ SCAI/SCCM/SCCT/SCMR 2011 Appropriate Use Criteria for Echocardiography. A Report of the American College of Cardiology Foundation Appropriate Use Criteria Task Force, American Soci-ety of Echocardiography, American Heart Association, American SociSoci-ety of Nuclear Cardiology, Heart Failure Society of America, Heart Rhythm Society, Society for Cardiovascular Angiography and Inter-ventions, Society of Critical Care Medicine, Society of Cardiovascular Computed Tomography, Society for Cardiovascular Magnetic Resonance American College of Chest Physicians. J Am Soc Echocar-diogr. 2011; 24: 229–267. doi:10.1016/j.echo.2010.12.008PMID:21338862
12. Meyer C, Rana OR, Saygili E, Gemein C, Becker M, Nolte KW, et al. Augmentation of Left Ventricular Contractility by Cardiac Sympathetic Neural Stimulation. Circulation. 2010; 121: 1286–1294. doi:10. 1161/CIRCULATIONAHA.109.874263PMID:20212280
catheter-based left atrial appendage closure. Circ Cardiovasc Imaging. 2011; 4: 514–523. doi:10.1161/ CIRCIMAGING.111.963892PMID:21737601
14. Cruz-Gonzalez I, Yan BP, Lam Y. Left atrial appendage exclusion: state-of-the-art. Catheter Cardio-vasc Interv. 2010; 75: 806–813. doi:10.1002/ccd.22344PMID:20088009
15. Balzer J, Kelm M, Kuhl HP. Real-time three-dimensional transoesophageal echocardiography for guid-ance of non-coronary interventions in the catheter laboratory. Eur J Echocardiogr. 2009; 10: 341–349. doi:10.1093/ejechocard/jep006PMID:19211569
16. Balzer J, van Hall S, Rassaf T, Boring Y, Franke A, Lang RM, et al. Feasibility, safety, and efficacy of real-time three-dimensional transoesophageal echocardiography for guiding device closure of intera-trial communications: initial clinical experience and impact on radiation exposure. Eur J Echocardiogr. 2010; 11: 1–8. doi:10.1093/ejechocard/jep116PMID:19755469
17. Lang RM, Bierig M, Devereux RB, Flachskampf FA, Foster E, Pellikka PA, et al. Recommendations for chamber quantification: a report from the American Society of Echocardiography's Guidelines and Standards Committee and the Chamber Quantification Writing Group, developed in conjunction with the European Association of Echocardiography, a branch of the European Society of Cardiology. J Am Soc Echocardiogr. 2005; 18: 1440–1463. PMID:16376782
18. Balzer J, Kühl H, Rassaf T, Hoffmann R, Schauerte P, Kelm M, et al. Real-time transesophageal three-dimensional echocardiography for guidance of percutaneous cardiac interventions: first experience. Clin Res Cardiol. 2008; 97: 565–574. doi:10.1007/s00392-008-0676-3PMID:18512094
19. Shah SJ, Bardo DM, Sugeng L, Weinert L, Lodato JA, Knight BP, et al. Real-time three-dimensional transesophageal echocardiography of the left atrial appendage: initial experience in the clinical setting. J Am Soc Echocardiogr. 2008; 21: 1362–1368. doi:10.1016/j.echo.2008.09.024PMID:19041579 20. Faletra FF, Pedrazzini G, Pasotti E, Muzzarelli S, Dequarti MC, Murzilli R, et al. 3D TEE during
cathe-ter-based interventions. J Am Coll Cardiol Img. 2014; 7: 292–308.
21. Meier B, Blaauw Y, Khattab AA, Lewalter T, Sievert H, Tondo C, et al. EHRA/EAPCI expert consensus statement on catheter-based left atrial appendage occlusion. EuroIntervention. 2015; 10: 1109–1125. doi:10.4244/EIJY14M08_18PMID:25169595
22. Berti S, Paradossi U, Meucci F, Trianni G, Tzikas A, Rezzaghi M, et al. Periprocedural Intracardiac Echocardiography for Left Atrial Appendage Closure. JACC: Cardiovasc Interv. 2014; 7: 1036–1044. 23. Reddy VY, Morales G, Ahmed H, Neuzil P, Dukkipati S, Kim S, et al. Catheter ablation of atrial fibrilla-tion without the use of fluoroscopy. Heart Rhythm. 2010; 7: 1644–1653. doi:10.1016/j.hrthm.2010.07. 011PMID:20637313