ORIGINAL ARTICLE
Health-related quality of life and self-reported long-term
conditions: a population-based survey
Ivan R. Zimmermann,
1Marcus T. Silva,
2Tais F. Galvao,
3Mauricio G. Pereira
11Faculdade de Medicina, Universidade de Brası´lia (UnB), Brası´lia, DF, Brazil.2Faculdade de Medicina, Universidade Federal do Amazonas
(UFAM), Manaus, AM, Brazil.3Faculdade de Cieˆncias Farmaceˆuticas, Universidade Estadual de Campinas (UNICAMP), Campinas, SP.
Objective: To estimate and compare the effect of self-reported long-term health conditions and sociodemographic factors on perceived health-related quality of life (HRQoL).
Methods:A population-based survey of adults (18 to 65 years) living in Brasilia, Brazil, was conducted in 2012. Descriptive and multivariate analyses using a Tobit model were performed with data on sociodemographic variables, self-reported conditions, and the European Quality of Life-5 Dimensions (EQ-5D) health states, providing utility scores (preferred health state) between 0 and 1 for HRQoL estimates.
Results:The mean utility of 1,820 adults interviewed (mean age: 38.4612.6 years) was 0.883 (95% confidence interval [95%CI] 0.874-0.892), with 76.2% in the highest utility range (0.8 to 1.0). EQ-5D dimensions with moderate problems were pain/discomfort (33.8%) and anxiety/depression (20.5%). Serious problems were reported by only 0.3% of the sample in the mobility and self-care domain and by 3.1% in the pain/discomfort domain. Multivariate analysis revealed reduced HRQoL in individuals with depression, diabetes, and hypertension. Living in satellite towns (outside the city core), belonging to a lower economic class, or not being formally employed were also associated with decreased HRQoL. Beta coefficients for these impacts ranged from -0.033 (not formally employed) to -0.141 (depression), reflecting the strongest impact.
Conclusion: Of the long-term health conditions studied, depression had the greatest impact on HRQoL. Social class, employment status, and place of residence also affected HRQoL.
Keywords: Depression; chronic disease; health status disparities; quality of life; patient preference
Introduction
According to the World Health Organization (WHO), quality of life (QoL) is defined as ‘‘an individual’s percep-tion of their posipercep-tion in life in the context of the culture and value systems in which they live and in relation to their goals, expectations, standards and concerns.’’1 Under-standing QoL involves addressing complex, multifactorial relationships covering a broad range of economic, socio-cultural, and lifestyle factors. Stemming from the concept of QoL, the term health-related quality of life (HRQoL) has been coined to define the perception of individuals specifi-cally regarding health aspects. The notion of HRQoL may be appropriate to evaluate the functional impact of medical conditions or health interventions on the lives of patients.2
HRQoL is a useful measure for clinical, economic and policy-making settings. Not only is it widely employed as a primary patient-reported outcome in clinical research,3it has also become an important part of routine clinical practice.4 Economic evaluations rely heavily on HRQoL
as an outcome; one example is the quality-adjusted life-year (QALY), an effectiveness measure in cost-utility analyses.5Because it is able to capture individual
percep-tions of physical and social well-being within the con-text of each population, HRQoL may serve as a guide for planning and evaluating health policies aimed at improv-ing health and reducimprov-ing inequity.6
In addition to sociodemographic characteristics, such as gender, age, education, employment, and income,7-9 depression and a number of chronic diseases, such as heart failure, diabetes mellitus, and autoimmune diseases have been negatively associated with QoL.10-12In Brazil
as well as in other developing countries, the phenomenon of population aging, associated with reduced morbidity and mortality from infectious diseases, has boosted the potential burden of chronic diseases,13with major implica-tions for HRQoL.14
Many instruments have been developed to measure HRQoL,4 among which the European Quality of Life-5
Dimensions (EQ-5D) system. This generic measure of health status developed by the EuroQol Group is easily administered and interpreted, and can be used to evaluate both general and disease-specific populations.15 After data collection, each health state in the study population is linked to a pre-assigned value set that has been calculated by previous studies with representative samples.
Correspondence: Ivan R. Zimmermann, Faculdade de Medicina, Universidade de Brası´lia, Campus Universita´rio Darcy Ribeiro, Asa Norte, CEP 70910-000, Brası´lia, DF, Brazil.
E-mail: [email protected]
Submitted Nov 11 2015, accepted Mar 31 2016.
The capital of Brazil, Brası´lia, is a city of 2.5 million located in the country’s Midwest region. Currently, no population-based survey measuring HRQoL in Brası´lia is available. Thus, the aim of this study was to estimate and compare the effects of self-reported long-term health conditions and sociodemographic factors on HRQoL in adults living in Brası´lia.
Methods
Study design and setting
In 2012, a population-based cross-sectional study was conducted to evaluate the health status and medication use of adults living in Brası´lia.16 Briefly, the survey collected sociodemographic and clinical data through face-to-face interviews.
Participants
Adults (18-65 years old) living in Brası´lia were eligible for the study. The sample size was calculated considering 95% confidence levels, margins of error of 3%, a 1.5 design effect, and prevalence of 50% of medication use, since a reliable estimate was not available.17 The resulting sample size of 1,600 was increased by 15% to account for refusals, for a final sample size of 1,840 people.
In the first stage, 220 of 3,886 census tracts with more than 200 inhabitants were randomly selected. Sex and age quotas were defined for each census tract using the most recent official national estimates available at the time of the study. Up to 10 households were selected in each census tract by systematic sampling: in each tract, a number between 1 and 20 was randomly selected to define the first household to visit. After that, every 20th household was successively visited. In case of refusal to participate or if all residents were absent (empty house), the house immediately to the right was visited. If this second residence was also unavailable, the house imme-diately to the left was visited. One adult was interviewed per household.
Variables, data collection and measurement
All data were collected by four trained interviewers using printed semi-structured questionnaires covering socio-demographic and health status domains. Readability of the questionnaire was tested in 150 pilot interviews. Depression and other health conditions were all self-reported. After collection, the data were tabulated using Microsoft Excel®worksheets.
To evaluate HRQoL, the three level (3L) version of the EQ-5D instrument was used, assuming 1.0 for per-fect health and 0.0 for death.15,18 This questionnaire evaluates individuals’ perceptions of their own health status based on the following five dimensions: mobility, self-care, usual activities, pain/discomfort, and anxiety/ depression. For each dimension, three response levels are possible, reflecting the absence of problems or the presence of moderate and serious problems. The various
combinations of responses in each dimension add up to 243 different health states classified according to the severity of the problems in the five dimensions – 11111 reflects no problems in any dimension and 33333 reflects severe problems in all dimensions. Each of these five-dimensional health states is associated with a score that has been obtained by a survey of members of the community. In the present study, we used the results of the QALYBrasil study, developed with data collected in three Brazilian cities (Rio de Janeiro, Porto Alegre, Recife) and the state of Minas Gerais.19 Using the validated time-trade-off (TTO) instrument in a sample of 9,148 individuals, Santos et al.19 estimated the prefer-ence (utility) for each EQ-5D health state in the Brazilian general population. Based on these datasets, we were able to determine the utility values for each of the EQ-5D responses in our sample. For instance, the utility assigned to health state 11121, which reflects a subject who reports having moderate pain/discomfort and no problems in the other four domains (mobility, self-care, usual activities, and anxiety/depression), is 0.8214, based on the QALY-Brasil study data.
In the analysis of factors potentially associated with HRQoL, we considered the presence of self-reported health conditions including diabetes, hypertension, depression, heart disease, respiratory disease, or other diseases. Based on previous evaluations,7 we collected demo-graphic information regarding age, education, marital status, occupation, economic status, number of residents in the household, region of residence, and access to health services. To define economic status, the Brazilian standard for economic classification was employed.20 This method stratifies the population into five economic classes (E – poorest to A – wealthiest) based on the number of household appliances and the educational achievement of the family head. Each appliance in the household and the educational attainment of the head of the family receive a previously defined score. The scores are summed for classification of the family in one of the five classes.20
Statistical analysis
performed, the regression was truncated to yield scores between 0.0 and 1.0. Moreover, only variables with statistically significant associations (po0.05) were
retained in the regression models.
Ethics approval
The project was approved by the local ethics committee (Comiteˆ de E´ tica em Pesquisa com Seres Humanos, Faculdade de Cieˆncias da Sau´de, Universidade de Brası´lia) and all participants signed a consent form. The analysis of QoL was authorized by the EuroQol group.
Results
Characteristics of the participants
Of 2,051 individuals who were invited to participate in the study, 1,820 adults were included (response rate of 89%). As expected, utility scores had non-normal distribution (Figure 1). Distribution was asymmetric, with significant density on the right: 76.2% of subjects had scores above 0.8 and 51% had a score of 1.0 (perfect health).
Considering the three response levels for each EQ-5D dimension, most subjects reported having no problems (Figure 2). Moderate problems were reported in the pain/ discomfort (33.8%) and anxiety/depression (20.5%) dimensions. Severe problems were uncommon across all dimensions, ranging from 0.3% for mobility and self-care to 3.1% for pain/discomfort.
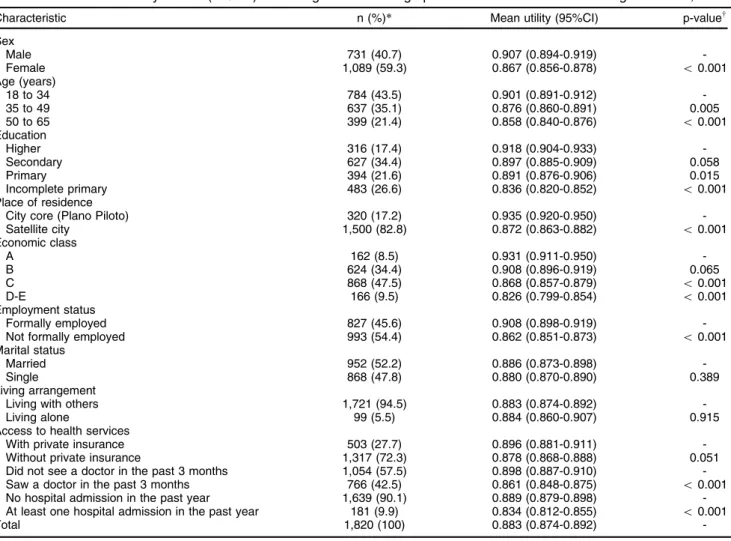
The mean age and mean utility score for the overall population was 38.4612.6 years and 0.883 (95% confidence
interval [95%CI] 0.874-0.892) respectively. As shown in Table 1, the 18-34 year group was the largest age group, with 43.5% of participants. Older participants (50-65 years old) had worse utility scores than younger partici-pants. Male participants reported higher utility scores than females. Only 17.4% of the participants had completed higher education. Participants in the lowest education category (incomplete primary education, 26.6%) reported lower utility values as compared to those with more education.
In the sample, 320 respondents lived in the city core (17.2%), known as Plano Piloto; these participants had higher EQ-5D scores as compared with participants living in other areas. Only a few individuals lived alone (5.5%), and their EQ-5D scores were similar to the scores of participants living with others. Similarly, there was no impact of marital status on utility scores across the overall sample. EQ-5D values were significantly different between lower (D-E) and upper (A-B) classes, with lower classes being associated with worse quality of life. Health status was also worse in unemployed individuals. Most patients reported not having private health insurance (72.3%); however, no significant impact on utility value was observed. In this context, seeing a doctor in the previous 3 months or going to a hospital in the previous year were marginally associated with lower utility.
Depression, other conditions, sociodemographic status, and quality of life
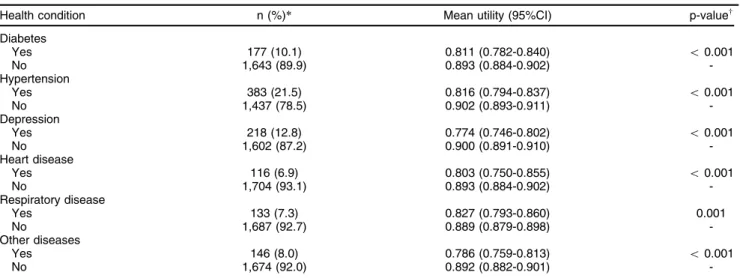
Of the five health conditions evaluated, hypertension, depression and diabetes were the most prevalent, which negatively impacted HRQoL (Table 2). The conditions categorized as other diseases (8.0%) were heterogeneous and did not allow building new groups to investigate other possible associations.
Eight sociodemographic variables were significantly associated with EQ-5D scores: place or residence, eco-nomic class, employment status, age, gender, education, doctor visits, and hospital admissions. These were included in the adjusted Tobit regression analysis to assess the effects of health conditions on HRQoL. Ultimately, at a 5% significance level, heart disease and respiratory disorders were no longer significantly asso-ciated with an effect on HRQoL score. In addition to the presence of depression, diabetes, hypertension or other diseases, the following sociodemographic variables remained as HRQoL modifiers in the Tobit adjusted analysis: living in the satellite towns, lower economic class (Class D-E), and being unemployed (Table 3).
The magnitude of these associations ranged from a beta coefficient of -0.033 for unemployment to -0.141 for depression. None of the other variables was statistically associated with effects on HRQoL scores.
Discussion
Using a generic instrument (EQ-5D), this study was able to measure HRQoL in a substantial sample of adults living in Brası´lia, Brazil. Although a consistent classification criterion is not available, the results showed high HRQoL
Figure 2 Self-perception of health according to the European Quality of Life-5 Dimensions (EQ-5D) instrument in adults living in Brası´lia, Brazil.
Table 1 Distribution of utility scores (EQ-5D) according to sociodemographic characteristics in adults living in Brası´lia, Brazil
Characteristic n (%)* Mean utility (95%CI) p-valuew
Sex
Male 731 (40.7) 0.907 (0.894-0.919)
-Female 1,089 (59.3) 0.867 (0.856-0.878) o0.001
Age (years)
18 to 34 784 (43.5) 0.901 (0.891-0.912)
-35 to 49 637 (35.1) 0.876 (0.860-0.891) 0.005
50 to 65 399 (21.4) 0.858 (0.840-0.876) o0.001
Education
Higher 316 (17.4) 0.918 (0.904-0.933)
-Secondary 627 (34.4) 0.897 (0.885-0.909) 0.058
Primary 394 (21.6) 0.891 (0.876-0.906) 0.015
Incomplete primary 483 (26.6) 0.836 (0.820-0.852) o0.001
Place of residence
City core (Plano Piloto) 320 (17.2) 0.935 (0.920-0.950)
-Satellite city 1,500 (82.8) 0.872 (0.863-0.882) o0.001
Economic class
A 162 (8.5) 0.931 (0.911-0.950)
-B 624 (34.4) 0.908 (0.896-0.919) 0.065
C 868 (47.5) 0.868 (0.857-0.879) o0.001
D-E 166 (9.5) 0.826 (0.799-0.854) o0.001
Employment status
Formally employed 827 (45.6) 0.908 (0.898-0.919)
-Not formally employed 993 (54.4) 0.862 (0.851-0.873) o0.001
Marital status
Married 952 (52.2) 0.886 (0.873-0.898)
-Single 868 (47.8) 0.880 (0.870-0.890) 0.389
Living arrangement
Living with others 1,721 (94.5) 0.883 (0.874-0.892)
-Living alone 99 (5.5) 0.884 (0.860-0.907) 0.915
Access to health services
With private insurance 503 (27.7) 0.896 (0.881-0.911)
-Without private insurance 1,317 (72.3) 0.878 (0.868-0.888) 0.051
Did not see a doctor in the past 3 months 1,054 (57.5) 0.898 (0.887-0.910)
-Saw a doctor in the past 3 months 766 (42.5) 0.861 (0.848-0.875) o0.001
No hospital admission in the past year 1,639 (90.1) 0.889 (0.879-0.898)
-At least one hospital admission in the past year 181 (9.9) 0.834 (0.812-0.855) o0.001
Total 1,820 (100) 0.883 (0.874-0.892)
-95%CI = 95% confidence interval; EQ-5D = European Quality of Life-5 Dimensions. *Relative frequency considering the effect of complex design.
in this sample, since more than 70% of the individuals were within the highest utility range (0.8 to 1.0). The utility scores had an asymmetric distribution profile, with a ceiling effect in values related with perfect health. Pain/ discomfort and anxiety/depression were the most expres-sive dimensions, having the highest frequency of moder-ate and severe problems. Multivarimoder-ate analysis showed that depression, diabetes, and hypertension were asso-ciated with worse HRQoL. Some sociodemographic factors, such as living in the satellite towns of Brası´lia, lower eco-nomic class, and unemployment, were also associated with lower HRQoL.
Our results are consistent with those of previous studies in the literature, which have described depres-sion as a major factor, along with chronic diseases, associated with reduced QoL.9,12,22,23 Population-based surveys10,11,23-25 using the EQ-5D instrument have detected an impact for diabetes, depression, and respira-tory disorders. Even though the impact for respirarespira-tory disorders was not significant in the present study, our
structured questionnaire included a large spectrum of self-reported respiratory conditions (asthma, bronchitis, or any other respiratory disorder), which could hypothetically explain this difference in relation to other population-based studies. Also consistent with other EQ-5D sur-veys,10,25 our multivariate analyses revealed lower or even absent effects of heart disease on HRQoL. Heart disease impacts on HRQoL might be dependent on a complex interaction with other conditions, such as hypertension; in addition, this impact could vary according to type and stage of heart disease. This is an important issue that deserves further investigations.26 The dimen-sions of pain/discomfort and anxiety/depression were also the main concerns in other EQ-5D investigations.25
In terms of sociodemographic characteristics, the asso-ciated factors are also consistent with those reported by other studies, reflecting changes in the perception of individuals regarding their HRQoL.7,9,10,22For the findings
about living in the satellite towns, we could hypothesize that the disparities are enhanced by more precarious urban infrastructure, lower incomes, higher levels of violence, and commuting time, considering that more than half of the residents do not work in the area where they live.27
One strength of the present study is that the HRQoL of adults living in Brası´lia was measured by a tool validated for the Brazilian context.18In addition, the performance of
the EQ-5D has been shown to be similar to that of other instruments,28,29 such as the World Health Organization Quality of Life (WHOQoL) instrument and the Medical Outcomes Study 36-item Short-Form (SF-36). Notably, the analysis used an appropriate model, that is, utility score data with Tobit regression. Additionally, the analysis used data from a large Brazilian population-based survey, which, due to the pre-defined quota method adopted, is highly representative of the Brası´lia population in terms of sex and age.16 In fact, the present study is the first to evaluate HRQoL using the EQ-5D in adults living in Brası´lia, Brazil.
Table 2 Utility scores (EQ-5D) for depression and chronic diseases in adults living in Brası´lia, Brazil
Health condition n (%)* Mean utility (95%CI) p-valuew
Diabetes
Yes 177 (10.1) 0.811 (0.782-0.840) o0.001
No 1,643 (89.9) 0.893 (0.884-0.902)
-Hypertension
Yes 383 (21.5) 0.816 (0.794-0.837) o0.001
No 1,437 (78.5) 0.902 (0.893-0.911)
-Depression
Yes 218 (12.8) 0.774 (0.746-0.802) o0.001
No 1,602 (87.2) 0.900 (0.891-0.910)
-Heart disease
Yes 116 (6.9) 0.803 (0.750-0.855) o0.001
No 1,704 (93.1) 0.893 (0.884-0.902)
-Respiratory disease
Yes 133 (7.3) 0.827 (0.793-0.860) 0.001
No 1,687 (92.7) 0.889 (0.879-0.898)
-Other diseases
Yes 146 (8.0) 0.786 (0.759-0.813) o0.001
No 1,674 (92.0) 0.892 (0.882-0.901)
-95%CI = 95% confidence interval; EQ-5D = European Quality of Life-5 Dimensions. *Relative frequency considering the effect of complex design.
wUnadjusted analysis (Tobit model).
Table 3 Estimates of the impact of depression, chronic diseases, and sociodemographic factors on utility scores (European Quality of Life-5 Dimensions [EQ-5D]) adjusted by the Tobit model in adults living in Brası´lia, Brazil
Variable Coefficient (b) p-value*
Health condition
Diabetes -0.081 o0.001
Hypertension -0.058 0.002
Depression -0.141 o0.001
Other disease -0.131 o0.001
Place of residence
Satellite city -0.079 0.004
Economic class
Class D-E -0.111 0.009
Employment status
Unemployed -0.033 0.020
Nevertheless, this investigation also has some limita-tions. First of all, the refusal rate was 11%. Even though this is considered to be low,30 no data are available
regarding refusal reasons, and there may have been selection bias resulting in under- or overestimation of the findings. Although enhancing the representativeness of age and sex, quota sampling implies limited interpreta-tions of selection probability and respective sample weights in the statistical analysis. Moreover, the cross-sectional nature of the design cannot exclude the possibility of reverse causality and the influence of confounding factors. Therefore, some residual confounding may have affected the estimates, because the data collection did not capture many factors that can also influence quality of life, such as urban mobility, type of housing, and leisure habits. Because of logistical implications, the identification of the health conditions was not based on validated diagnostic tests, such as fasting blood glucose levels for diabetes. In this context, although widely adopted31-33 and having good accuracy for some conditions, as diabetes and hypertension,34-36 the self-report of health
conditions may be a major limitation. The accuracy of self-report of health conditions may be potentially affected by social desirability and under or misdiagnosis, especially in socially sensitive issues like depression.37The cognitive perspective, including comprehension and recall, is another important concern of self-reporting.38 Despite our effort to avoid technical terms and complex recall tasks in the questionnaire, misclassifications may still have occurred. As may also occur with other self-reported health surveys,39,40 this issue could hypothetically affect mainly individuals with lower educational level, lower economic status, and older age (26.6%, 21.4% and 9.5% of the sample respectively). So, future research would benefit from using objective and validated instruments, such as the Patient Health Questionnaire-9 (PHQ-9)41for depression.
In conclusion, the present results show high HRQoL for people living in Brası´lia; and also that depression, lower social class, living in satellite towns, and having no job had a negative impact on HRQoL. These results are con-sistent with previous evidence in different settings and can guide interventions and the drawing of social and health policies to mitigate the negative impacts on HRQoL.
Acknowledgements
We thank the study participants and all the collaborators who contributed to the collection of data. This research was funded by the Conselho Nacional de Desenvolvi-mento Cientı´fico e Tecnolo´gico (CNPq; grant 564831/ 2010-7).
Disclosure
The authors report no conflicts of interest.
References
1 The World Health Organization Quality of Life assessment (WHO-QOL): position paper from the World Health Organization. Soc Sci Med. 1995;41:1403-9.
2 Kaplan RM, Ries AL. Quality of life: concept and definition. COPD. 2007;4:263-71.
3 Osoba D. Health-related quality of life and cancer clinical trials. Ther Adv Med Oncol. 2011;3:57-71.
4 Chen TH, Li L, Kochen MM. A systematic review: how to choose appropriate health-related quality of life (HRQOL) measures in routine general practice? J Zhejiang Univ Sci B. 2005;6:936-40.
5 Weinstein MC, Torrance G, McGuire A. QALYs: the basics. Value Health. 2009;12:S5-9.
6 Hennessy CH, Moriarty DG, Zack MM, Scherr PA, Brackbill R. Measuring health-related quality of life for public health surveillance. Public Health Rep. 1994;109:665-72.
7 Lubetkin EI, Jia H, Franks P, Gold MR. Relationship among socio-demographic factors, clinical conditions, and health-related quality of life: examining the EQ-5D in the U.S. general population. Qual Life Res. 2005;14:2187-96.
8 Zhu C, Geng Q, Yang H, Chen L, Fu X, Jiang W. Quality of life in China rural-to-urban female migrant factory workers: a before-and-after study. Health Qual Life Outcomes. 2013;11:123-123.
9 Fujikawa A, Suzue T, Jitsunari F, Hirao T. Evaluation of health-related quality of life using EQ-5D in Takamatsu, Japan. Environ Health Prev Med. 2011;16:25-35.
10 Wu M, Brazier JE, Kearns B, Relton C, Smith C, Cooper CL. Examining the impact of 11 long-standing health conditions on health-related quality of life using the EQ-5D in a general population sample. Eur J Heal Econ. 2015;16:141-51.
11 Saarni SI, Ha¨rka¨nen T, Sintonen H, Suvisaari J, Koskinen S, Aromaa A, et al. The impact of 29 chronic conditions on health-related quality of life: a general population survey in Finland using 15D and EQ-5D. Qual Life Res. 2006;15:1403-14.
12 Moussavi S, Chatterji S, Verdes E, Tandon A, Patel V, Ustun B. Depression, chronic diseases, and decrements in health: results from the World Health Surveys. Lancet. 2007;370:851-8.
13 Schmidt MI, Duncan BB, Azevedo e Silva G, Menezes AM, Monteiro CA, Barreto SM, et al. Chronic non-communicable diseases in Brazil: burden and current challenges. Lancet. 2011;377:1949-61. 14 De Maio FG. Understanding chronic non-communicable diseases in
Latin America: towards an equity-based research agenda. Global Health. 2011;7:36-36.
15 EuroQol Group. EuroQol--a new facility for the measurement of health-related quality of life. Health Policy. 1990;16:199-208. 16 Galvao TF, Silva MT, Gross R, Pereira MG. Medication use in adults
living in Brası´lia, Brazil: a cross-sectional, population-based study. Pharmacoepidemiol Drug Saf. 2014;23:507-14.
17 Arya R, Antonisamy B, Kumar S. Sample size estimation in pre-valence studies. Indian J Pediatr. 2012;79:1482-8.
18 Brooks R. EuroQol: the current state of play. Health Policy. 1996;37:53-72.
19 Santos M, Cintra MA, Monteiro AL, Santos B, Gusma˜o-Filho F, Andrade MV, et al. Brazilian valuation of EQ-5D-3L health states: results from a saturation study. Med Decis Making. 2016;36: 253-63.
20 Associac¸a˜o Brasileira de Empresas de Pesquisa (ABEP). Crite´rio de Classificac¸a˜o Econoˆmica Brasil [Internet]. 2012. abep.org/criterio-brasil.
21 Austin PC, Escobar M, Kopec JA. The use of the Tobit model for analyzing measures of health status. Qual Life Res. 2000;9:901-10. 22 Pelegrino VM, Dantas RAS, Clark AM. Health-related quality of life determinants in outpatients with heart failure. Rev Lat Am Enferma-gem. 2011;19:451-7.
23 Boros PW, Lubin´ski W. Health state and the quality of life in patients with chronic obstructive pulmonary disease in Poland: a study using the EuroQoL-5D questionnaire. Pol Arch Med Wewn. 2012;122: 73-81.
24 Burstro¨m K, Johannesson M, Diderichsen F. Swedish population health-related quality of life results using the EQ-5D. Qual Life Res. 2001;10:621-35.
25 Tan Z, Liang Y, Liu S, Cao W, Tu H, Guo L, et al. Health-related quality of life as measured with EQ-5D among populations with and without specific chronic conditions: a population-based survey in Shaanxi Province, China. PLoS One. 2013;8:e65958.
27 Nunes BF, Costa A. Distrito Federal e Brası´lia: dinaˆmica urbana, violeˆncia e heterogeneidade social. Cad Metropole. 2007;17:35-59. 28 Essink-Bot ML, Krabbe PF, Bonsel GJ, Aaronson NK. An empirical
comparison of four generic health status measures. The Nottingham Health Profile, the Medical Outcomes Study 36-item Short-Form Health Survey, the COOP/WONCA charts, and the EuroQol instru-ment. Med Care. 1997;35:522-37.
29 Macran S, Weatherly H, Kind P. Measuring population health: a comparison of three generic health status measures. Med Care. 2003;41:218-31.
30 Langbein LI, Felbinger CL. Public program evaluation: a statistical guide. Armonk: M.E. Sharpe; 2006.
31 Moreira JP, Moraes JR, Luiz RR. Prevalence of self-reported sys-temic arterial hypertension in urban and rural environments in Brazil: a population-based study. Cad Saude Publica. 2013;29:62-72. 32 Oliveira PD, Menezes AM, Bertoldi AD, Wehrmeister FC. Inhaler use
in adolescents and adults with self-reported physician-diagnosed asthma, bronchitis, or emphysema in the city of Pelotas, Brazil. J Bras Pneumol. 2013;39:287-95.
33 da Costa JS, Olinto MT, Assunc¸a˜o MC, Gigante DP, Macedo S, Menezes AM. [Prevalence of Diabetes Mellitus in Southern Brazil: a population-based study]. Rev Saude Publica. 2006;40:542-5. 34 De Castro Selem SS, de Castro MA, Carlos JV, Gorgulho B,
Marchioni DML, Fisberg RM, et al. P1-230 Validity of self-reported hypertension among Brazilian adults. J Epidemiol Community Health. 2011;65:A130-A130.
35 Muggah E, Graves E, Bennett C, Manuel DG. Ascertainment of chronic diseases using population health data: a comparison of health administrative data and patient self-report. BMC Public Health. 2013;13:16.
36 Huerta JM, Tormo MJ, Egea-Caparro´s JM, Ortola´-Devesa JB, Navarro C. Accuracy of Self-Reported Diabetes, Hypertension, and Hyperlipidemia in the Adult Spanish Population. DINO Study Find-ings. Rev Esp Cardiol. 2009;62:143-52.
37 Van de Mortel TF. Faking it: social desirability response bias in self-report research. Aust J Adv Nurs. 2008;25:40-8.
38 Barker C, Pistrang N, Elliott R. Self-report methods. In: Roberts MC, Ilardi SS, editors. Research methods in clinical psychology. New Jersey: John Wiley & Sons; 2005. p. 94-118.
39 Okura Y, Urban LH, Mahoney DW, Jacobsen SJ, Rodeheffer RJ. Agreement between self-report questionnaires and medical record data was substantial for diabetes, hypertension, myocardial infarction and stroke but not for heart failure. J Clin Epidemiol. 2004;57: 1096-103.
40 Scazufca M, Menezes PR, Vallada H, Araya R. Validity of the self reporting questionnaire-20 in epidemiological studies with older adults: results from the Sao Paulo Ageing & Health Study. Soc Psychiatry Psychiatr Epidemiol. 2009;44:247-54.