©2014 Science Publication
doi:10.3844/ajassp.2014.548.557 Published Online 11 (4) 2014 (http://www.thescipub.com/ajas.toc)
Corresponding Author: Fereshteh Farzianpour, Department of Health Management and Economics, School of Public Health, Tehran University of Medical Sciences, Tehran, Iran Tel: 982144648943 Fax: 982188989129
MODELING THE EFFECTIVENESS OF THE CORPORATE
IDENTITY MIX IN PERCEIVED QUALITY AND CUSTOMER-
RELATED BRAND EQUITY WITH INTERPRETIVE
STRUCTURAL EQUATIONS AND MICMAC ANALYSIS
1
Mahsa Pishdar,
2Mohammad Reza Seyyed Hashemi Toloun,
3
Fereshteh Farzianpour and
4Morteza Rezaeiasl
1
Department of Production and Operation Management, Allameh Tabatabaii University, Tehran, Iran
2
Department of Management, Sohrevardi Institution, Qazvin, Iran
3
Department of Health Management and Economics, School of Public Health, Tehran University of Medical Sciences, Tehran, Iran
4
Department of Management, Tarbiat Modares University, Tehran, Iran
Received 2013-12-12; Revised 2013-12-19; Accepted 2014-01-29
ABSTRACT
This study aims to identify the relation between corporate identity mix, perceived quality on customers’ behalf and customer-centric brand equity. A review of the available literature within this scope resulted in making a primary model which represents that the corporate identity mix has an effect upon the perceived quality and brand equity by some variables such as corporate image and corporate reputation. Statistical analysis of the formulated hypotheses leads us to the conclusion that the influence of identity mix on corporate image and other correlations showed in the primary model could not be denied. Confirmatory Factor Analysis (CFA) was executed and, as a result, established that all fitting indexes are in an immaculate condition and factor loadings are significant when the confidence level is 95%. So, the primary model of the survey will be supplemented with some new relations. It appears that the corporate identity mix can directly affect the brand equity, corporate reputation and perceived identity, besides, corporate image and corporate reputation directly affect the brand equity. The upshot of the MICMAC analysis on corporate identity mix variables shows that corporate characteristic and culture play a key role in this system.
Keywords: Corporate Identity, Perceived Quality, Brand Equity, Corporate Image, Corporate Reputation
1. INTRODUCTION
Corporate identity is a whole new concept in today’s world and has been considered more in academic papers (Swoboda et al., 2013). Also, in recent years, there is a growing tendency to realizing the basis of corporate identity, by stakeholders. Indeed, the corporate identity is the ethics, principals and the bases that form the corporate brand (Powell, 2011). So, thecorporate identity mix plays an important role in achieving the organizational objectives. This matter represents the importance of the corporate
identity concept and makes the conducting of corporate identity mix more crucial (Leitch and Davenport, 2011).
worth to mention that the perceived quality is also of great importance to the organizations. Former studies indicate that perceived quality can affect the rate of return investment. However, obtaining the perceived quality is even more onerous than getting the perceived innovation. Providing the customer with best quality is not enough. We should manage the customers’ perception of the quality in order to raise the importance of brand equity in customer’s view or even the retailers (Buil et al., 2013; Farzianpour et al., 2014).
According to the points mentioned and also, considering that the perceived quality affects the brand equity and ensures the corporate’s survival in the current competitive markets, we can understand how critical is the current study (Farzianpour et al., 2013a). So, the problem statement of this survey is that whether or not the identity mix can affect the perceived quality of the product or service on behalf of customers and customer related brand equity (Farzianpour et al., 2013a). Getting the answer to this question is the main purpose of this study. Finding answer to some questions is subordinate to the main purposes of the study. Some of these questions are as follows; does the identity mix affect the corporate image? Does the corporate image have an influence over the corporate reputation? And also, can the perceived quality affect the customer related brand equity?
1.1. Literature Review
Corporate identity needs special consideration. Everyone knows that, while you are providing the customer with a service or product, indeed, you are presenting the corporate identity to them (Farzianpour et al., 2013b). Most researchers have considered the concept of corporate identity as a clue to appreciate the modernity- oriented organizations (Farzianpour et al., 2012). However, there is no single definition for the corporate identity (Hatch and Yanow, 2006). From Rodrigues and Child (2008) point of view, the corporate identity is the concept most used by senior managers, in order to represent the distinctive characteristic of the organization. Moreover, these two researchers firmly believe that senior managers define some characteristics for the corporate identity, in order to outline the organization commitment to the social responsibilities (Rodrigues and Child, 2008). In another study, corporate identity defined as a specified general feature that could make interactions with stakeholders and structure the way they cooperate in different affairs (Cornelissen et al., 2007). According to these definitions, we can consider the corporate identity as a
strategic activity which utilizes some signs for introducing the corporate to the stakeholders. However, the corporate identity has not made only by one special corporate. Actually, the way that corporate interact with other corporations can also construct the corporate identity (Oberg et al., 2010).
Lack of one special and general definition for the identity, makes it difficult to describe its components more certainly. Different researchers consider various components for determining the corporate identity. But in some studies, such as Van et al. (2001) and Van and Balmer (1997), identity mix consists of four elements that are considered here. These elements are as follows; behavior which is most important factor in determination of corporate identity and make it possible for the stakeholders to judge the corporate performance. The behavior of organization members has a direct relationship with its identity; symbolism implicitly indicates that the corporate wants to be a symbol of what. Of course, the logo can be noticed as an important symbol for introducing the corporations; relationships that can flexibly transfer corporate various messages towards the stakeholders; and the last one is the characteristic which means the corporate understanding of its own. Certainly, the corporate should know itself, before doing any action. But from the Aaker (2004) and Bartholme and Melewar (2011) point of view, innovation is of the greatest value to the organizations that should be invested in. the vast majority of organizations, particularly Japanese corporations, attempt to be the most innovative one. When the innovation is understandable and relevant, could give the corporation a special identity. Some corporations such as SONY, made a lot of money out of utilizing innovation. So, it seems somehow rational to consider the innovation as one of the components of the identity mix, in this study. On the other hand, all the mentioned components are influenced by the corporate’s culture and construct their activities based on that. In other words, organizational culture can adjust the way that other components of the identity mix do accordingly. Therefore, culture is a kind of notion that covers the corporate identity and complement the corporate identity used in this study (Balmer, 2011; Van and Balmer, 1997).
can be considered as the stakeholders’ understanding from the organization or is the through which, the member of organization can lead towards the others view about their organizations (Balmer, 2008). So, we can explain the first hypothesis of this study as follows:
Hypothesis 1: The corporate identity mix can directly affect the corporate image.
Reputation has defined as the stakeholders’ judgment of the organization, i.e., this is the judgment formed on the basis of social perception from official or non- official (symbolic) affairs of the organization. It is said that, at least a portion of reputation results from its relationships and represents the corporate identity. If the value added to corporate image, then the corporate reputation will be constructed (Hildebrand and Sen, 2011). Actually, members’ behavior, symbolism and interactions should systematically manage in a planned way, in order to make the corporation well known (Punjaisri and Wilson, 2011). Therefore, it can be assumed that:
Hypothesis 2: Corporate image has an effect on the corporate reputation.
Each of stakeholders, according to their experiences and socio-culture factors, get an understanding of the product or service quality, which may be completely different from the provided real quality (Hamidi et al., 2010). On the other hand, when have the high degree of uncertainty in product quality, so the customers, based on the brand reputation, turn to the selection of special kind of product. As a result, the third hypothesis can be defined as follows:
Hypothesis 3: Corporate reputation can affect the
perceived quality
Various studies have done upon the evaluating brands and different methods have been offered. For example, some researchers believe that the brand equity is a financial measurement and must be evaluated according to the effects it has on the financial performance indicators, such as sale, profit and operational margin (Shamma and Salah, 2011).
Keller (1993) defines the brand equity as a distinctive effect, resulted from the brand knowledge, on the customer’s reaction towards the brand marketing. He mentioned the brand knowledge, in order to indicate the awareness about the brand and also mentioned the customer’s reaction, in order to indicate the customer’s perception about the product or service. Aaker (1996) describes four main factors determining the brand equity. These factors are: Awareness of brand, loyalty to the
brand, perceived quality and association of brand. The effects of brand equity on the customer loyalty can be even more significant than the effect of corporate reputation on the customer loyalty. So, the next hypothesis forms in this way:
Hypothesis 4: Perceived quality affect the customer- related brand equity.
According to the study purpose and the considered hypothesis, we can have the conceptual model of the study, as follows in Fig. 1.
1.2. Study Findings’ Analysis
1.2.1. Estimating the Model
By paying attention to the observed data, parameters of freedom should be estimated after defining the model. Iterative Method such as Maximum Likelihood (ML) or Generalized Least Squares will be used for estimating the model.
The instruction of these estimation procedures is that an Implied Covariance Matrix will be made in each of the iterations and compared with the Observed data Covariance Matrix. Making comparison between these two covariances can lead to creating a residual Matrix and these iterations will be continued until this matrix becomes the minimum. Calculating or estimating the parameters is possible with maximum 250 times of iteration. If the number of iteration becomes more than 250 times, the calculation of estimating the parameter will be ceased.
1.3. Making the Covariance Matrix
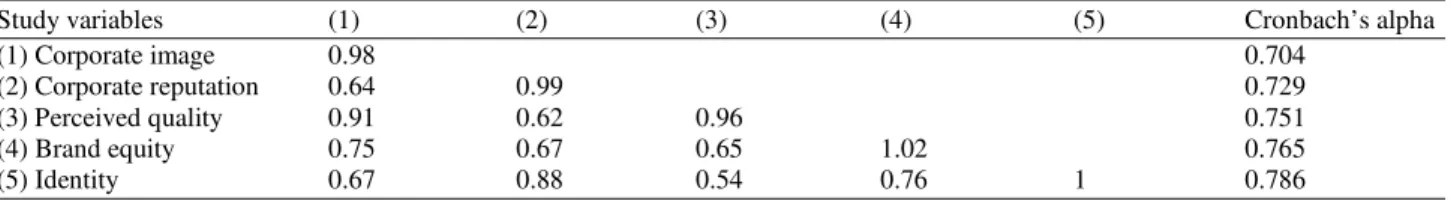
LISREL analysis is based on the covariance matrix between the Observed and Latent variables. Table 1 refers to the covariance matrix between the latent variables.
According to the Table 1, all the correlations between the external and internal latent variables are significant. The correlations of all the variables are positive, too. In the last common of this table, Cronbach's alpha coefficient for the variables has shown. All these coefficients are more than 0.7, so, it confirms the reliability and validity of measuring tools.
1.4. Tests and Analysis Relevant to the Study’s
Hypothesis
There are three types of relationships between the observed variables and latent variables in the structural equations models.
Fig. 1. The primary conceptual model of the study
Table 1. Cronbach's alpha and covariance Matrix of the latent variables (sample size- 156)
Study variables (1) (2) (3) (4) (5) Cronbach’s alpha
(1) Corporate image 0.98 0.704
(2) Corporate reputation 0.64 0.99 0.729
(3) Perceived quality 0.91 0.62 0.96 0.751
(4) Brand equity 0.75 0.67 0.65 1.02 0.765
(5) Identity 0.67 0.88 0.54 0.76 1 0.786
Direct effect: Actually, direct effect is one of the elements of the structural equations models and represents a Directional relationship between two variables. Usually, this kind of relationship can be evaluated by the Analysis of Variance (ANOVA). Actually, this impact indicates the causative linear effect of one variable on another one. Each direct effect, in a model, can define a relationship between an independent variable and a dependent variable. But, a dependent variable in another direct effect, can be an independent one and vice versa.
Moreover, in a multiple regression model, a dependent variable can be linked with several other dependent variables and also, an independent variable in the Multivariate Analysis of Variance (MANOVA) can be linked with several other dependent ones. This issue that sometimes a dependent variable can transform into an independent variable causes the creation of third term called indirect effect.
Indirect effect: Actually, this is the effect of an independent variable on the dependent one by one or several mediating or intervening variables. In an indirect effect, an intervening variable plays a role of an independent variable towards a variable and vice versa, plays a role of a dependent variable towards another variable. You can find this kind of effect in the path analysis.
1.5. Evaluation of Fit
When the implicit covariance matrix of the model is equivalent to the observed data covariance matrix, we can say that the model is fitted with some observed data, i.e., the remaining matrix and its components should be near the zero. But, it depends on the evaluation method, model, observed data features.
The most important fit index is Chi-squared (χ2) test. But for applying this test you should observe some assumptions more carefully. As the Chi-squared (χ2) test is not that much satisfactory, some other adjunct fit index has been appeared, such as GFI, NFI and AGFI. When the value of these indexes gets high, the model will be fitted much more better. Fitting indexes of this study can be seen in Table 2.
1.6. Conclusions of Confirmatory Factor Analysis
Goodness of fit testing for conceptual model in form of path analysis figure.
shown in Table 3 are significant in the confidence level of 95% and play a significant role in measuring
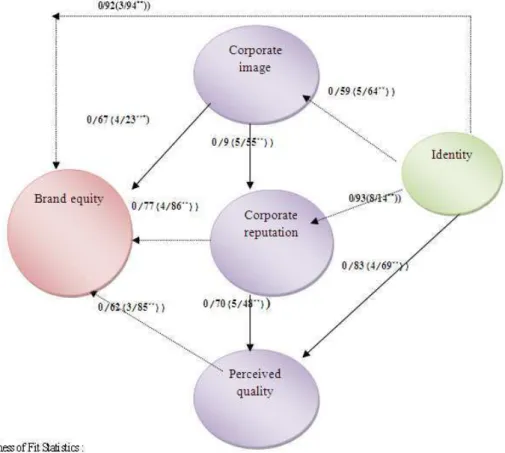
the relevant structure. So, the primary model of the study transform into the status illustrated in Fig. 2.
Fig. 2. Structural equations model
Table 2. Fitting indexes of a model
Calculated figures
---
Index name Calculated figure Permissible limit
Chi-squared (χ2) /degree of freedom 2.330 Lower than 3
Goodness of Fit Index (GFI) 0.910 More than 0.9
Root Mean Square Error of Approximation (RMSEA) 0.067 Lower than 0.1
Comparative Fit Index (CFI) 0.950 More than 0.9
Adjusted Goodness of Fit Index (AGFI) 0.820 More than 0.8
Normed Fit Index (NFI) 0.940 More than 0.9
Table 3. Loading factors
Corporate Corporate Perceived Brand
Identity image reputation quality equity
Behavior 0.23 First Item 0.5 First item 0.91 First item 0.62 First item 0.42
Symbolism 0.36 Second item 0.59 Second item 0.64 Second item 0.59 Second item 0.4
Corporate 0.37 Third item 0.62 Third item 0.34
characteristic
Innovation 0.62 Fourth item 0.59
Communication 0.52
Culture 0.67
All the factor loadings are significant in the confidence level of 99%
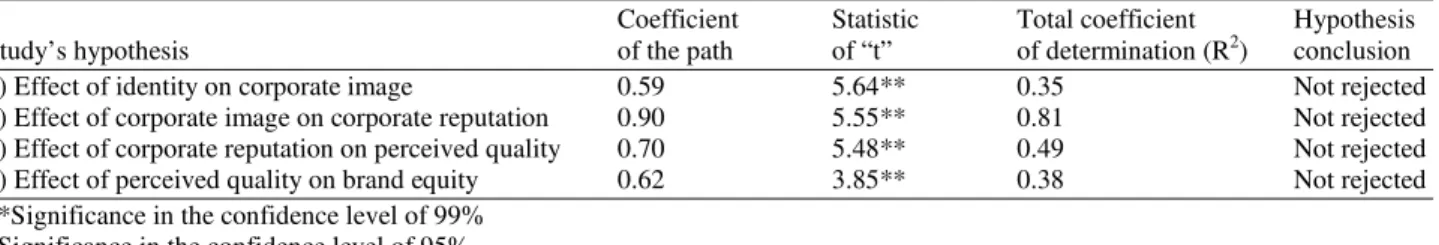
Table 4. Coefficients of the path, statistic of “t” &coefficient of determination
Coefficient Statistic Total coefficient Hypothesis
Study’s hypothesis of the path of “t” of determination (R2) conclusion
1) Effect of identity on corporate image 0.59 5.64** 0.35 Not rejected
2) Effect of corporate image on corporate reputation 0.90 5.55** 0.81 Not rejected
3) Effect of corporate reputation on perceived quality 0.70 5.48** 0.49 Not rejected
4) Effect of perceived quality on brand equity 0.62 3.85** 0.38 Not rejected
**Significance in the confidence level of 99% *Significance in the confidence level of 95%
1.7. Replying to the Study Hypotheses with the
Aid of Structural Equations
This study consists of 5 latent variables and 17 observed variables. Observed variables measure directly by the researcher, while the latent one measure indirectly. They will be perceived based on the correlations between the measured variables. The latent variables of this study come under two categories; endogenous and exogenous. The latent variables indicate a series of theoretical structure such as abstract concepts which are not observable directly and could be noticed by other observed variables. The latent variables could be divided into endogenous (downstream) variables and exogenous (upstream) variables. Each variable in the structural equations model system can be considered as both the endogenous variable and exogenous one. Endogenous variable is a kind of variable which can be affected by other variables in the model. While, the exogenous variable is a kind of variable which could not be affected by any of the variables in the model but it will affect the others.
In This study we consider the identity as an exogenous variable and corporate image, corporate reputation, perceived quality and brand equity as the endogenous variables.
1.8. Model’s Direct Effects
This study consists of 4 main and direct effects shown in Table 4. According to the statistic “t”, identity variable has a direct and significant effect on the corporate image in the confidence level of 99%. Here,
the determined coefficient equivalent to 0.35. Therefore, the identity variable has got the ability of 35% to predict the corporate image and the remaining 65% is related to the prediction error. The determination coefficient investigates that what percentages of the variations in dependent variable has been made with the independent variable, or to what extent we can anticipate the dependent variable by the independent one.
Corporate image variable has a significant and direct effect on the corporate reputation. Here, the amount of determination coefficient is 0.81. So, the corporate image variable has the ability of 81% to anticipate the corporate reputation and the remaining 19% is related to the prediction error.
Corporate reputation variable has got a significant and direct effect on the perceived quality and the determination coefficient has become 0.49. Therefore, the corporate reputation variable has got the ability of 49% to anticipate the perceived quality and the remaining 51% is related to the prediction error.
Perceived quality variable has got a significant and direct effect on the brand equity and the determination coefficient has become 0.38. Therefore, the perceived quality variable has got the ability of 38% to anticipate the brand equity and the remaining 62% is related to the prediction error.
1.9. Model’s Indirect Effects
reputation, perceived quality and brand equity, in the confidence level of 99%. Also, corporate image and corporate reputation have an indirect and significant effect on the brand equity, in the confidence level of 99%. All these relations are positive.
1.10. Leveling the Identity Mix Variables with
Using Interpretive Structural Modeling
Since the corporate identity is mixed of six variables, it appears useful to analyze such a system. With using the interpretive- structural equations technique we can level the considered variables. Moreover, MICMAC analysis makes it possible to recognize the leading variables in the system and the variables which are more dependent to the system. Such analysis causes to appreciate the system more. For applying this method and leveling the variables, must construct the Structural self-Interaction Matrix. This matrix is a kind of matrix with the dimension of variables which are mentioned, in order, in the first row and column of the matrix. Then, the relationships between these variables will be determined two by two (Mathiyazhagan et al., 2013).
If we want to get advice from an expert, considered in this study, we should provide them with a numerical range and ask them to complete the matrix based on this range. The results getting from the experts should be totalized. Since the components of reachability matrix must be zero or one, an equal numerical scale will be defined. Often, this numerical scale is twice as many as number of collected questionnaires. Then, the number of each element will be compared to this numerical scale. If the matrix element is more than this numerical scale or even equal to, you should replace this element with 1, otherwise, put zero instead of that. Finally, the obtained matrix will be added to Unit matrix in order to make the reachability matrix (Bolanos et al., 2005). Modified reachability matrix shown in Table 6. Since we got 10 experts’ point of view, the equal numerical scale becomes 20.
For making internal adjustment in reachability matrix after getting the experts’ point of view and completing the matrix, we should consider the factors that affect each other indirectly and change their relevant zero to 1. This 1 is separated from other numbers with putting a star next to that. For example, according to the direct effects obtained from experts, behavior affects the corporate characteristic. On the other hand, corporate characteristic affects the culture. So, behavior has an indirect effect on culture. Modified reachability matrix shown in Table 6.
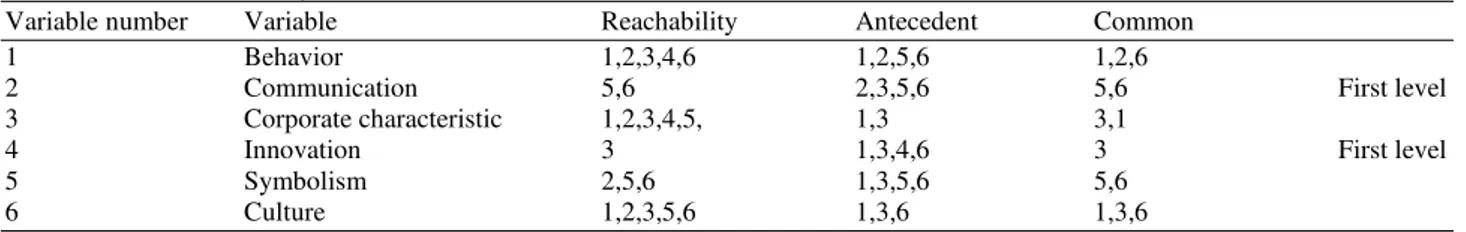
In order to develop ISM, one should make the sets of reachability, antecedent and common. Access set is a kind of collection that the criteria number in its rows is 1. Prerequisite set is a kind of collection in which the columns are 1. Common set has composed of the similar components of the access set and prerequisite set. These sets described in Table 7.
Each variable or variables that their access sets and common sets equal with each other, goes to level 1. Here, interaction and innovation variables have represent this feature. So, they go in the first level. For getting the variables in the second level, should eliminate the rows of these variables from Table 7 and cut out the relevant numbers to this variable, i.e., cut out 2 and 4 from the remaining sets. So, the variables that their access and common sets have become equal go to the second level, again. This will be continued till the leveling of all the variables. See the Table 8. For drawing the graph, the first level variables go to the top and then the other levels come after in priority. You can see the graph in Fig. 3. In this study, variables are divided in four main levels. Variable of behavior goes in fourth level, in other words, this variable is the basis of the corporate identity mix.
1.11. MICMAC Analysis
According to the driving power and variables’ dependency level which is got from sum of the relevant row and column (in order) to the variables in the modified reachability matrix, we can divide the variables into four groups; dependent variables, independent variables, key variables and linking variables. As a result of this categorization we will be able to appreciate the considered system much better Fig. 4.
Independent variables are a kind of variables that have a little interaction with the system and they are somehow, distinct from that. As you can see in Fig. 4, none of the variables of identity mix in this study are independent variables.
Dependent variables have a little guidance power but they are extremely dependent to the system. In this study, some variables such as, interactions, innovation and symbolism are dependent variables. These variables can seldom affect other variables but they are affected by others more.
Fig. 3. Developed model of ISM for the identity mix
Fig. 4. Classifying variables of the identity mix
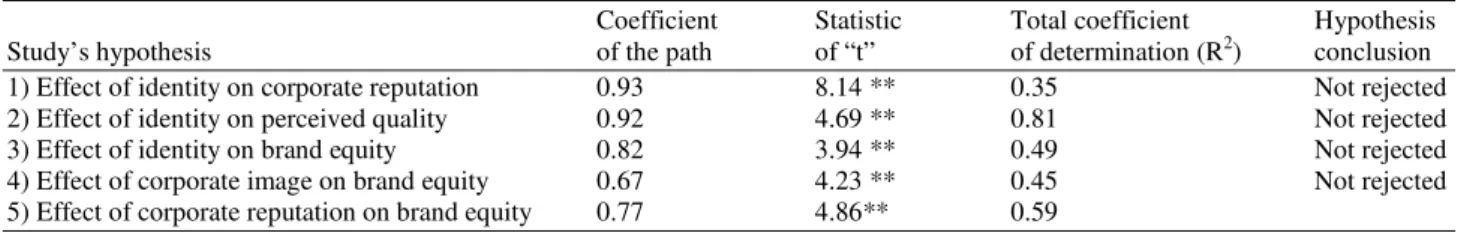
Table 5. Coefficients of the path, statistic of “t” & coefficient of determination
Coefficient Statistic Total coefficient Hypothesis
Study’s hypothesis of the path of “t” of determination (R2) conclusion
1) Effect of identity on corporate reputation 0.93 8.14 ** 0.35 Not rejected
2) Effect of identity on perceived quality 0.92 4.69 ** 0.81 Not rejected
3) Effect of identity on brand equity 0.82 3.94 ** 0.49 Not rejected
4) Effect of corporate image on brand equity 0.67 4.23 ** 0.45 Not rejected
5) Effect of corporate reputation on brand equity 0.77 4.86** 0.59
**Significance in the confidence level of 99% *Significance in the confidence level of 95%
Table 6. Modified reachability matrix
Corporate
Culture Symbolism Innovation characteristic Communication Behavior
Behavior 1* 1* 1* 1 0 1
Communication 0 0 0 0 1 1
Corporate characteristic 1 1 1 1 1 0
Innovation 0 0 1 0 0 0
Symbolism 0 1 0 0 1 1
Table 7. Sets of reachability, antecedent and common
Variablenumber Variable Reachability Antecedent Common
1 Behavior 1,2,3,4,6 1,2,5,6 1,2,6
2 Communication 5,6 2,3,5,6 5,6 First level
3 Corporate characteristic 1,2,3,4,5, 1,3 3,1
4 Innovation 3 1,3,4,6 3 First level
5 Symbolism 2,5,6 1,3,5,6 5,6
6 Culture 1,2,3,5,6 1,3,6 1,3,6
Table 8. Classifying the variables with using interpretive structural modeling
Variable number 1 2 3 4 5 65 6
Variable Behavior Communication Corporate characteristic Innovation Symbolism Culture
Level Fourth First Third First Second Third
The final group is the key variables. They are not that much dependent but they can guide the system more effectively. Corporate characteristic and culture are examples of key variables. Of course, the variable of behavior has a very little difference with these two variables (Corporate characteristic and culture) and as a result, it goes to linking variables. Key variables have a significant importance in improving the system condition.
2. CONCLUSION
Hypothesis testing of this study represented that primary conceptual model of the study could determine the way that identity mix can construct the brand equity and perceived quality. However, evaluating the effect of identity on corporate reputation, effect of identity on perceived quality, effect of identity on brand equity, effect of corporate image on brand equity and effect of corporate reputation on brand equity, as included in
Table 5, indicates that the primary model of the study needs some modifications. In other words, making modifications and proposing some tips means that all effects are significant of statistic “t” in the confidence level of 99%. As a result, the optimized model for this study will be the same as you can see in the Fig. 2.
Thus, new assumptions of this study, included in
Table 5, have been added to the previous ones and studies confirm that none of them will be rejected. So, the corporate identity mix can have a positive and direct effect on the perceived quality, brand equity, corporate image and corporate reputation. Moreover, corporate image and corporate reputation affect the brand equity directly.
On the other hand, with using the interpretive structural equations technique, we level the identity mix variables, in order to determine the way these variables affects each other. MICMAC analysis indicates that variables of characteristic and culture have a key role in
structuring the corporate identity. So, for improving the system we should consider them much more.
For doing the studies in the future, we recommend you to apply the fuzzy interpretive structural equations technique, in order to determine the levels of variables. Using fuzzy MICMAC analysis and also, a combination of these techniques with other ranking techniques will be of use. Examining the way that brand equity affects the customer loyalty and determining the differences of these effects will be striking. On the other hand, studying the effects of green management on brand equity will be helpful, too.
3. REFERENCES
Aaker, D.A., 1996. Building Strong Brands. 1st Edn., Free Press, New York, ISBN-10: 002900151X, pp: 380.
Aaker, D.A., 2004. Brand Portfolio Strategy: Creating Relevance, Differentiation, Energy, Leverage and Clarity. 1st Edn., Free Press, New York, ISBN-10: 0743249380, pp: 368.
Balmer, J.M.T., 2008. Identity based views of the corporation, Insights from corporate identity, organizational identity, social identity visual identity, corporate brand identity and corporate image. Eur. J. Market., 42: 879-906. DOI: 10.1108/03090560810891055
Balmer, J.M.T., 2011. Corporate marketing myopia and the inexorable rise of a corporate marketing logic. Eur. J. Market., 45: 1329-1352. DOI: 10.1108/03090561111151781
Bartholme, R.H. and T.C. Melewar, 2011. Remodeling the corporate visual identity construct a reference to the sensory and auditory dimension. Corporate
Commun. Int. J., 16: 53-64. DOI:
Bolanos, R., E. Fontela, A. Nenclares and P. Paster, 2005. Using interpretive structural modeling in strategic decision making groups. Manage. Decision, 43: 877-895. DOI:10.1108/00251740510603619 Buil, I., L. Chernatony and E. Martinez, 2013.
Examining the role of advertising and sales promotions in brand equity creation. J. Bus. Res., 66: 115-122. DOI:10.1016/j.jbusres.2011.07.030 Cornelissen, J.P., S.A. Haslam and M.T. Balmer, 2007.
Social Identity, organizational identity and corporate identity: Towards an integrated understanding of processes, patternings and products. Br. J. Manage.,
18: S1-S16. DOI:
10.1111/j.1467-8551.2007.00522.x
Eok, K and L. Chang-Young, 2004. Corporate identity through product design applied with brand management system. KAIST Depart. Indus. Design Digital Media Contents Lab.
Farzianpour, F., J. Khaniki, F. Batebi and M. Younesian, 2012. Compare the effects of two educational methods on the health principles knowledge of employees in food preparation. Am. J. Applied Sci., 9: 1678-1683. DOI:10.3844/ajassp.2012.1678.1683 Farzianpour, F., J. Khaniki, M. Younesian, M. Sadeghi
and S.H. Hosseini, 2013a. Evaluation of food color consumption and determining color type by thin layer chromatography. Am. J. Applied Sci., 10: 172-178. DOI:10.3844/ajassp.2013.172.178
Farzianpour, F., S. Hosseini, A. Mirsepasi, H. Honary and S.S. Hosseini, 2013b. Internal evaluation of the department of environmental health science and engineering. Am. J. Applied Sci., 10: 58-63. DOI: 10.3844/ajassp.2013.58.63
Farzianpour, F., M. Pishdar, M.D. Shakib, S. Hashemi and M.R. Toloun, 2014. Consumers’ perceived risk and its effect on adoption of online banking services. Am. J. Applied Sci., 11: 47-56. DOI: 10.3844/ajassp.2014.47.56
Hamidi, N., M. Pezeshki Pouya and A. Moradian, 2010. Weighting the criteria of brand selecting in beverage industries in Iran. Asian J. Manage. Res.
Hatch, M.J. and D. Yanow, 2006. Methodology by metaphor: Painting and the study of organizational identity. Proceedings of the 22nd EGOS Colloqium, (EGOS’ 06), Bergen.
Hildebrand, D. and S. Sen, 2011. Corporate social responsibility: A corporate marketing perspective. Eur. J. Market., 45: 1353-1364. DOI: 10.1108/03090561111151790
Keller, K.L., 1993. Conceptualizing, measuring and managing customer-based brand equity. J. Market., 57: 1-22. DOI:10.2307/1252054
Leitch, S and S. Davenport, 2011. Corporate identity as an enabler and constraint on the pursuit of corporate objectives. Eur. J. Market., 45: 1501-1520. DOI: 10.1108/03090561111151862
Mathiyazhagan, K., K. Govindan, A. NoorulHaq and Y. Geng, 2013. An ISM approach for the barrier analysis in implementing green supply chain management. J. Cleaner Product., 47: 283-297. DOI: 10.1016/j.jclepro.2012.10.042
Oberg, C., C. Grundstrom and P. Jonsson, 2010. Acquisitions and network identity change. Eur. J.
Market., 45: 1470-1500. DOI:
10.1108/03090561111151853
Powell, S.M., 2011. The nexus between ethical corporate marketing, ethical corporate identity and corporate social responsibility-An internal organizational perspective. Eur. J. Market., 45: 1365-1379. DOI: 10.1108/03090561111151808
Punjaisri, K and A. Wilson, 2011. Internal branding process: Key mechanisms, outcomes and moderating factors. Eur. J. Market., 45: 1521-1537. DOI:10.1108/03090561111151871
Rodrigues, S. and J. Child, 2008. The development of corporate identity: A political perspective. J. Manage. Stud., 45: 5. DOI: 10.1111/j.1467-6486.2007.00750.x
Shamma, H.M. and S.H. Salah, 2011. Integrating product and corporate brand equity into total brand equity measurement. Int. J. Market. Stud., 3: 11-20. Swoboda, B., B. Berg and H. Schramm-Klein, 2013.
Reciprocal effects of the corporate reputation and store equity of retailers. J. Retail., 89:447-459. DOI: 10.1016/j.jretai.2013.06.006
Van, R. and J. Balmer, 1997. Corporate identity: The concept, its measurement and management. Eur. J. Market., 31: 340-355. DOI:10.1108/eb060635 Van, R., B.M. Cees and B.A. Van Den, 2001. The added
value of corporate logos-an empirical study. Eur. J.
Market., 35: 428-44. DOI: