© 2015 by the Serbian Psychological Association 159.9.072 DOI: 10.2298/PSI1504345M
Person-fit statistics, response sets and survey
participation in a population-based cohort study
4Jörg M. Müller1, Petra Hasselbach2, Adrian Loerbroks3,
and Manfred Amelang2
1Department of Child and Adolescent Psychiatry,
University Hospital Münster, Germany
2Department of Psychology, University of Heidelberg, Germany 3 Institute of Occupational and Social Medicine, Centre for Health and Society,
Faculty of Medicine, University of Düsseldorf, Düsseldorf, Germany
Person-fit methodology is a promising technique for identifying subjects whose test scores have questionable validity. Less is known however about this technique’s ability to predict survey participation longitudinally. This study presents theory-derived expectations related to social desirability, the tendency for extreme responding and traitedness for specific deviating answer patterns and an expected consistence of person-fit scores across 27 personality scales. Data from 5,114 subjects (Amelang, 1997) were reanalysed with a polytomous-Rasch model to estimate scale scores and von Davier and Molenaar’s (2003) person-fit statistics. The person-fit statistics of the 27 scales were examined together with the 27 person parameter scores in one common factor analysis. The person-fit scores served as indicators of the latent factor ‘scalability’ while the person-parameter scores were considered to index the bias introduced by social desirability. The sign of factor loadings showed consistency and validity of the tendency for social desirability and extreme responding. Moreover, the person-fit-based subject classification derived from the baseline data was able to predict subjects’ participation at a 8,5-year follow-up. However, the nature of those associations was contrary to our predictions. The discussion addresses explanations and practical implications, but also the limitations pertaining to the identification and interpretation of person-fit scores.
Keywords: Person-Fit, Social desirability, Extreme responding, Cancer, Heart disease,
Non-response, Response Set, Response Style.
Survey Participation
Low rates of survey participation, in particular in longitudinal research, can hamper the description of population characteristics and constrain a study’s validity (Groves & Peytcheva, 2008; Manfreda, Berzelak, Vehovar, Bosnjak, & Haas, 2008). Research has developed models to explain subjects’ participation in cross-sectional studies (i.e. at baseline of a cohort study; Galea & Tracy, 2007; Krellman et al, 2014). It is of interest however to also predict subjects’
participation longitudinally, that is, using their baseline data to estimate their individual likelihood for participation along with reasons for non-response at follow-up (see, e.g., Hawkley, Kocherginsky, Wong, Kim, & Cagney, 2014; Lange et al., 2014). Subjects who are at increased risk to refuse participation at follow-up assessments, e.g. due to low motivation, may be offered additional compensation (see, e.g., Marcus, Bosnjak, Lindner, Pilischenko, & Schütz, 2007) to reduce their likelihood of dropping-out and biasing the sample composition (see Bosnjak et al., 2013). However, research has not yet determined which approaches are able to predict future non-response.
Person-fit Methodology
Item response theory (IRT) represents an approach to detect deviating response patterns that may contribute to invalid test scores (Meijer & Sijtsma, 2001). In particular, person-fit statistics have demonstrated their ability in this regard (Ponocny & Klauer, 2002). Alternatively, inconsistent answers can be detected by the common approach of so-called validity scales, e.g. based on the repeated presentation of identical questions. However, person-fit statistics have several advantages in comparison to validity scales. First, they use actual responses for the analysis and thus do not require additional measurement thereby contribution to efficient data collection. Second, most person-fit statistics have a strong mathematical background, which allows for the reporting of the probability of each test score assuming a model conform answer process and a cut-off criterion. A broad variety of person-fit statistics (Reise, 1990; Reise & Due, 1991) has been developed to detect deviating answer patterns and has been compared in Monte-Carlo-Studies (e.g., Drasgow, Levine, & McLaughlin, 1987; Karabatsos, 2003; Levine & Drasgow, 1982). For example, Meijer and Sijtsma (2001) described more than forty person-fit statistics which are empirically validated with simulated data sets. Simulated data have the advantage that they allow for full control of valid and deviating responses. This property strengthens those studies’ internal validity but at the same time restricts external validity compared to the analysis of real data. Moreover, the majority of simulation studies examined invalid response related to maximum performance, e.g. logical reasoning, such as cheating, careless responding, lucky guessing, creative responding, and random responding (see Meijer, 1996a, 1996b in Karabatsos, 2003). By contrast, typical performance, as captured by for instance personality trait questionnaires, remains poorly researched and understood. A particular challenge for studies seeking to examine person-fit statistics based on personality data is the prerequisite that a-priori theory-based assumptions need to be made
and number of items. Research related to the application of person-fit statistics to real data has been growing (see, e.g., Allik et al., 2012), but remains limited at current. We therefore aimed to address this research gap. Specifically we aimed to examine person-fit statistics’ ability to predict subjects’ participation longitudinally. Doing so, we sought to examine first if and to what extent social desirability and unmotivated responding styles can be identified on a given set of questionnaires by a given person-fit statistic (see below). Second, we aimed to test whether that identification can be replicated across 27 scales. Third, we sought to validate the hypothesized invalid response processes by predicting ongoing participation in longitudinal research. Doing so, we used an aggregated person-fit score to overcome the limitations associated with a single person-fit score (see below).
Response sets and the person-fit statistic
Reise and Flannery (1996) provide three primary causes of deviating response behavior on personality tests: faking good, unmotivated responding and traitedness. Next, we will discuss each potential cause to understand how each may contribute to deviating response patterns and to what extent each may or may not systematically produce positive or negative person-fit scores, as indexed by von Davier and Molenaar’s (2003) person-fit statistic.
Subjects who have a faking good or socially desirable response set (Furnham, 1986) are more likely to agree with items that have desirable content than other respondents. This is the logic behind social desirability questionnaires (Crowne & Marlowe, 1964): asking for rarely observed, but socially desirable behavior to more clearly demonstrate this tendency. In test theoretical terms a subject with a tendency to appear socially desirable will more often agree with difficult items than expected. Given the increased test scores that are caused by a propensity to express stronger agreement with socially desirable items, a subject will not agree to items that have a negative socially desirable connotation, as expected by the measurement model. Theref ore, a given subject with a socially desirable response set will have an anti-Guttman response pattern. When this response pattern is simulated, the von Davier and Molenaar’s (2003) person-fit statistic is negative.
The effect of unmotivated responding on the specified responses is less straightforward: some believe that unmotivated subjects will make mistakes when reading the questions, while others believe that acquiescence is an indicator of being unmotivated. In this paper, we will assume that a mild form of unmotivated responding results in a yes/no response algorithm replacing a graded response in order to complete a long questionnaire quickly, which increases the likelihood for extreme responding. The tendency for extreme responding is descriptively defined as avoiding a rating scale’s middle categories and selecting extreme ratings more often than expected by the measurement model. This response style shows a perfect-Guttman pattern and simulated response patterns show a
Both social desirability and extreme responding are considered to consistently influence responses across questionnaires (Furnham, 2001). Traitedness is assumed to produce an inconsistent answer pattern or random answers that can result in positive or negative person-fit scores and will not lead to correlated person-fit scores across personality scales. Thus, this cause of aberrant answer process is no more of interest.
Attempting to predict survey participation, we believe that the Social Desirability response group has a need for affiliation or approval (Crowne &
Marlowe, 1964) and will show a higher motivation to follow the test instructions to conscientiously complete the questionnaires. Moreover these subjects will also be more likely to agree to repeated survey participation in the future. By contrast, those with an Extreme Response pattern may have wanted to complete
long questionnaire quickly. Those subjects, who have low motivation, may likewise not be interested in completing the questionnaires again and may thus decline further involvement in research.
Planned Analysis
The analyses were conducted in three steps. First, each scale from a questionnaire (see below) was analyzed to estimate the person parameter and person-fit score. Data were analyzed with the WinMira2001 1.45 (von Davier, 1998) software package with a polytomous-Rasch model (provided in conditional form in equation 1)
(1)
where αix are the cumulative threshold parameters (compare Andrich, 1982); x = (x1,…,xk)'{0,...,m}k and r = ∑x
i are the raw response pattern scores;
and x = (x1,…,xk). γr is the symmetric function of order r, which is the sum
of all possible products of r (see Molenaar & Hoijtink, 1990). The person-fit
statistic in WINMIRA is based on von Davier and Molenaar (2003; Equation 2) and extends the M-index by Molenaar and Hoijtink (1990), which previously performed well in identifying aberrant answer patterns (Karabatsos, 2003).
(2)
The person-fit statistic is normally distributed and, therefore, directly estimates the probability of a response pattern. As noted above, a negative person-fit was considered to indicate a socially desirable response set and a positive person-fit was assumed to reflect an extreme response style. We will start by report the percentages of identified deviating answer patterns by scale by their statistical significance. Furthermore, we will employ an aggregated person-fit score rather than the statistical significance of the person-fit score to identify an aberrant answer pattern because utilization of a cut-off criterion
r k i ixi
r x X P
J D
¦
1exp
r k
i x i r
cRM
i
L ( )
D
lnJ
based on significance level may be biased by instrument characteristics (e.g., the test length or the response format of the questionnaire, see below).
Second, we will examine if and to what extent person parameters have been biased by social desirability and by an extreme response set across several questionnaires. Social desirability bias should be expected to make up one single factor in a common factor analysis for the 27 scale scores (Paulhus, 1981). The sign of the factor loadings should be in agreement with their socially desirable contents. Therefore and prior to the factor analysis, each scale from the questionnaire was evaluated by the author for socially desirable contents (a ‘+’ was provided for socially desirable; ‘-‘ was provided for socially undesirable contents; and ‘+/-‘ when the content was ambivalent). Additionally, we included also all 27 person-fit scores in the common factor analysis. We expect that the 27 person-fit scores cluster into a second factor if there is at least one invalid answer process leading to consistently deviating response behavior across the employed scales. We conducted the common factor analysis for a total of (2*27=) 54 indicators with the restriction to two factors, but not a confirmatory factor analysis because our context is different from that of test development. In traditional test developing processes, factor loadings >.30 are usually expected; thus any bias may lead to factor loadings < .30. Moreover, as highlighted below, the test length and response format may lead to low-reliability person-fit scores which may likewise result in factor loadings <.30. As a consequence, the interpretation of findings from our common factor analysis should in particular build on the algebraic sign of the factor loadings (as expected based on our hypotheses) rather than on the strengths of those loadings. Likewise, the explained variance by both factor and model fit are of secondary interest. However we will report the amount of explained variances to estimate how ‘biased’ the answers in the original study have been. Notably, the main interest here is to test the consistency of person parameter score and person-fit score and not to develop a homogeny measurement instrument. Nevertheless, both retained factors need further validation in the final step.
Finally, we will construct three groups based on the person-fit scores, that is, a Normal response group, a Social Desirabilityresponse group and an Extreme Response group. The group size for the latter groups was set by an arbitrary
Applying person-fit statistics to real data
Some general and some specific challenges are inherently related to the application of person-fit statistics to real data. Application of a person-fit statistic requires that the model’s basic assumption holds true; however, the identification of deviating answer patterns in the data implies that the model’s assumption that the observed answer pattern fit the models prediction is explicitly violated. In consequence, the data set is a ‘contaminated sample’ (Glas & Meijer, 2003; Reise, 1995). In addition to this logical paradox, simulation studies provide evidence (Hendrawan, Glas, & Meijer, 2005; Molenaar & Hoijtink, 1990; Levine & Drasgow, 1982) that inclusion of a smaller number of aberrant answer patterns that do not exceed a critical level of 25% (see Karabatsos, 2003) barely affects misclassification of simulated aberrant answer patterns. Therefore, to address the above-mentioned paradox, we will control for the number of aberrant answer patterns in our data. Furthermore, simulation studies (see St-Onge, Valois, Abdous, & Germain, 2011) have demonstrated that test length increases the chance for detecting aberrant answer patterns due to increasing statistical power (of the number of comparisons between expected and observed answers). Similarly, the number of rating scale categories increases the number of comparisons from model prediction and empirical observations. We address these influences by classifying subjects into response set groups.
Methods
Sample
Data were drawn from the HEIDE study, which is a longitudinal cohort study primarily aiming to identify determinants (e.g. personality traits) of ill-health and chronic disease (Loerbroks, Apfelbacher, Thayer, Debling, & Stürmer, 2009; Stürmer, Hasselbach, & Amelang, 2006). The first wave (baseline) comprised a population-based sample of 5,114 men and women, who were aged between 40 and 65 years and lived in a defined region in Southwest Germany (i.e. the city of Heidelberg and surrounding communities). About 8.5 years later, baseline respondents were approached for participation in a second wave (follow-up). The original baseline sample was reduced from 5114 to 4857 individuals at follow-up because 257 participants had died between both assessments. In total, 83.4% of the baseline respondents participated at follow-up and 16.6% did not respond.
Personality questionnaires
of Life Scale (WOL), and Work and Social Satisfaction in different areas (ZUF). The complete test battery contained 443 items. Table 1 shows the number of items, the relative position of the scales in the test battery and Cronbach’s alpha. The items from the first 13 questionnaires were administered in a mixed sequence. The test battery contains short tests (e.g., eight items for AI) and long tests (31 items for TYP5). The internal consistencies show variability in reliability, from poor (rtt = .56 LOT) to adequate (rtt = .92 for TYP2), with most tests having satisfactory internal consistency.
Table 1
Basic test attributes (answer format, number of items, position in the test battery and Cronbach’s alpha) for 27 personality scales
Scale alternativesAnswer Position Number of Items Cronbach’s Alpha
A NC 7 6 11 .78
ANM 7 6 10 .78
ANT 7 6 8 .82
BDR 2 7 13 .63
DEPR 4 5 9 .87
EXT 2 9 8 .68
KEND 5 1 16 .80
KOE 5 1 20 .80
KOEH 5 1 24 .82
LE 2 11 12 .62
LIE 2 9 9 .57
LOT 5 1 12 .56
NEU 2 9 24 .85
PSY 2 8 8 .68
AC 4 2 11 .82
AI 4 2 8 .83
AO 4 2 8 .82
SOZ 5 3 22 .91
TYP1 5 1 8 .90
TYP2 5 1 27 .92
TYP3 5 1 25 .83
TYP4 5 1 20 .89
TYP5 5 1 31 .91
TYP6 5 1 23 .77
TUP 5 1 10 .65
WOL 2 10 9 .77
ZUF 7 . 11 .77
IRT Analyses
Results
The basic descriptive statistics (means and standard deviations) for each scale are provided in Table 2 for the scale scores (person parameters) and for the person-fit scores. Notably, the expected value for the person-fit scores’ standard deviation is one. Most scales had a standard deviation that was higher than one. This can be interpreted as an initial indication of aberrant answer patterns in the data. Additionally, Table 2 presents the frequencies of the aberrant answer patterns (defined by +/- 1.96) to demonstrate the varying percentages of aberrant answer patterns in the scales. Moreover, we examined if and to what extent the standard deviation of the person-fit score in Table 2 correlated with the number of items multiplied by the number of answer categories across the 27 personality scales, which is r = .66 (p<.001).
Table 2
Basic descriptive statistics (mean, standard deviation) on the scale and person-fit scores for 27 personality scales
Person Parameter Person Fit significant aberrancyPercentage of Scale Mean Std Mean Std Negative Normal Positive
ANC 0.41 0.61 0.11 1.45 8.21 85.37 6.41
ANM 0.57 0.69 0.08 1.38 7.67 85.72 6.61
ANT 0.98 0.98 0.12 1.42 7.92 86.84 5.24
BDR -0.32 1.09 0.02 0.98 2.09 96.15 1.76
DEPR -2.00 1.13 0.09 1.11 4.18 93.78 2.03
EXT -0.23 0.89 0.03 1.13 4.83 92.22 2.95
KEND 0.61 0.73 0.04 1.39 8.99 85.10 5.91
KOE 0.35 0.43 0.02 1.43 8.82 84.53 6.65
KOH 0.47 0.55 0.04 1.42 8.76 84.90 6.34
LE -1.45 1.15 0.04 0.99 2.82 96.81 0.37
LIE -0.12 1.20 0.03 1.18 3.52 91.47 5.01
LOT 0.40 0.51 0.03 1.19 5.77 90.26 3.97
NEU -0.89 1.30 0.02 1.00 2.44 95.68 1.88
PSY -2.72 1.00 -0.02 1.02 2.64 97.07 0.29
AC 0.89 1.33 0.06 1.29 6.63 89.13 4.24
AI -0.95 1.24 0.04 1.32 6.82 89.97 3.21
AO -2.11 1.61 0.01 1.21 5.48 93.80 0.72
SOZ 1.45 1.09 0.10 1.44 8.10 85.06 6.84
T1 -0.22 0.58 0.02 1.58 11.18 80.19 8.62
T2 -0.40 0.75 0.00 1.63 12.18 79.14 8.68
T3 -0.61 0.55 0.01 1.27 6.34 88.68 4.99
T4 0.66 0.62 -0.02 2.20 18.89 62.37 18.74
T5 0.20 0.73 0.06 1.79 13.41 73.33 13.26
T6 -0.97 0.69 0.04 1.10 3.62 93.62 2.76
TUP -0.27 0.40 0.01 1.09 3.25 93.57 3.19
WOL -0.75 1.10 0.04 1.16 4.17 91.89 3.95
ZUF 1.01 0.99 0.02 1.21 5.32 90.52 4.17
Intra-personal stability of providing deviating responses?
To examine whether the same subjects consistently produced aberrant answer patterns, the 27 person-fit scores and the 27 scale scores were included in a common factor analysis assuming two factors. The number of retained factors was supported by the slope of eigenvalues (9.24; 5.78; 2.75; 2.33; 1.62) from the principal component analysis, which was inspected by Proc Factor in the SAS software package prior to any common factor analysis. Table 3 shows the factor loadings from a two-factor solution with a promax (oblique) rotation, which allow a covariation between the factors, which is r = .01.
Table 3
Factor loadings of the person parameter and person-fit scores for the 27 personality questionnaires
Social Desirability Variable Factor 1 Factor 2
+ ANCPP .65
+ ANMPP .58
+ ANTPP .62 -.16
- BDRPP -.62
- DEPRPP -.69
+ EXTPP .15
+ KENDPP .78
+ KOEPP .80
+ KOHPP .82
+/- LEPP
+ LIEPP .27 -.21
+ LOTPP .63
- NEUPP -.70
- PSYPP -.19 -.23
+ ACPP .39
- AIPP -.55
- AOPP -.45
+ SOZPP .57
- T1PP -.67
- T2PP -.79
- T3PP -.63
+ T4PP .75
+/- T5PP -.26
- T6PP -.53
- TUPPP -.35
- WOLPP -.15
+ ZUFPP .48
(continued) Person-Fit
score Factor 1 Factor 2
ANCPF .56
ANMPF .41
ANTPF .50
BDRPF .20
DEPRPF .22 .27
EXTPF .39 .21
KENDPF .73
KOEPF .69
KOHPF .77
LEPF LIEPF
LOTPF .54
NEUPF
PSYPF .15
ACPF .37
AIPF .35
AOPF .24
SOZPF .34
T1PF .67
T2PF .63
T3PF .46
T4PF .75
T5PF .66
T6PF .18
TUPPF .21
WOL
ZUF .21
Note. Person parameter is abbrivate with PP. Person-Fit score is
abbreviated with PF. + for socially desirable, - for socially undesirable contents and +/- for ambivalent; Factor loadings below .15 are not shown.
We suggest that Factor 1 represents the common variance factor which we label according to the interpretation of Paulhus (Paulhus, 1981) social desirability.
For the second factor, 20 out of 27 indicators displayed factor loadings of person-fit scores within the expected magnitude (i.e., ≥.15). On the first factor, four out of five person-fit scores showed a side loading but were below .25 and in only one instance (Extraversion) we observe a considerable side loading of .39. In summary, the majority of factor loading were in the expected direction. Taken together the factor loading constitute the second factor with an explained variance of 10.8%. We label this factor the scalability factor.
Predicting participation rate
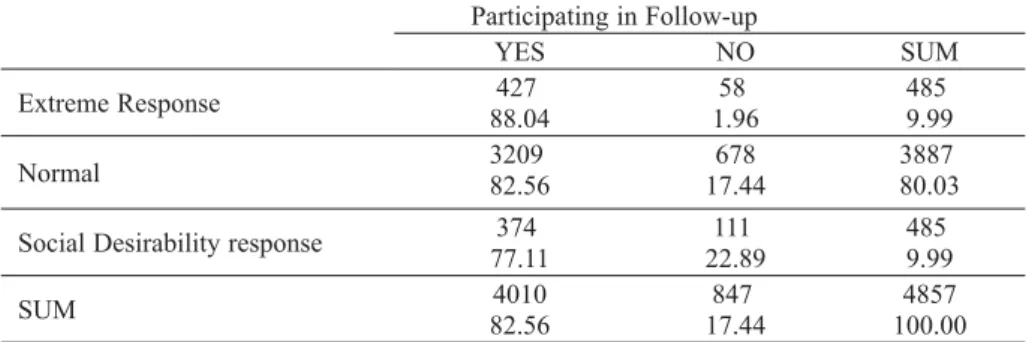
Table 4 depicts the frequencies of the ongoing participation at follow-up for the Normal response, the Social Desirability response and an Extreme Response group.
Table 4
Prediction of participation at follow-up based on person-fit scores from 27 personality scale to build three groups (Normal, Extreme Response, Social Desirability response). The cells report frequencies and percentages per row while marginal row and column report cumulative frequencies and percentages.
Participating in Follow-up
YES NO SUM
Extreme Response 88.04427 1.9658 4859.99
Normal 320982.56 17.44678 388780.03
Social Desirability response 77.11374 22.89111 4859.99
SUM 82.564010 17.44847 100.004857
The observed frequencies in Table 4 significantly deviate from the expected frequencies (Chi²= 20.11; df= 2; p < .0001). Unexpectedly, the social
desirability group had a significantly lower participation rate compared to the normal responding group (Chi²= 8.64; df= 1; p < .01): the odds ratio (OR) for
dropping out at follow-up in that groups compared to the normal group was 1.55. Further, the extreme response group had a significantly higher participation rate compared to the normal responding group (Chi²= 9.26; df= 1; p < .01): and OR
for dropping out compared the normal group was 0.71.
Discussion
Most studies in the context of person-firt statistics have been conducted with simulated data. Such data offer the opportunity to report detection rates of invalid answer patterns based on full control of the invalid and valid answer process. By contrast, the analysis of real data is more challenging: the researcher first needs to assume that the majority of answer patterns represent the valid answer process, but, second, that a specific part of the data resulted from invalid answer patterns. Additionally, it cannot be ruled out that more than one answer process was adopted by the participants. We focused therefore on two prominent response sets (Reise & Flannery, 1996) which can be detected by a person-fit statistics. For our context and to apply the approach, we needed to postulate a-priori hypotheses related to the invalid this answer process and
to how those influence the test score by ‘typical’ answer patterns. Additionally, these answer patterns should be detectable by our specific person-fit statistic in our study’s context, e.g. the number of items presented and the type and content of the administered questionnaires. Within our applied methodology to examine person-fit statistics we collected evidence about systematic reasons for increased or decreased person-fit scores across a number of questionnaires, which was demonstrated by a Cronbach’s alpha of r = .82. This consistency was to some extent surprising because the administered questionnaires had not been developed in an IRT framework. We interpreted the person-fit scores based on the baseline data by their sign of factor loading in a common factor analysis. This analysis demonstrated that 17.0% of the variance of person parameters can be attributed to social desirability bias. However, we also observed considerable variance of the person-fit statistics across the scales, which we attribute to scale-specific attributes like test lengths or the answer format. These scale-scale-specific characteristics hampered our ability to construct responding groups based on the significance level of the person-fit statistic to predict the ongoing participation. As a consequence, we needed to create groups based on distribution-based and thus arbitrary cut-offs, that is the upper and lower 10% of each distribution.
Practical implications
Our study has a number of practical implications. The person-fit score is arbitrarily scaled (personal communication with von Davier from 2nd February,
2004) and alternative software packages, like Bigsteps, Bilog-MG, Multilog, Parscale, Testfact (see du Toit, 2003) suggest different person-fit statistics and may reverse the sign the person-fit score related to simulated alternative answer process. Secondly, we considered in our study the person-fit score and the related significance test of a single scale as relatively unreliable, because the percentage of identified aberrant answer pattern varied considerably between the scales (see Table 2). Also the factor loadings in Table 3 suggest that a single person-fit score is not only influenced by a systematic response, but also by other determinants, which make an interpretation of a single response pattern difficult. Moreover our results suggest that in real data more than one alternative invalid answer process may affect the data when numerous questionnaires are administered to participants. Thus, it seems challenging to identify reliable an aberrant answer pattern based on a single scale score by our applied person-fit statistic. We therefore recommend aggregating person-fit score across scales or to build person-fit scores on a sufficient number of items (see St-Onge et al, 2011).
Limitations and further research
Analyses and interpretation of real data with person-fit statistics are additionally constrained by specific study contexts. First, in our study a great number of questionnaires had been administered at baseline. This may partially have contributed to invalid answer processes and this may be less problematic in studies with less extensive assessments. Second, the internal consistency of the questionnaires may influence the reliability of the person fit score as well as test length or the number of answer categories (see Table 1). However, the proportion of aberrant answer patterns in Table 2 remained below the acceptable limit of 25% (Karabatsos, 2003).
The interpretation of person-fit score in a real data context is associated with many uncertainties compared to simulation studies, because we are unable control the number of involved invalid response process. In our study, we assumed two invalid response processes; and, as acknowledged above, some readers may have expected additional or alternative invalid response process. Moreover, we needed to develop an explicit answer pattern related to both assumed response processes and some readers may have dervided alternative answer pattern, e.g. that unmotivated responding results in consistent use of any response category (which may be the middle answer category). These considerations highlight an actual missing link between the predictions of distinct response pattern for real items by an assumed invalid response process. This may be unproblematic in a simulation study with a known explicit alternative answer process, but this does not hold true for real data. For example, we needed to evaluate our scales with respect to their social desirability and we cannot rule out that some readers had arrived at different evaluations. Finally, the interpretation of our person-fit groups especially by an a priori decision needs further validation. This can be conducted as mentioned above in further studies by applying Mixed Rasch Models (Rost, 1990, 1991; von Davier & Rost, 1995).
References
Allik, J., Realo, A., Mõttus, R., Borkenau, P., Kuppens, P., & Hřebíčková, M. (2012). Person-fit to the Five Factor Model of personality. Swiss Journal of Psychology, 71(1), 35-45.
doi:10.1024/1421-0185/a000066
Amelang, M. (1997). Using Personality Variables to predict cancer and heart disease.
European Journal of Personality, 11, 319-342.
Andrich, D. (1982). An extension of the Rasch model for ratings providing both location and dispersion parameters. Psychometrika, 47, 105-113.
Austin, E. J., Deary, I. J., & Egan, C. (2006). Individual differences in response scale use: Mixed Rasch modelling of response to NEO-FFI items. Personality and Individual Differences, 40, 1235-1245.
Bosnjak, M., Haas, I., Galesic, M., Kaczmirek, L., Bandilla, W., & Couper, M. P. (2013). Sample composition discrepancies in different stages of a probability-based online panel.
Field Methods, 25(4), 339-360. doi:10.1177/1525822X12472951
Crowne, D. P., & Marlowe, D. (1964). The approval motive: Studies in evaluative dependence.
New York: Wiley.
Curtis, D. D. (2004). Person misfit in attitude surveys: Influences, impacts and implications.
International Education Journal, 5, 125-143.
Danner, D., Aichholzer, J., & Rammstedt, B. (2015). Acquiescence in personality questionnaires: Relevance, domain specificity, and stability. Journal Of Research In Personality, 57, 119-130. doi:10.1016/j.jrp.2015.05.004
Drasgow, F., Levine, M. V., & McLaughlin, M. E. (1987). Detecting inappropriate test scores with optimal and practical appropriateness indices. Applied Psychological Measurement, 11(1), 59-79.
du Toit, M. (Ed.) (2003). IRT form SSI: BILOG-MG MULTILOG PARSCALE TESTFACT.
Lincolnwood. IL: Scientific Software International.
Furnham, A. (1986). Response bias, social desirability and dissimulation. Personality and Individual Differences, 7, 385-400.
Furnham, A. (2001). Test-taking style, personality traits, and psychometric validity. In J. M. Collis & S. Messick (Eds.), Intelligence and personality: Bridging the gap in theory and measurement . Mahwah, NJ: Erlbaum.
Galea, S., & Tracy, M. (2007). Participation rates in epidemiologic studies. Annals Of Epidemiology, 17(9), 643-653.
Glas, C. A. W., & Meijer, R. R. (2003). A bayesian approach to person fit analysis in item response theory models. Applied Psychological Measurement, 27, 217-233.
Groves, R. M., & Peytcheva, E. (2008). The impact of nonresponse rates on nonresponse bias a meta-analysis. Public Opinion Quarterly, 72(2), 167–189.
Handel, R. W., Ben-Porath, Y. S., Tellegen, A., & Archer, R. P. (2010). Psychometric functioning of the MMPI-2-RF VRIN-r and TRIN-r scales with varying degrees of randomness, acquiescence, and counter-acquiescence. Psychological Assessment, 22(1),
87-95. doi:10.1037/a0017061
Hawkley, L. C., Kocherginsky, M., Wong, J., Kim, J., & Cagney, K. A. (2014). Missing data in Wave 2 of NSHAP: prevalence, predictors, and recommended treatment. The Journals Of Gerontology. Series B, Psychological Sciences And Social Sciences, 69, S38-S50.
doi:10.1093/geronb/gbu044
Hendrawan, I., Glas, C. A. W., & Meijer, R. R. (2005). The effect of person misfit on classication decisions. Applied Psychological Measurement, 29, 26-44.
Karabatsos, G. (2003). Comparing the aberrant response detection performance of thirty-six person-fit statistics. Applied Measurement in Education, 16(4), 277-298.
Krellman, J. W., Kolakowsky-Hayner, S. A., Spielman, L., Dijkers, M., Hammond, F. M., Bogner, J., & ... Tsaousides, T. (2014). Predictors of follow-up completeness in longitudinal research on traumatic brain injury: findings from the National Institute on Disability and Rehabilitation Research traumatic brain injury model systems program. Archives of Physical Medicine and Rehabilitation, 95(4), 633-641. doi:10.1016/j.apmr.2013.10.016
Lange, M., Butschalowsky, H. G., Jentsch, F., Kuhnert, R., Schaffrath Rosario, A., Schlaud, M., & Kamtsiuris, P. (2014). [The first KiGGS follow-up (KiGGS Wave 1): study conduct, sample design, and response]. Bundesgesundheitsblatt, Gesundheitsforschung, Gesundheitsschutz, 57(7), 747-761. doi:10.1007/s00103-014-1973-9
Levine, M., & Drasgow, F. (1982). Appropriateness measurement: Review, critique, and validating studies. British Journal of Mathematical Statistical Psychology, 35, 42-56.
Loerbroks, A., Apfelbacher, C. J., Thayer, J. F., Debling, D., & Stürmer, T. (2009). Neuroticism, extraversion, stressful life events and asthma: a cohort study of middle-aged adults. Allergy, 64(10), 1444-1450. doi:10.1111/j.1398-9995.2009.02019.x
Marcus, B., Bosnjak, M., Lindner, S., Pilischenko, S., & Schütz, A. (2007). Compensating for low topic interest and long surveys: A field experiment on nonresponse in Web surveys.
Manfreda, K. L., Berzelak, J., Vehovar, V., Bosnjak, M., & Haas, I. (2008). Web surveys versus other survey modes: A meta-analysis comparing response rates. International Journal Of Market Research, 50(1), 79-104.
Meijer, R. R., Egberink, I. J. L., Emons, W. H. M., & Sijtsma, K. (2008). Detection and validation of unscalable item score patterns using item response theory: An illustration with Harter’s Self-Perception Profile for children. Journal of Personality Assessment, 90(3), 227-238.
Meijer, R. R., & Sijtsma, K. (2001). Methodology review: Evaluating person-fit. Applied Psychological Measurement, 25, 107-135.
Molenaar, I. W., & Hoijtink, H (1990). The many null distributions of person-fit indices.
Psychometrika, 55, 75-106.
Müller, J. M. (2006a). Probability of obtaining two statistically different test scores as a test index. Educational and Psychological Measurement, 66, 601-611.
Müller, J. M. (2006b). SAS macros to compute the test index PDTS. Applied Psychological Measurement, 30, 345-346.
Paulhus, D. L. (1981). Control of social desirability in personality inventories: Principle factor deletion. Journal of Research and Personality, 15, 383-388.
Ponocny, I., & Klauer, K. C. (2002). Towards identification of unscalable personality questionnaire respondents: The use of person fit indices. Psychologische Beiträge, 44,
94-107.
Reise, S. P. (1990). A comparison of item- and person-fit methods of assessing model-data fit in IRT. Applied Psychological Measurement, 14, 127-137.
Reise, S. P. (1995). Scoring Method and the detection of person misfit in a personality assessement context. Applied Psychological Measurement, 19(3), 213-229.
Reise, S. P., & Due, A. M. (1991). The influence of test characteristics on the detection of AAPs. Applied Psychological Measurement, 15, 217-226.
Reise, S. P., & Flannery, W. P. (1996). Assessing person-fit on measures of typical performance.
Applied Measurement in Education, 9(1), 9-26.
Reise, S. P., & Waller, N. G. (1993). Traitedness and the assessment of response pattern scalability. Journal of Personality and Social Psychology, 65(1), 143-151.
Revelle, W., & Zinbarg, R. E. (2009). Coefficients alpha, beta, omega, and the glb: Comments on Sijtsma. Psychometrika, 74(1), 145-154. doi:10.1007/s11336-008-9102-z
Rost, J. (1990). Rasch models in latent classes: An integration of two approaches to item analysis. Applied Psychological Measurement, 14, 271-282.
Rost, J. (1991). A logistic mixture distribution model for polychotomous item responses.
British Journal of Mathematical and Statistical Psychology, 44(1), 75-92.
St-Onge, C., Valois, P., Abdous, B., & Germain, S. (2011). Accuracy of person-fit statistics: A Monte Carlo study of the influence of aberrance rates. Applied Psychological Measurement, 35(6), 419-432. doi:10.1177/0146621610391777
Stürmer, T., Hasselbach, P., & Amelang, M. (2006). Personality, lifestyle, and risk of cardiovascular disease and cancer: Follow-up of population based cohort. BMJ: British Medical Journal, 332(7554), 1359. doi:10.1136/bmj.38833.479560.80
von Davier, M., & Rost, J. (1995). Polytomous mixed Rasch models. In G. H. Fischer & I. W. Molenaar (Eds.), Rasch models – Foundations, recent developments, and applications
(pp. 371-379). New York: Springer-Verlag.
von Davier, M. (1998). WINMIRA: A WINDOWS Program for mixed Rasch models. Kiel,
Germany: IPN.