from the Rotterdam Study: A Population-Based Cohort
Study
Michiel J. Bos1*, Peter J. Koudstaal2, Albert Hofman1, M. Arfan Ikram1,2,3
1Department of Epidemiology, Erasmus Medical Center, Rotterdam, The Netherlands,2Department of Neurology, Erasmus Medical Center, Rotterdam, The Netherlands, 3Department of Radiology, Erasmus Medical Center, Rotterdam, The Netherlands
Abstract
Background:Stroke prevention requires effective treatment of its causes. Many etiological factors for stroke have been identified, but the potential gain of effective intervention on these factors in terms of numbers of actually prevented strokes remains unclear because of the lack of data from cohort studies. We assessed the impact of currently known potentially modifiable etiological factors on the occurrence of stroke.
Methods and Findings:This population-based cohort study was based on 6,844 participants of the Rotterdam Study who were aged$55 y and free from stroke at baseline (1990–1993). We computed population attributable risks (PARs) for individual risk factors and for risk factors in combination to estimate the proportion of strokes that could theoretically be prevented by the elimination of etiological factors from the population. The mean age at baseline was 69.4 y (standard deviation 6.3 y). During follow-up (mean follow-up 12.9 y, standard deviation 6.3 y), 1,020 strokes occurred. The age- and sex-adjusted combined PAR of prehypertension/hypertension, smoking, diabetes mellitus, atrial fibrillation, coronary disease, and overweight/obesity was 0.51 (95% CI 0.41–0.62) for any stroke; hypertension and smoking were the most important etiological factors. C-reactive protein, fruit and vegetable consumption, and carotid intima-media thickness in combination raised the total PAR by 0.06. The PAR was 0.55 (95% CI 0.41–0.68) for ischemic stroke and 0.70 (95% CI 0.45– 0.87) for hemorrhagic stroke. The main limitations of our study are that our study population comprises almost exclusively Caucasians who live in a middle and high income area, and that risk factor awareness is higher in a study cohort than in the general population.
Conclusions:About half of all strokes are attributable to established causal and modifiable factors. This finding encourages not only intervention on established etiological factors, but also further study of less well established factors.
Please see later in the article for the Editors’ Summary.
Citation:Bos MJ, Koudstaal PJ, Hofman A, Ikram MA (2014) Modifiable Etiological Factors and the Burden of Stroke from the Rotterdam Study: A Population-Based Cohort Study. PLoS Med 11(4): e1001634. doi:10.1371/journal.pmed.1001634
Academic Editor:Suzanne C. Cannegieter, Leiden University Medical Center, Netherlands ReceivedNovember 7, 2013;AcceptedMarch 17, 2014;PublishedApril 29, 2014
Copyright:ß2014 Bos et al. This is an open-access article distributed under the terms of the Creative Commons Attribution License, which permits unrestricted use, distribution, and reproduction in any medium, provided the original author and source are credited.
Funding:The Rotterdam Study is supported by the Erasmus Medical Center Rotterdam, the Erasmus University Rotterdam, the Netherlands Organisation for Scientific Research (NWO), the Netherlands Organisation for Health Research and Development (ZonMw), the Research Institute for Diseases in the Elderly (RIDE), the Ministry of Education, Culture and Science, the Ministry of Health, Welfare and Sports, the European Commission (DG XII), and the Municipality of Rotterdam. The funders had no role in study design, data collection and analysis, decision to publish, or preparation of the manuscript.
Competing Interests:The authors have declared that no competing interests exist.
Abbreviations:BMI, body mass index; CABG, coronary artery bypass graft; HDL, high-density lipoprotein; IMT, intima-media thickness; PAR, population attributable risk; PTCA, percutaneous transluminal coronary angioplasty; TC, total cholesterol.
Introduction
In the 1960s it was discovered that treatment of high blood pressure reduces the occurrence of stroke among persons with severe diastolic hypertension by more than 90% [1]. The observation that a relatively simple intervention prevents such a devastating disease continues to inspire researchers to search for other potentially modifiable etiological factors for stroke up to the present day.
This search has led to the identification of many other risk factors for stroke, some of which merely mark the increased risk without playing a role in the causal pathway (risk indicators), and some of which are presumably causal (etiological factors, or causal risk factors) [2,3]. The impact of a causal risk factor on the burden of stroke is determined by the proportion of strokes in which the risk factor plays an indispensable role in the pathophysiological pathway, in other words, the proportion of strokes that would not have occurred had that risk factor not been present. This proportion is called the population attributable risk (PAR) [4]. A PAR indicates the maximum proportion of strokes that may be prevented by complete elimination of the risk factor, which is of course only relevant for etiological factors that can be modified. The PAR of an etiological factor depends on both the strength of the association between the etiological factor and the disease and on the prevalence of the risk factor.
Previously, PARs have been estimated for various individual etiological factors [3]. The proportion of strokes that can theoretically be prevented by optimal treatment of all known etiological factors for stroke cannot be calculated by simply adding up the adjusted PARs of the individual etiological factors: this will lead to an overestimation of the total PAR, and the total sum of the PARs may easily exceed 100%. To calculate a total PAR from multiple etiological factors, special statistical techniques need to be applied that allow a single case to be attributed to multiple etiological factors: as a rule, multiple (known and unknown) etiological factors need to be present for a stroke to occur, and adequate adjustment for confounding and interaction does not sufficiently correct for this [5]. To our knowledge, no previous cohort studies of stroke have reported the total PAR of multiple etiological factors combined. The reports that exist are either case–control studies [2,6,7] or did not use optimal statistical techniques [2]; all previous studies therefore likely overestimated the total PAR for stroke [4].
We were interested in finding out which proportion of strokes can theoretically be prevented by optimal treatment of all known etiological factors, and thereby how closely we have approached our ultimate goal of finding a modifiable cause for every occurring stroke. Therefore, we assessed the impact of potentially modifiable etiological factors on the occurrence of stroke in a large population-based cohort study among persons aged 55 y and over.
Methods
Ethics Statement
This study was approved by the Medical Ethics Committee of the Erasmus Medical Center. All participants gave written informed consent to participate in the study. Clinical investigations were conducted according to the principles expressed in the Declaration of Helsinki.
Study Population
The Rotterdam Study is an ongoing prospective population-based cohort study that focuses on the causes and consequences of
chronic and disabling diseases in the elderly [8]. The cohort started enrollment in 1990 and included 7,983 participants aged$ 55 y living in Ommoord, a district of the city of Rotterdam in the Netherlands (participation rate 78%).
Assessment of Stroke
Stroke was defined according to World Health Organization criteria as a syndrome of rapidly developing clinical signs of focal (or global) disturbance of cerebral function, with symptoms lasting 24 h or longer or leading to death, with no apparent origin other than vascular [9]. History of stroke at baseline was assessed during the baseline interview and verified by reviewing medical records. After enrollment, participants were continuously monitored for incident stroke through automated linkage of the study database with medical records from general practitioners. Nursing home physi-cians’ records and records from the general practitioners of participants who moved out of the district were checked on a regular basis as well. Additional information was obtained from hospital records. Potential strokes identified in medical records were reviewed by research physicians, and verified by an experienced stroke neurologist (P. J. K.) [10]. A stroke was subclassified as ischemic if a CT or MRI scan confirmed the diagnosis, or if indirect evidence (deficit limited to one limb or completely resolved within 72 h, atrial fibrillation in absence of anticoagulants) pointed at the stroke having an ischemic nature. A stroke was subclassified as hemorrhagic if a relevant hemorrhage was present on the CT or MRI scan. If we could not retrieve enough information to subclassify a stroke as hemorrhagic or ischemic, it was called unspecified. These classifications corresponded to ICD-10 codes I61, I63, and I64, respectively. Transient ischemic attacks or subarachnoid hemor-rhages were not included. Follow-up was complete until January 1, 2012, for 97.1% of potential person-years [11].
Selection and Measurement of Etiological Factors for Stroke
when seen on an electrocardiogram during the baseline research center visit or when it was reported in medical records. History of angina pectoris was assessed with the Rose questionnaire [12]. History of percutaneous transluminal coronary angioplasty (PTCA) or coronary artery bypass graft (CABG) and history of myocardial infarction were positive if reported by the participant and confirmed by electrocardiogram or medical records. Coro-nary disease was defined as history of angina pectoris, myocardial infarction, PTCA, or CABG. Total cholesterol (TC), high-density lipoprotein (HDL), and C-reactive protein were measured in non-fasting baseline serum with automated enzymatic procedures [13]. Carotid intima-media thickness (IMT) was measured by longitu-dinal 2-dimensional ultrasound of the carotid artery [14]. Alcohol intake and fruit and vegetable consumption were assessed by means of a food frequency questionnaire in participants who were not demented at baseline [15]. Excessive alcohol intake was defined as more than 3 units (32 g) of alcohol per day. Fruit and vegetable consumption was categorized as adequate (.5 fruit and/or vegetable servings per day), low (3–5 servings per day), or very low (,3 servings per day) (one serving of fruit was 80 g, and one serving of vegetables was 77 g).
Population for Analysis
Of all 7,983 participants who were enrolled into the Rotterdam Study, 7,717 were free from stroke at study baseline. After
exclusion of participants who refused informed consent for retrieval of stroke follow-up data (n= 171) and of those who had incomplete data collection (no baseline research center visit) (n= 702), 6,844 participants could be included in the present analyses.
C-reactive protein, alcohol intake, fruit and vegetable con-sumption, and carotid IMT were assessed only in random subgroups of the cohort [13,16]; alcohol intake and fruit and vegetable consumption were not assessed in participants with dementia at baseline [17]. Therefore, these factors were studied in combination in a subgroup of 3,570 participants who had complete assessment of all covariates.
Statistical Analysis
PARs and 95% CIs were calculated with the Interactive Risk Attributable Program (US National Cancer Institute) [18]. This program estimates the PAR adjusted for confounding by
PAR~1{XI
i~1
XJ
j~1rijR {1
iDj ð1Þ
where
RiDj~
Pr D~1DX~xi,C~cj
Pr D~1DX~x1,C~cj
ð2Þ
Table 1.Relationship between the etiological factors described in the 2011 American Heart Association/American Stroke Association guidelines [3] and the etiological factors used in our study.
Etiological Factors Described in the 2011 American Heart Association/American Stroke
Association Guidelines Etiological Factors in Our Study
Well-documented and modifiable risk factors
Hypertension Blood pressure and blood-pressure-lowering medication
Cigarette smoking Current and former light and heavy smoking
Diabetes Diabetes mellitus
Dyslipidemia TC/HDL ratio
Atrial fibrillation Atrial fibrillation
Other cardiac conditions Angina pectoris, CABG, PTCA, myocardial infarction
Asymptomatic carotid stenosis Carotid IMT (subcohort)
Sickle cell disease .97% Caucasians in our study population
Postmenopausal hormone therapy Rare in our study population (#1,3% at baseline)
Oral contraceptives All participants aged$55 y at baseline in our study
Diet and nutrition Fruit and vegetable consumption (subcohort)
Physical inactivity No data available
Obesity and body fat distribution BMI
Less well-documented or potentially modifiable risk factors
Migraine No data available
Metabolic syndrome No data available on additional components
Alcohol consumption 0 units and$3 units of alcohol compared to 1–2 units per day
(subcohort)
Drug abuse Rare in our study population
Sleep-disordered breathing No data available
Hyperhomocysteinemia No data available
Elevated lipoprotein(a) Data available only in limited subcohort
Hypercoagulability No data available
Inflammation and infection C-reactive protein quartiles (subcohort)
and
rij~Pr X~xi,C~cjDD~1
ð3Þ
withD= 1 denoting presence of disease,Xdenoting exposure with ilevels, andCdenoting a confounder withjlevels. The relative risk is estimated from a multivariable Poisson model [19,20].
The PAR for a combination of risk factors corresponds to the proportion of the disease that can be attributed to any of the studied risk factors. The combined PAR is not a simple summing up of the individual PARs. A disease case can simultaneously be attributed to more than one risk factor. As a result, the fraction of the case population that is attributed to or prevented by each risk factor overlaps with the fractions attributed to other risk factors. Hence, the combined PAR is usually lower than the sum of individual PARs. To estimate the proportion of the disease burden that is exclusively attributed to a specific risk factor, we calculated the combined PAR in the presence and absence of this risk factor. The difference is the ‘‘extra attributable risk,’’ which indicates the proportion of the disease that can be attributed exclusively to this specific risk factor [19,21].
Missing values in the complete cohort were imputed with a linear regression model based on age and sex. No variables had. 2.5% missing values. In the subcohort we did complete case analyses. Rather than dichotomizing the etiological factors, we categorized them into as many categories as possible, since this is presumed to increase the accuracy of the estimated PARs [22].
We estimated PARs for any stroke (ischemic, hemorrhagic, or unspecified) and for ischemic and hemorrhagic stroke separately. PARs for any and ischemic stroke were also assessed separately for men and women [23].
We assessed the PARs of hypertension, smoking, diabetes mellitus, atrial fibrillation, coronary disease, TC/HDL ratio, and overweight/obesity in the total cohort of 6,844 participants; we assessed the PARs of C-reactive protein, alcohol intake, fruit and vegetable consumption, and carotid IMT in the subcohort of 3,570 participants with complete assessment of those additional factors. For all strokes and ischemic strokes, we defined the lowest TC/HDL ratio quartile as the reference category, and for hemorrhagic strokes we defined the highest TC/HDL ratio quartile as the reference category, in accordance with current literature [24]. Interaction between gender and each etiological risk factor was assessed by entering interaction terms in Cox proportional hazards models, with age, gender, etiological factor, and gender6etiological factor as covariates. Statistical significance
was defined ata= 0.05.
Results
The complete study cohort comprised 6,844 participants, and the subgroup with assessment of additional characteristics comprised 3,570 participants (Table 2). The median age at start of follow-up was 68 y with interquartile range 62–76 y (mean age 69.4 y, standard deviation 6.3 y), and 60.1% of the participants were women. The participants in the subgroup with assessment of additional characteristics differed slightly from those in the complete study cohort; most notably, they were slightly younger, more often female, and smoked more.
During 88,011 person-years of follow-up (mean follow-up 12.9 y, standard deviation 6.3 y), 1,020 strokes occurred, of which 610 could be classified as ischemic and 103 as hemorrhagic, and 307 remained unspecified.
When evaluated separately, the most important etiological factor for any stroke was hypertension, with a PAR of 0.36 (95%
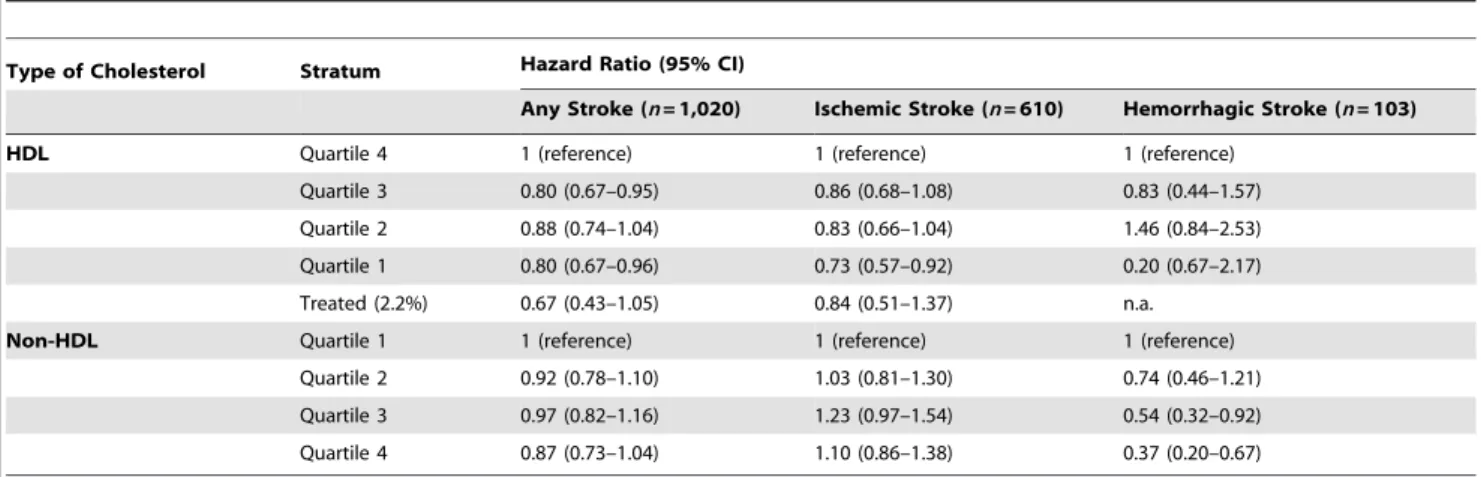
CI 0.26–0.49; Table 3). The second-ranking cause of stroke was smoking, with a PAR of 0.16 (95% CI 0.10–0.26). Also, diabetes mellitus (PAR 0.04, 95% CI 0.02–0.07) and atrial fibrillation (PAR 0.02, 95% CI 0.01–0.05) contributed significantly to the burden of stroke. Coronary disease and overweight/obesity had no statisti-cally significant impact on the burden of stroke. The total proportion of strokes that could be attributed to any combination of these six etiological factors in combination was 0.51 (95% CI 0.41–0.62). TC/HDL ratio was not associated with the risk of stroke in the expected direction: with the quartile of participants with the lowest TC/HDL ratios as the reference category, the hazard ratios were 0.83 (95% CI 0.69–0.99) for the second quartile, 0.84 (95% CI 0.70–1.00) for the third quartile, and 0.97 (95% CI 0.82–1.16) for the fourth quartile. The participants who used cholesterol-lowering medication (prevalence 2.3%) had a slightly lower risk of stroke than those in the lowest quartile of the TC/HDL ratio distribution, but this difference was not statistically significant: the HR was 0.71 (95% CI 0.45–1.12). There was no association between HDL or non-HDL cholesterol with the risk of stroke when assessed separately (Table 4).
There was no statistically significant interaction between gender and the studied etiological risk factors at a= 0.05. Stratified
analyses for men and women separately can be found in Tables 5– 8.
When we restricted the analyses to ischemic strokes, the PARs of the individual risk factors did not materially change (Table 9); the largest observed (non-significant) difference was for over-weight/obesity, which had a PAR of 0.01 (95% CI 0.00–0.92) for any stroke and a PAR of 0.12 (95% CI 0.05–0.27) for ischemic stroke. The total PAR of hypertension, smoking, diabetes mellitus, atrial fibrillation, coronary disease, overweight/obesity, and TC/HDL ratio for ischemic stroke was 0.55 (95% CI 0.41– 0.68).
When we studied hemorrhagic strokes (Table 10), smoking was the most important etiological factor (PAR 0.40, 95% CI 0.22– 0.60), followed by unfavorable TC/HDL ratio (in the case of hemorrhagic stroke, we considered a low ratio to be unfavorable): PAR 0.31 (95% CI 0.11–0.63). Hypertension was third, with a PAR of 0.24 (95% CI 0.04–0.73). Overweight/obesity was not associated with the risk of hemorrhagic stroke. This resulted in a total PAR of 0.70 (95% CI 0.45–0.87) for hemorrhagic strokes attributable to hypertension, smoking, diabetes mellitus, and unfavorable TC/HDL ratio.
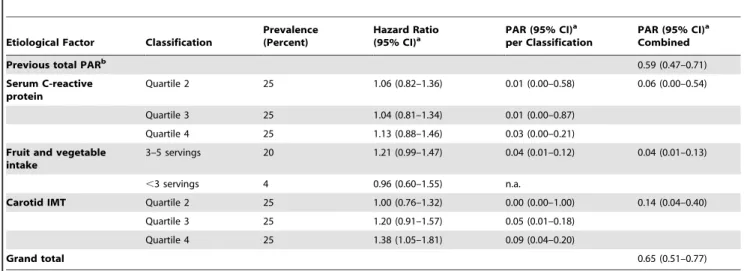
Serum C-reactive protein, fruit and vegetable intake, alcohol consumption, and carotid IMT were studied in a subcohort of 3,570 participants because of incomplete collection of data in the other participants. The combined PAR of hypertension, smoking, diabetes mellitus, atrial fibrillation, coronary disease, and over-weight/obesity was slightly higher in this subcohort than in the complete cohort (0.59, 95% CI 0.47–0.71). Addition of serum C-reactive protein, low fruit and vegetable intake, and high carotid IMT raised the PAR by 0.06 to 0.65 (95% CI 0.51–0.77; Table 11). Alcohol consumption was not related with stroke; when we compared consumption of 0 units and consumption of.3 units of alcohol per day with the recommended 1 or 2 units per day, the hazard ratios were 0.99 (95% CI 0.82–1.18) and 0.91 (95% CI 0.70–1.20), respectively.
Discussion
etiological factors did not materially change this proportion. Our estimates are considerably lower than those reported previously.
Several methodological issues need to be discussed. The strengths of our study are the meticulous stroke case finding and the nearly complete follow-up (loss of potential person-years,
Table 2.Baseline characteristics.
Characteristic Median (Interquartile Range) or Percentage p-Value for Differencea
Complete Study Cohort (n= 6,844)
Subgroup with Data on Additional Risk Factors (n= 3,570)
Age, y 68.2 (62.0–75.6) 67.7 (62.1–74.0) ,0.001
Female sex 60.1% 60.6% ,0.001
Systolic blood pressure, mm Hg 138 (123–153) 137 (123–152) 0.52
Diastolic blood pressure, mm Hg 73 (66–81) 73 (66–81) 0.68
Antihypertensive medication 12.8% 12.3% 0.56
Current smoking 22.2% 24.1% ,0.001
Former smoking 40.8% 42.3% ,0.001
Diabetes mellitus 10.3% 9.2% 0.15
Atrial fibrillation 5.0% 3.9% 0.04
Angina pectoris 3.6% 2.6% 0.42
PTCA/CABG 2.7% 1.3% 0.64
Symptomatic myocardial infarction 6.1% 6.7% 0.002
TC, mmol/l 6.6 (5.8–7.4) 6.6 (5.9–7.4) 0.01
HDL cholesterol, mmol/l 1.3 (1.1–1.6) 1.3 (1.1–1.6) 0.39
BMI, kg/m2 26.0 (23.8–28.4) 26.0 (23.9–28.4) 0.24
Serum C-reactive protein, mg/l — 1.74 (0.87–3.35) —
Alcohol intake, servings — 0.29 (0.01–1.40) —
Fruit and vegetable intake, servings — 6.6 (5.1–8.2) —
Carotid IMT, mm — 0.77 (0.68–0.86) —
aDifference between participants included and not included in the subgroup with data on additional risk factors. Logistic regression model adjusted for all other
characteristics.
doi:10.1371/journal.pmed.1001634.t002
Table 3.Population attributable risks of presumed etiological factors for any stroke (n/N= 1,020/6,844).
Etiological Factor Stratum
Prevalence (Percent)
Hazard Ratio (95% CI)a
PAR (95% CI)a
per Stratum
PAR (95% CI)a
Combined
Hypertension Prehypertension 29.9 1.33 (1.06–1.67) 0.06 (0.02–0.11) 0.36 (0.26–0.49)
Stage I 25.0 1.72 (1.38–2.16) 0.12 (0.07–0.16)
Stage II 14.0 2.00 (1.57–2.55) 0.09 (0.07–0.13)
Treated controlled 5.5 1.89 (1.37–2.59) 0.03 (0.02–0.05)
Treated uncontrolled 7.3 2.18 (1.66–2.86) 0.06 (0.04–0.09)
Smoking Former light 18.2 1.12 (0.93–1.36) 0.02 (0.00–0.09) 0.16 (0.10–0.26)
Former heavy 22.6 1.30 (1.07–1.57) 0.05 (0.03–0.11)
Current light 9.9 1.58 (1.27–1.98) 0.04 (0.02–0.07)
Current heavy 12.4 1.65 (1.32–2.06) 0.05 (0.03–0.07)
Diabetes mellitus Present 10.3 1.43 (1.20–1.71) 0.04 (0.02–0.07)
Atrial fibrillation Present 5.0 1.47 (1.15–1.89) 0.02 (0.01–0.05)
Coronary disease Present 10.0 1.11 (0.91–1.36) 0.01 (0.00–0.08)
BMI Overweight (25–30 kg/m2) 45.4 1.00 (0.87–1.15) 0.00 (0.00–1.00) 0.01 (0.00–0.92)
Obese (.30 kg/m2) 16.6 1.07 (0.89–1.28) 0.01 (0.00–0.17)
Total 0.51 (0.41–0.62)
aAll analyses are adjusted for age, sex, hypertension, smoking, diabetes mellitus, atrial fibrillation, coronary disease, and overweight/obesity, if appropriate. All HRs are
2.8%). An advantage of our stringent stroke monitoring proce-dures was that we could include stroke patients who had not been referred to a neurologist (31% of all stroke cases). Because in these cases neuroimaging was not performed, we could subclassify only 21% of them as ischemic or hemorrhagic strokes. In contrast, 93% of stroke cases that were referred to a neurologist could be subclassified. Overall, we could not determine the subtype of stroke in 307 participants.
A statistical issue to note is that the reported lower bound of some confidence intervals of PARs were close to 0 and therefore should be interpreted cautiously. The reason is that a PAR cannot be smaller than 0, which led to some of these confidence intervals being truncated at 0.
Our study is novel in four important ways. First, previous studies on the subject were case–control studies, which may have overestimated the PARs: when risk factors are assessed after
occurrence of stroke in a case–control setting, they are different than when they are measured before occurrence of stroke in a cohort study. In addition, previous studies included only strokes that were referred to a hospital, whereas we also included strokes that were not referred to a hospital (31% of all cases in our cohort). Since elderly people tend to be referred less often than younger people, and the associations between stroke and its risk factors weaken with increasing age [25], not including the non-referred strokes may lead to an overestimation of the PARs. Second, not all previous studies used statistical methods that account for the possibility that a single stroke can be attributable to multiple etiological factors [19,20], which may have caused them to overestimate PARs. Third, some previous studies included risk factors for which the association with stroke and the causal role in the etiology are not well established, leading to an overestimation of the observed associations. Fourth, the PARs that we observed
Table 4.Associations of HDL cholesterol and non-HDL cholesterol with stroke (n= 6,844).
Type of Cholesterol Stratum Hazard Ratio (95% CI)
Any Stroke (n= 1,020) Ischemic Stroke (n= 610) Hemorrhagic Stroke (n= 103)
HDL Quartile 4 1 (reference) 1 (reference) 1 (reference)
Quartile 3 0.80 (0.67–0.95) 0.86 (0.68–1.08) 0.83 (0.44–1.57)
Quartile 2 0.88 (0.74–1.04) 0.83 (0.66–1.04) 1.46 (0.84–2.53)
Quartile 1 0.80 (0.67–0.96) 0.73 (0.57–0.92) 0.20 (0.67–2.17)
Treated (2.2%) 0.67 (0.43–1.05) 0.84 (0.51–1.37) n.a.
Non-HDL Quartile 1 1 (reference) 1 (reference) 1 (reference)
Quartile 2 0.92 (0.78–1.10) 1.03 (0.81–1.30) 0.74 (0.46–1.21)
Quartile 3 0.97 (0.82–1.16) 1.23 (0.97–1.54) 0.54 (0.32–0.92)
Quartile 4 0.87 (0.73–1.04) 1.10 (0.86–1.38) 0.37 (0.20–0.67)
All analyses adjusted for age and sex, and computed with IBM SPSS Statistics, version 21. n.a., not applicable because stratum without events.
doi:10.1371/journal.pmed.1001634.t004
Table 5.Population attributable risks of presumed etiological factors for any stroke: men (n/N= 406/2,732).
Probable Etiological
Factor Stratum
Prevalence (Percent)
Hazard Ratio (95% CI)a
PAR (95% CI)a
per Stratum
PAR (95% CI)a
Combined
Hypertension Prehypertension 31.4 1.47 (1.04–2.09) 0.09 (0.04–0.21) 0.39 (0.23–0.57)
Stage I 24.4 1.89 (1.33–2.68) 0.13 (0.08–0.22)
Stage II 12.3 2.41 (1.64–3.52) 0.11 (0.07–0.16)
Treated controlled 6.1 1.55 (0.92–2.63) 0.02 (0.01–0.07)
Treated uncontrolled 7.3 1.85 (1.17–2.93) 0.04 (0.02–0.08)
Smoking Former light 19.7 1.24 (0.81–1.91) 0.04 (0.01–0.22) 0.25 (0.07–0.58)
Former heavy 41.6 1.30 (0.87–1.94) 0.10 (0.02–0.35)
Current light 9.8 1.43 (0.88–2.32) 0.03 (0.01–0.11)
Current heavy 19.4 1.65 (1.08–2.53) 0.08 (0.03–0.17)
Diabetes mellitus Present 10.1 1.46 (1.08–1.96) 0.04 (0.02–0.10)
Atrial fibrillation Present 5.6 1.27 (0.85–1.91) 0.01 (0.00–0.08)
Coronary disease Present 14.9 1.19 (0.91–1.57) 0.03 (0.01–0.13)
BMI Overweight (25–30 kg/m2) 50.0 1.14 (0.92–1.41) 0.07 (0.01–0.29) 0.07 (0.01–0.32)
Obese (.30 kg/m2) 8.3 1.10 (0.76–1.59) 0.01 (0.00–0.33)
Total 0.61 (0.42–0.77)
aAll analyses are adjusted for age, sex, hypertension, smoking, atrial fibrillation, and diabetes mellitus, if appropriate.
are considerably lower than most PARs reported previously, which is an important counterbalance for previous findings.
A comparison of the PARs ofindividualetiological factors in our study with those reported previously shows that the PARs of most factors tended to be slightly lower in our study than in earlier reports, with the exception of smoking, which had a similar PAR [3]. Several explanations are possible. First, selection bias may have played a role in earlier estimates, since strong associations tend to be more easily published than weak associations. Second, our study participants are aware of their cardiovascular risk status because of their participation in the study. The healthcare system in the study district is well developed and accessible to everyone without substantial financial barriers. Therefore, most participants have their risk factors treated according to up-to-date guidelines. Third, our study participants all live in a middle and high income area in the city, and.97% are Caucasians. As a result,
poverty-related health problems are rare. The prevalence of, for example, alcoholism, malnourishment, diabetes, and overweight/obesity is relatively low in our study population compared to other populations. This means that our results may not be generalizable to underprivileged or racially diverse populations. Fourth, we did not dichotomize the etiological factors but categorized them, which may have resulted in more accurate estimates [22]. Fifth, all risk factors were assessed at baseline. During follow-up, which was on average 12.9 y, risk factor profiles of individual participants may have changed, which could have weakened the associations we found. Sixth, the median age at start of follow-up of our study participants was relatively high (median 68 y), and the relation between stroke and its etiological factors weakens with increasing age [25].
Only a few previous studies have reported PARs ofcombinations of classical etiological factors for stroke. An overview of these
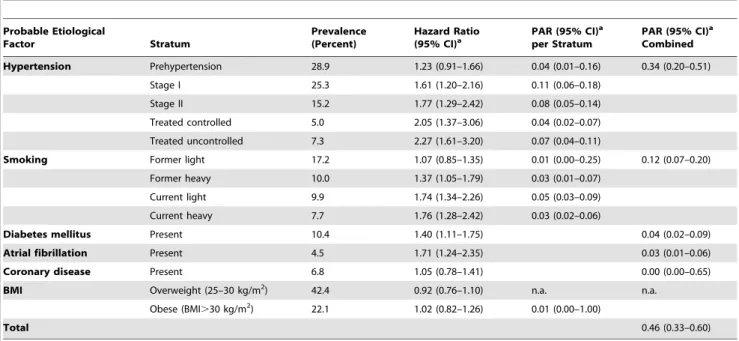
Table 6.Population attributable risks of presumed etiological factors for any stroke: women (n/N= 614/4,112).
Probable Etiological
Factor Stratum
Prevalence (Percent)
Hazard Ratio (95% CI)a
PAR (95% CI)a
per Stratum
PAR (95% CI)a
Combined
Hypertension Prehypertension 28.9 1.23 (0.91–1.66) 0.04 (0.01–0.16) 0.34 (0.20–0.51)
Stage I 25.3 1.61 (1.20–2.16) 0.11 (0.06–0.18)
Stage II 15.2 1.77 (1.29–2.42) 0.08 (0.05–0.14)
Treated controlled 5.0 2.05 (1.37–3.06) 0.04 (0.02–0.07)
Treated uncontrolled 7.3 2.27 (1.61–3.20) 0.07 (0.04–0.11)
Smoking Former light 17.2 1.07 (0.85–1.35) 0.01 (0.00–0.25) 0.12 (0.07–0.20)
Former heavy 10.0 1.37 (1.05–1.79) 0.03 (0.01–0.07)
Current light 9.9 1.74 (1.34–2.26) 0.05 (0.03–0.09)
Current heavy 7.7 1.76 (1.28–2.42) 0.03 (0.02–0.06)
Diabetes mellitus Present 10.4 1.40 (1.11–1.75) 0.04 (0.02–0.09)
Atrial fibrillation Present 4.5 1.71 (1.24–2.35) 0.03 (0.01–0.06)
Coronary disease Present 6.8 1.05 (0.78–1.41) 0.00 (0.00–0.65)
BMI Overweight (25–30 kg/m2) 42.4 0.92 (0.76–1.10) n.a. n.a.
Obese (BMI.30 kg/m2) 22.1 1.02 (0.82–1.26) 0.01 (0.00–1.00)
Total 0.46 (0.33–0.60)
aAll analyses are adjusted for age, sex, hypertension, smoking, atrial fibrillation, and diabetes mellitus, if appropriate.
n.a., not applicable because the hazard ratio is smaller than one. doi:10.1371/journal.pmed.1001634.t006
Table 7.Population attributable risks of presumed etiological factors for ischemic stroke: men and women.
Probable Etiological Factor PAR (95% CI)a
Men (n/N= 263/2,732) Women (n/N= 347/4,112)
Hypertension 0.38 (0.20–0.60) 0.28 (0.12–0.53)
Smoking 0.24 (0.05–0.67) 0.12 (0.05–0.25)
Diabetes mellitus 0.03 (0.01–0.12) 0.03 (0.01–0.11)
Atrial fibrillation n.a. 0.02 (0.01–0.07)
Coronary disease 0.07 (0.03–0.15) 0.00 (0.00–1.00)
Overweight/obesity 0.15 (0.05–0.37) 0.10 (0.02–0.38)
TC/HDL ratio n.a. 0.13 (0.03–0.45)
Total 0.64 (0.41–0.82) 0.56 (0.30–0.80)
aAll analyses are adjusted for age, sex, hypertension, smoking, atrial fibrillation, and diabetes mellitus, if appropriate.
studies can be found in Table 12. All of these studies were case– control studies or were based on previous literature. The Comparative Risk Assessment project, which based the prevalence of etiological factors and their associations with stroke on previous literature, found a total PAR of 0.70–0.76 [26]. A case–control study conducted in Rochester, Minnesota, US, reported a total PAR of 0.57 (95% CI 0.48–0.67), which after inclusion of emerging risk factors increased to 0.80 [2]. The INTERSTROKE study, a case–control study in 22 countries, found a total PAR of 0.90 (95% CI 0.85–0.94) [7]. A case–control study from the Sa˜o Vicente de Paulo Hospital in Oso´rio, Brazil, reported a total PAR of 0.99 (95% CI 0.96–1.00) [6]. We estimated the total PAR of established modifiable etiological factors to be 0.51 (95% CI 0.41– 0.62) for stroke, which is considerably lower than that reported in these previous studies.
There are several explanations why our estimates of the total PAR are lower than reported previously, in addition to the slightly lower estimates of PARs for individual risk factors. First, our study is a cohort study, whereas all previous studies that reported a total PAR were case–control studies [2,6,7,26]. The latter studies could overestimate the PAR because of reverse causality (risk factors were assessed after and not before occurrence of stroke) and because strokes that were not referred to a hospital (31% of cases in our study) were not included. Second, to combine the PARs of
multiple etiological factors, special statistical techniques have to be applied: with inadequate techniques (when only confounding and interaction are corrected for, and a disease case cannot simultaneously be attributed to more than one risk factor), total PARs are very likely to be overestimated and can even exceed 100% [18]. Third, the various studies selected slightly different etiological factors, as specified in Table 12. This could also have played a role in the observed differences. As mentioned, we selected the etiological factors in our study based on the 2011 American Heart Association/American Stroke Association guide-lines [3] and the data that were available. We had no information on physical inactivity: it has been shown that physically active persons have a 25%–30% lower risk of stroke than the least active persons, although no intervention trials have been performed [3]. The association between physical activity and stroke is at least partly mediated by blood pressure, diabetes, and body weight [3], for which we did have data. We may have slightly underestimated the total PAR because of lack of data on physical activity. Lack of data on other factors (Table 1) probably did not materially influence our total PAR, because the causality for these factors has not been established, and either the previously found associations were weak or the factors are rare in the general population [3].
It should be kept in mind that the causal role and the modifiability of the majority of these factors have not been established and are in some instances even unlikely. For example, C-reactive protein levels are consistently associated with the risk of cardiovascular disease, but genetic studies negate the causality of
Table 8.Population attributable risks of presumed etiological factors for which data were available only for subgroups, for any stroke: men and women.
Etiological Factor PAR (95% CI)aCombined
Men (n/N= 215/1,405) Women (n/N= 330/2,165)
Previous total PARb 0.74 (0.50–0.89) 0.49 (0.32–0.66)
Serum C-reactive protein 0.06 (0.00–0.85) 0.06 (0.00–0.67)
Fruit and vegetable intakec 0.09 (0.03–0.23) 0.00 (0.00–1.00)
Carotid IMT 0.09 (0.01–0.69) 0.16 (0.04–0.49)
Grand total 0.76 (0.54–0.90) 0.56 (0.34–0.75)
aAll analyses are adjusted for age, sex, hypertension, smoking, diabetes mellitus, atrial fibrillation, coronary disease, and overweight/obesity, if appropriate. bTotal PAR based on hypertension, smoking, diabetes mellitus, atrial fibrillation, coronary disease, and overweight/obesity, calculated in this subgroup of the study
population.
cVery low intake (
,3 servings per day) and low intake (3–5 servings per day) versus adequate intake (.5 servings per day) of fruits and/or vegetables. doi:10.1371/journal.pmed.1001634.t008
Table 9.Population attributable risks of presumed etiological factors for ischemic stroke.
Etiological Factor PAR (95% CI)a(n/N= 610/6,844) Hypertension 0.33 (0.20–0.49)
Smoking 0.16 (0.08–0.30)
Diabetes mellitus 0.03 (0.01–0.08)
Atrial fibrillation 0.00 (0.00–0.16)
Coronary disease 0.03 (0.01–0.08)
Overweight/obesity 0.12 (0.05–0.27)
TC/HDL ratio 0.03 (0.00–0.82)
Total 0.55 (0.41–0.68)
aAll analyses are adjusted for age, sex, hypertension, smoking, diabetes mellitus,
atrial fibrillation, coronary disease, TC/HDL ratio, and overweight/obesity, if appropriate. Category boundaries for quartiles of TC/HDL ratio were 4.38, 5.30, and 6.42 for men and 3.94, 4.78, and 5.82 for women.
doi:10.1371/journal.pmed.1001634.t009
Table 10.Population attributable risks of presumed etiological factors for hemorrhagic stroke.
Etiological Factor PAR (95% CI)a(n/N= 103/6,844) Hypertension 0.24 (0.04–0.73)
Smoking 0.40 (0.22–0.60)
Diabetes mellitus 0.03 (0.00–0.26)
TC/HDL ratiob 0.31 (0.11–0.63)
Total 0.70 (0.45–0.87)
a
All analyses are adjusted for age, sex, hypertension, smoking, diabetes mellitus, and TC/HDL ratio, if appropriate.
bThe quartile with the highest ratio was the reference category. Category
boundaries for quartiles of TC/HDL ratio were 6.42, 5.30, and 4.38 for men and 5.82, 4.78, and 3.94 for women.
Table 11.Population attributable risks of presumed etiological factors for which data were available only for subgroups, for any stroke (n/N= 545/3,570).
Etiological Factor Classification
Prevalence (Percent)
Hazard Ratio
(95% CI)a PAR (95% CI)
a
per Classification
PAR (95% CI)a Combined
Previous total PARb 0.59 (0.47–0.71)
Serum C-reactive protein
Quartile 2 25 1.06 (0.82–1.36) 0.01 (0.00–0.58) 0.06 (0.00–0.54)
Quartile 3 25 1.04 (0.81–1.34) 0.01 (0.00–0.87)
Quartile 4 25 1.13 (0.88–1.46) 0.03 (0.00–0.21)
Fruit and vegetable intake
3–5 servings 20 1.21 (0.99–1.47) 0.04 (0.01–0.12) 0.04 (0.01–0.13)
,3 servings 4 0.96 (0.60–1.55) n.a.
Carotid IMT Quartile 2 25 1.00 (0.76–1.32) 0.00 (0.00–1.00) 0.14 (0.04–0.40)
Quartile 3 25 1.20 (0.91–1.57) 0.05 (0.01–0.18)
Quartile 4 25 1.38 (1.05–1.81) 0.09 (0.04–0.20)
Grand total 0.65 (0.51–0.77)
Category boundaries for C-reactive protein quartiles were 0.896, 1.900, and 3.960 for men and 0.902, 1.830, and 3.360 for women. Category boundaries for carotid IMT quartiles were 0.72, 0.80, and 0.92 for men and 0.67, 0.76, and 0.85 for women.
aAll analyses are adjusted for age, sex, hypertension, smoking, diabetes mellitus, atrial fibrillation, coronary disease, and overweight/obesity, if appropriate. bTotal PAR based on hypertension, smoking, diabetes mellitus, atrial fibrillation, coronary disease, and overweight/obesity, calculated in this subgroup of the study
population.
n.a., not applicable because the hazard ratio is smaller than one. doi:10.1371/journal.pmed.1001634.t011
Table 12.Studies reporting total population attributable risk for stroke.
Study Publication Year Design Outcome Included Variables PAR (95% CI)
Comparative Risk Assessment project [26]
2003 Multiple Stroke High blood pressure, high
cholesterol, high BMI, low fruit and vegetable intake, physical inactivity, tobacco, alcohol
0.70–0.76
Rochester [2] 2006 Case–control Ischemic stroke Established causal factors (hypertension, transient ischemic attack, cigarette smoking, ischemic heart disease, atrial fibrillation, diabetes mellitus, mitral valve disease); emerging novel risk factors (raised apoB/apoA 1 ratio, obesity, physical inactivity, pyschosocial stress, low fruit and vegetable intake)
0.57 (0.48–0.67); 0.80 if emerging risk factors are included
INTERSTROKE [7] 2010 Case–control Stroke Self-reported hypertension, smoking status, waist-to-hip ratio, diet risk score, regular physical activity, diabetes mellitus, alcohol intake, psychosocial factors, cardiac causes, ratio of ApoB to ApoA1
0.90 (0.85–0.94)
Sa˜o Vicente de Paulo Hospital [6]
2012 Case–control Ischemic stroke Hypertension, atrial fibrillation, left ventricular hypertrophy, presence of carotid bruit, heavy smoking status, diabetes, alcohol abuse, HDL cholesterol, physical inactivity
0.99 (0.96–1.00)
Rotterdam Study (present study)
2014 Cohort Stroke, ischemic stroke, hemorrhagic stroke
Hypertension, smoking, diabetes mellitus, atrial fibrillation, coronary heart disease, overweight/obesity, TC/HDL ratio
0.51 (0.41–0.62) for stroke; 0.55 (0.41–0.68) for ischemic stroke; 0.70 (0.45–0.87) for hemorrhagic stroke
the association. C-reactive protein is not really modifiable in and of itself, and presumably is merely a marker of other presently unknown risk factors. Therefore, it is difficult to modify C-reactive protein or its underlying cause [27].
The relationship between cholesterol and stroke is controversial. The most widely accepted hypothesis is that with increasing serum levels of TC and decreasing serum levels of HDL cholesterol, the risk of ischemic stroke slightly increases and the risk of hemorrhagic stroke decreases [3,24]. Our results corroborate this view. It is possible that in our study the contrasting relationships that cholesterol has with ischemic and hemorrhagic stroke annulled the association between cholesterol and any stroke. The theoretical positive effect of cholesterol treatment per se on ischemic stroke risk may be frustrated by a negative effect on hemorrhagic stroke risk. However, trials have shown that treatment with statins prevents strokes, although it cannot be excluded that pleiotropic effects beyond cholesterol modification account for the beneficial effect of statins [28].
It should be noted that the proportion of strokes that can actually be prevented is in practice probably lower than suggested by the PAR, for several reasons. First, if a stroke is prevented successfully in a person, this person can still suffer later in life from stroke due to other causes. Second, it is unlikely that risk factors can be eliminated completely. For example, we assumed that blood pressure should be maintained below 120/80 mm Hg, but evidently it is not possible to attain such a blood pressure level in all persons. Third, we assumed that all risk factors we studied are modifiable, and that modification reverses the complete excess risk that is portended by the risk factor. This, too, is unlikely: not only because the modifiable factors may, at least partially, be markers of other factors that may not be modifiable, but also because risk factors may already have caused irreversible damage at the time that treatment is initiated.
It is uncertain whether all variation in stroke occurrence can be explained by modifiable etiological factors; we consider it likely that a large proportion of the variation in stroke occurrence can only be explained by non-modifiable factors, and even the role of chance should not be underestimated.
In conclusion, our data suggest that half of all strokes in persons aged 55 y and over might theoretically be prevented by optimal treatment or elimination of hypertension, smoking, diabetes
mellitus, atrial fibrillation, coronary disease, and overweight/ obesity. Our findings underscore the importance of hypertension and smoking as etiological factors for stroke, and encourage continuing interventions on these factors. On the other hand, our data suggest that a considerably larger proportion of strokes than commonly assumed cannot be prevented by interventions on currently known etiological factors, and show the importance of the search for novel etiological factors.
In our opinion, our results underscore that the battle against smoking should continue until smoking is banned entirely. In addition, the cost-effectiveness of population screening for hypertension and blood pressure treatment in medium-risk populations should be further explored, because even in our study population with 100% blood pressure awareness, hypertension is still the main cause of stroke. Easier treatment regimens might make it easier for persons with hypertension to adhere to their medication. Last, the quest for new etiological factors may identify new treatment targets. Emerging radiological techniques enable the imaging of intracranial atherosclerosis, which may lead to new ways to prevent stroke [29]. The fields of epigenomics and proteomics hold undelivered promises to identify yet unknown modifiable risk factors [2].
Supporting Information
Checklist S1 STROBE checklist.
(PDF)
Acknowledgments
The contributions of the inhabitants, general practitioners, and pharma-cists of the Ommoord district to the Rotterdam Study are gratefully acknowledged.
Author Contributions
Conceived and designed the experiments: MJB PJK AH MAI. Analyzed the data: MJB. Wrote the first draft of the manuscript: MJB. Contributed to the writing of the manuscript: MJB PJK AH MAI. ICMJE criteria for authorship read and met: MJB PJK AH MAI. Agree with manuscript results and conclusions: MJB PJK AH MAI. Case ascertainment: MJB PJK.
References
1. (1967) Effects of treatment on morbidity in hypertension. Results in patients with diastolic blood pressures averaging 115 through 129 mm Hg. JAMA 202: 1028– 1034.
2. Hankey GJ (2006) Potential new risk factors for ischemic stroke: what is their potential? Stroke 37: 2181–2188.
3. Goldstein LB, Bushnell CD, Adams RJ, Appel LJ, Braun LT, et al. (2011) Guidelines for the primary prevention of stroke: a guideline for healthcare professionals from the American Heart Association/American Stroke Associa-tion. Stroke 42: 517–584.
4. Rothman KJ, Greenland S, editors (1998) Modern epidemiology, 2nd edition. Philadelphia: Lippincott Williams & Wilkins.
5. Rothman KJ GS (1998) Causation and causal inference. In: Rothman KJ, Greenland S, editors. Modern epidemiology, 2nd edition. Philadelphia: Lipincott Williams & Wilkins. pp. 7–28.
6. Mallmann AB, Fuchs SC, Gus M, Fuchs FD, Moreira LB (2012) Population-attributable risks for ischemic stroke in a community in South Brazil: a case-control study. PLoS ONE 7: e35680.
7. O’Donnell MJ, Xavier D, Liu L, Zhang H, Chin SL, et al. (2010) Risk factors for ischaemic and intracerebral haemorrhagic stroke in 22 countries (the INTER-STROKE study): a case-control study. Lancet 376: 112–123.
8. Hofman A, Darwish Murad S, van Duijn CM, Franco OH, Goedegebure A, et al. (2013) The Rotterdam Study: 2014 objectives and design update. Eur J Epidemiol 28: 889–926.
9. Hatano S (1976) Experience from a multicentre stroke register: a preliminary report. Bull World Health Organ 54: 541–553.
10. Bos MJ, van Rijn MJ, Witteman JC, Hofman A, Koudstaal PJ, et al. (2007) Incidence and prognosis of transient neurological attacks. JAMA 298: 2877– 2885.
11. Clark TG, Altman DG, De Stavola BL (2002) Quantification of the completeness of follow-up. Lancet 359: 1309–1310.
12. Rose GA (1962) The diagnosis of ischaemic heart pain and intermittent claudication in field surveys. Bull World Health Organ 27: 645–658. 13. Bos MJ, Schipper CM, Koudstaal PJ, Witteman JC, Hofman A, et al. (2006)
High serum C-reactive protein level is not an independent predictor for stroke: the Rotterdam Study. Circulation 114: 1591–1598.
14. Bots ML, Hoes AW, Koudstaal PJ, Hofman A, Grobbee DE (1997) Common carotid intima-media thickness and risk of stroke and myocardial infarction: the Rotterdam Study. Circulation 96: 1432–1437.
15. van den Brandt PA, Goldbohm RA, van ’t Veer P, Volovics A, Hermus RJ, et al. (1990) A large-scale prospective cohort study on diet and cancer in The Netherlands. J Clin Epidemiol 43: 285–295.
16. Bos MJ, Koudstaal PJ, Hofman A, Witteman JC, Breteler MM (2006) Uric acid is a risk factor for myocardial infarction and stroke: the Rotterdam study. Stroke 37: 1503–1507.
17. Engelhart MJ, Geerlings MI, Ruitenberg A, van Swieten JC, Hofman A, et al. (2002) Dietary intake of antioxidants and risk of Alzheimer disease. JAMA 287: 3223–3229.
19. Dehghan A, van Hoek M, Sijbrands EJ, Stijnen T, Hofman A, et al. (2007) Risk of type 2 diabetes attributable to C-reactive protein and other risk factors. Diabetes Care 30: 2695–2699.
20. Engel LS, Chow WH, Vaughan TL, Gammon MD, Risch HA, et al. (2003) Population attributable risks of esophageal and gastric cancers. J Natl Cancer Inst 95: 1404–1413.
21. Walter SD (1998) Attributable risk in practice. Am J Epidemiol 148: 411–413. 22. Greenland S (2001) Attributable fractions: bias from broad definition of
exposure. Epidemiology 12: 518–520.
23. Bushnell CD (2008) Stroke and the female brain. Nat Clin Pract Neurol 4: 22–33. 24. Wang X, Dong Y, Qi X, Huang C, Hou L (2013) Cholesterol levels and risk of hemorrhagic stroke: a systematic review and meta-analysis. Stroke 44: 1833–1839. 25. Whisnant JP (1997) Modeling of risk factors for ischemic stroke. The Willis
Lecture. Stroke 28: 1840–1844.
26. Ezzati M, Hoorn SV, Rodgers A, Lopez AD, Mathers CD, et al. (2003) Estimates of global and regional potential health gains from reducing multiple major risk factors. Lancet 362: 271–280.
27. C Reactive Protein Coronary Heart Disease Genetics Collaboration, Wensley F, Gao P, Burgess S, Kaptoge S, et al. (2011) Association between C reactive protein and coronary heart disease: Mendelian randomisation analysis based on individual participant data. BMJ 342: d548.
28. Castilla Guerra L, del Carmen Fernandez Moreno M, Lopez Chozas JM, Jimenez Hernandez MD (2008) Statins in stroke prevention: what an internist should know. Eur J Intern Med 19: 8–14.
Editors’ Summary
Background.Every year, 15 million people worldwide have a stroke. About 6 million of these people die within hours, and another 5 million are left disabled. Stroke occurs when the brain’s blood supply is suddenly interrupted by a blood vessel in the brain being blocked by a blood clot (ischemic stroke) or bursting (hemorrhagic stroke). Deprived of the oxygen normally carried to them by the blood, the brain cells near the blockage die. The symptoms of stroke depend on which part of the brain is damaged but include sudden weakness or paralysis along one side of the body, vision loss in one or both eyes, and trouble speaking or understanding speech. Anyone experiencing these symptoms should seek immediate medical attention because prompt treatment can limit the damage to the brain. In the longer term, post-stroke rehabilitation can help overcome the disabilities caused by stroke, and various drugs alongside behavioral counselling can reduce the risk of a second stroke.
Why Was This Study Done? Fifty years ago, it was discovered that treatment of high blood pressure (hyper-tension) reduces the risk of stroke among people with severe hypertension. This discovery led researchers to search for other potentially modifiable etiological factors for stroke (risk factors that cause stroke). The list of established etiological factors now includes smoking, diabetes, atrial fibrillation (an irregular heartbeat), heart disease, and overweight/obesity, in addition to hypertension. But how many strokes would modification of these causal risk factors prevent? In this population-based cohort study, the researchers calculate the individual and combined population attributable risks (PARs) for these established etiological factors to provide an estimate of what proportion of strokes could theoretically be prevented by optimal treatment of known etiological factors. A population-based cohort study enrolls a group of people, determines their characteristics at baseline, and follows them to see whether specific characteristics are associated with specific outcomes. A PAR of an etiological factor for a disease indicates the proportion of that disease in the population that would not occur in the absence of the risk factor.
What Did the Researchers Do and Find?The researchers used data from 6,844 participants in the Rotterdam Study, which was designed to investigate the causes and conse-quences of long-term and disabling diseases in the elderly. At baseline, all of the participants were over 55 years old and free from stroke. During follow-up, 1,020 strokes occurred among the participants. Using data on exposure at baseline to various etiological factors for stroke, the researchers calculated PARs for individual factors and used a special statistical technique to calculate PARs for the factors in combination. The combined PAR of prehypertension/hyper-tension, smoking, diabetes, atrial fibrillation, heart disease, and overweight/obesity was 0.51 for any stroke. That is, about half of the strokes in the study population were attributable to this combination of etiological factors.
Hypertension and smoking were the most important individual factors (PARs of 0.36 and 0.16, respectively). Notably, the inclusion of several less well established etiological factors (increased blood levels of C-reactive protein, low fruit and vegetable consumption, and thicken-ing of the linthicken-ing of arteries) only raised the total PAR for any stroke by 0.06.
What Do These Findings Mean?These findings indicate that about half of the strokes in the study cohort were attributable to established modifiable etiological factors and could theoretically be prevented by eliminating these risk factors from the population. Previous studies have estimated that a larger proportion of strokes could be prevented by eliminating known etiological factors. The researchers acknowledge that some aspects of their study may have led to an underestimation of the proportion of stroke attributable to established etiological factors and note that their findings may not be generalizable to underprivileged or racially diverse populations. Nevertheless, they argue that previous studies are likely to have overestimated the PARs for stroke because they were based on case–control studies (in which exposure to etiological factors was assessed after a stroke had occurred in cases and control individuals, rather than before a stroke as in a population-based cohort study) and often did not use optimal statistical techniques to calculate the total PAR. Importantly, these new findings underscore the importance of interventions targeted at reducing smoking and hypertension and support the search for additional etiological factors for stroke.
Additional Information.Please access these websites via the online version of this summary at http://dx.doi.org/10. 1371/journal.pmed.1001634.
N
The US National Institute of Neurological Disorders andStroke provides information about all aspects of stroke (inEnglish and Spanish); its Know Stroke site provides educational materials about stroke prevention, treatment, and rehabilitation including personal stories (in English and Spanish); the US National Institutes of Health SeniorHealth website has additional information about stroke
N
The Internet Stroke Center provides detailed informationabout stroke for patients, families, and health professionals(in English and Spanish)
N
The UK National Health Service Choices website alsoprovides information about stroke for patients and theirfamilies, including personal stories