Inflammatory Manifestations of Experimental
Lymphatic Insufficiency
Raymond Tabibiazar1, Lauren Cheung1, Jennifer Han1, Jeffrey Swanson1, Andreas Beilhack1, Andrew An1, Soheil S. Dadras2, Ned Rockson1, Smita Joshi1, Roger Wagner1, Stanley G. Rockson1*
1Stanford Center for Lymphatic and Venous Disorders, Division of Cardiovascular Medicine, Stanford University School of Medicine, Stanford, California, United States of America,2Department of Pathology, Stanford University School of Medicine, Stanford, California, United States of America
Funding:The authors gratefully acknowledge grant support from the Susan G. Komen Breast Cancer Foundation and the Western States Affiliate of the American Heart Association. The funders had no role in study design, data collection and analysis, decision to publish, or preparation of the manuscript.
Competing Interests:The authors have declared that no competing interests exist.
Academic Editor:Patrick Vallance, University College London, United Kingdom
Citation:Tabibiazar R, Cheung L, Han J, Swanson J, Beilhack A, et al. (2006) Inflammatory manifestations of experimental lymphatic insufficiency. PLoS Med 3(7): e254. DOI: 10.1371/journal.pmed.0030254
Received:June 8, 2005 Accepted:April 5, 2006 Published:July 18, 2006
DOI:
10.1371/journal.pmed.0030254
Copyright:Ó2006 Tabibiazar et al. This is an open-access article distributed under the terms of the Creative Commons Attribution License, which permits unrestricted use, distribution, and reproduction in any medium, provided the original author and source are credited.
Abbreviations:dpm, disintegrations per minute; EST, expressed sequence tag; FDR, false detection rate; GO, Gene Ontology;luc,luciferase; qRT-PCR, quantitative real-time RT-PCR; SAM, significance analysis of microarrays
* To whom correspondence should be addressed. E-mail: srockson@ cvmed.stanford.edu
A B S T R A C T
Background
Sustained lymph stagnation engenders a pathological response that is complex and not well characterized. Tissue inflammation in lymphedema may reflect either an active or passive consequence of impaired immune traffic.
Methods and Findings
We studied an experimental model of acute post-surgical lymphedema in the tails of female hairless, immunocompetent SKH-1 mice. We performed in vivo imaging of impaired immune traffic in experimental, murine acquired lymphatic insufficiency. We demonstrated impaired mobilization of immunocompetent cells from the lymphedematous region. These findings correlated with histopathological alterations and large-scale transcriptional profiling results. We found intense inflammatory changes in the dermis and the subdermis. The molecular pattern in the RNA extracted from the whole tissue was dominated by the upregulation of genes related to acute inflammation, immune response, complement activation, wound healing, fibrosis, and oxidative stress response.
Conclusions
We have characterized a mouse model of acute, acquired lymphedema using in vivo functional imaging and histopathological correlation. The model closely simulates the volume response, histopathology, and lymphoscintigraphic characteristics of human acquired lymphedema, and the response is accompanied by an increase in the number and size of microlymphatic structures in the lymphedematous cutaneous tissues. Molecular character-ization through clustering of genes with known functions provides insights into processes and signaling pathways that compose the acute tissue response to lymph stagnation. Further study of genes identified through this effort will continue to elucidate the molecular mechanisms and lead to potential therapeutic strategies for lymphatic vascular insufficiency.
Introduction
Acquired lymphedema is a common, important, and often devastating consequence of successful surgical and adjuvant therapy of breast cancer and other malignancies [1,2]. The biology of regional lymphatic vascular insufficiency (lymphe-dema) is complex and, as yet, poorly understood. Conse-quently, there is a paucity of effective treatment strategies in patients with lymphedema [2]. There is an obvious need for better molecular characterization of this disease process to elucidate the pathobiology of lymphatic vascular insuffi-ciency.
The tissue response to lymph stagnation is rather complex. The profound structural and functional abnormalities in the lymphedematous tissues reflect a multicellular response to impaired extracellular fluid mobilization [3]. It has been suggested that lymphedema provokes an inflammatory tissue response in the skin [4]. While it is conceivable that the inflammatory nature of the tissue response to lymph stagnation reflects either the active or passive consequences of impaired immune traffic [5], direct experimental con-firmation is lacking.
Transcriptional profiling has been utilized in the molecular characterization of isolated lymphatic endothelia [6,7], but the molecular end-organ response to lymph stagnation remains unaddressed and poorly understood. While lym-phatic and blood vessel responses to injury might be predictable, an elucidation of whole tissue response to disease is likely to provide more relevant insights into the important interactions between the tissue matrix and the resident, heterogeneous cellular populations that likely compose the target-organ response to persistent lymph stagnation.
To investigate tissue responses to lymphatic vascular insufficiency, we have undertaken dynamic, in vivo imaging of the impaired immune traffic in a murine model of acquired lymphatic insufficiency that is intended to simulate, in part, the lymphatic dysfunction of post-surgical lymphe-dema [8]. These observations were correlated with an assess-ment of the cutaneous histopathology in the lymphedema tissue. Furthermore, to investigate the molecular mechanisms of tissue response to lymphatic vascular insufficiency, we have undertaken a large-scale transcriptional profiling of the lymphedema tissue utilizing a comprehensive mouse cDNA microarray containing 42,300 features, representing over 25,000 unique genes and expressed sequence tags (ESTs) [9]. The patterns of gene expression in lymphedema were contrasted with those observed in normal and surgical sham controls.
Methods
This study was approved by the Administrative Panels on Laboratory Animal Care of Stanford University.
Creation of Experimental Lymphedema
Post-surgical lymphedema was experimentally created in the tails of female hairless, immunocompetent SKH-1 mice (Charles River Laboratories, Boston, Massachusetts, United States). Prior to surgery, the mice were anesthetized with intraperitoneal injection of 0.07 cc of a solution containing ketamine, xylazine, and saline. For each intervention, the skin
of the tail was circumferentially incised proximally, at a point 16 mm distal to its base. The major lymphatic trunks were identified through subcutaneous injection of methylene blue distal to the surgical incision, followed by controlled, limited cautery ablation of these structures. In surgical controls (sham animals), skin incision alone was performed, with methylene blue injection but without lymphatic cautery. The normal control animals did not undergo any surgical manipulation. All animal subjects were sacrificed on day 14 of observation. After sacrifice, 0.5-gm sections of the tail were harvested for paraffin embedding and RNA extraction.
Tail Volume Quantitation
Tail volume was quantitated in each animal subject immediately prior to sacrifice. Volumetric assessment was performed with a manually adjusted caliper, with serial measurement of the tail circumference at 5-mm intervals along its axis. The tail volume was quantitated with the truncated cone formula [10].
Histology
Immediately following sacrifice, 0.5-gm sections of the tail were harvested for histological analysis and RNA extraction. Sections extended from a point 4 mm proximal to the surgical incision to 8 mm beyond it. For examination of the responses remote from the point of injury, sections were harvested 4 cm distal to the surgical site. The specimens were fixed overnight in 4% paraformaldehyde. After paraffin embedding, 5-lm sections were stained with hematoxylin and eosin (Richard-Allan Scientific, Kalamazoo, Michigan, United States). For visualization of histiocytes/mast cells, the sections were stained with a 1% toluidine blue solution (LabChem, Pittsburgh, Pennsylvania, United States) diluted in 1% NaCl. After deparaffinization in xylene, sections were rehydrated though a series of graded alcohol steps starting with 100% EtOH and ending in 50% EtOH. Slides remained in toluidine blue for 2 min and were then dehydrated through graded alcohol washes and covered with Cytoseal (Richard-Allan Scientific).
LYVE-1 Immunohistochemical Staining
Paraffin sections 5lm thick were deparaffinized in xylene, rehydrated in a graded series of ethanol, pretreated with target retrieval solution (Dako, Carpinteria, California, United States) in a pressure cooker, and incubated in a peroxidase block for 10 min. Sections were then incubated with rabbit polyclonal anti-LYVE-1 antibody (1:200, Upstate Cell Signaling Solutions, Lake Placid, New York, United States) for 1 h at room temperature, followed by horseradish-peroxidase-conjugated secondary antibody for 30 min at room temperature and detection with DAB for 4 min (Envision System Kit, Dako). Tissue sections were counter-stained with Gill 1 hematoxylin (Richard-Allan Scientific) for 15 s, then dehydrated in graded ethanol and coverslipped with CoverSafe (American Master*Tech Scientific, Lodi, California, United States).
Functional Imaging of Immune Traffic in the Lymphedema Model
created and compared with normal mice (n¼5). For in vivo bioluminescence imaging, spleens from transgenic luciferase (lucþ
) heterozygous animals were put into single-cell suspen-sion, expressing firefly luc under the control of a chicken beta-actin promoter as previously described [11,12]. The single-cell suspensions from mouse spleens consisted of different hematopoietic lineages:;40% were CD19þB cells, ;20% were CD4þT cells,;10%–15% were CD8þT cells, 3% were NK1.1þNK cells, and the rest were GR.1þgranulocytes,
Mac-1þmacrophages, CD11cþdendritic cells, and rarer cell populations. A total of 43106splenocytes (.97% CD45þ) in PBS were injected in a volume of 20 ml into the tail interstitium, 1 cm caudal to the site of surgery, in both lymphedema mice and surgical shams. Normal mice were injected at the corresponding level of the tail. Injections were performed on post-surgical day 7. Thereafter,lucþ
cells were repetitively imaged in vivo, at predetermined intervals following the cell injections. In brief, mice were anesthetized by intraperitoneal co-injection of a mixture of ketamine (1 mg/mouse), xylazine (lg/mouse) in PBS, and the substrate luciferin (150 mg/kg).
Ten minutes thereafter, dorsal images were obtained with an IVIS100 CCD imaging system (Xenogen, Alameda, Cal-ifornia, United States). The efficiency of cellular lymphatic drainage was determined by direct imaging of light emission at each of the measured time points, with quantitation of the change in light emission relative to that observed 20 h after cell injection, which was defined as 100%.
Microsphere Quantitation of Arterial Perfusion of the Mouse Tail
The arterial perfusion of the tails of experimental and control mice was quantitated through intracardiac micro-sphere injection. After induction of general anesthesia, stable-labeled 15-lm microspheres (STERIspheres Gold, BioPAL, Worcester, Massachusetts, United States) were injected into the left ventricle. Each animal subject received 0.53106microspheres (0.2 ml) injected directly into the left ventricle. The animals were sacrificed after 12 min. The tails were harvested and dried overnight at 70 8C. The assay to quantitate disintegrations per minute (dpm) was performed by BioPhysics Assay Laboratory (Worcester, Massachusetts, United States) as previously described [13].
Lymphoscintigraphy in Experimental Lymphedema Whole body lymphoscintigraphy was performed after the intradermal injection of 100 lCi/0.02 ml of filtered 99m Tc-sulfur colloid (100 nm size) into the tip of the tail. Dynamic and static images (2553255) were acquired using a parallel hole collimator in a microSPECT gamma camera (Lumigem, Gamma Medica, Northridge, California, United States). The dynamic images (1,000 frames; 0.5 s/frame) were started 60 s prior to the injection of the tracer. The injection lasted for 20 s. The static images (10 min) were acquired immediately after the dynamic acquisition.
Microarray Experimental Design, RNA Preparation, and Hybridization
Tissues were derived from nine mice for each of the three biological states under study (cutaneous specimens from normal, lymphedematous, and surgical sham animals), for a total of 27 mice. All microarray hybridizations were
performed with three biological replicates, using pooled samples independently derived from three mice each, for a total of nine hybridizations. After tissue was harvested for histological examination, the remaining, distal portion of the tail was retrieved for RNA isolation. After completely separating the tail skin from the cartilage by blunt dissection, the tissue was separated into segments of 0.5 mm for further processing. Total RNA was isolated using a modified two-step purification protocol as described previously [14]. RNA integrity was assessed using the Agilent 2100 Bioanalyzer System with RNA 6000 Pico LabChip Kit (Agilent, Palo Alto, California, United States). First-strand cDNA was synthesized from 15lg of total RNA derived from each pool and from whole embryonic-day-17.5 embryo for reference RNA, in the presence of Cy3 and Cy5 dUTP, respectively, and hybridized to the Mouse Transcriptome Microarray [14–16]. A contin-uously updated and annotated list of the cDNAs included on this array is available at the Stanford Microarray Database [17] (Table S1).
Data Acquisition, Analysis, and Statistical Analysis Image acquisition of the mouse cDNA microarrays was performed on an Agilent G2565AA Microarray Scanner System. Feature extraction was performed with GenePix 4.0 software (Bucher Biotec, Basel, Switzerland). Numerical raw data were migrated from GenePix, without processing, into an Oracle relational database (CoBi) that was designed specifically for microarray data analysis (GeneData, Basel, Switzerland). The data were then analyzed using Expressionist software (GeneData). After background subtraction and dye normalization, features with low signal intensity in the reference channel were filtered if signal was less than 2.53 background value, retaining a total of 8,353 features for further analysis.K-nearest-neighbor algorithm was applied to impute for missing values (,7% of remaining data) [18]. For two-group comparisons, we used the significance analysis of microarrays (SAM) algorithm [19,20]. Heat maps were generated using HeatMap Builder [21,22]. For enrichment analysis we used the EASE analysis software, which uses Gene Ontology (GO) annotation and Fisher’s exact test to derive biological themes within particular gene sets [23].
Quantitative Real-Time RT-PCR
Quantitative real-time RT-PCR (qRT-PCR) was performed as described [14]. Primers and probes for ten representative differentially expressed genes were obtained from Applied Biosystems Assays-on-Demand (Applied Biosystems, Foster City, California, United States. cDNA was synthesized from 5
pooled normal results and were plotted on a log10 scale. The primers and probes utilized in this study are listed in Tables 1 and 2.
Results
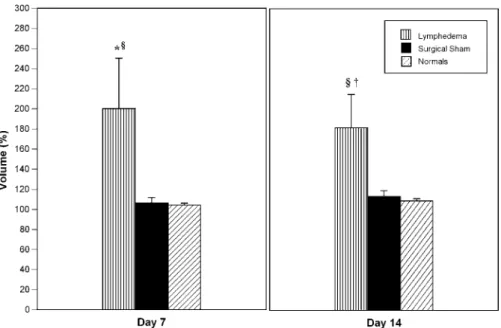
Murine Model of Acute Experimental Lymphedema: Tail Volume Quantification
Forty-five 3-wk-old SKH-1 hairless mice were studied in this investigation. Of these, 18 underwent post-surgical lymphatic ablation, nine served as surgical sham controls, and the remaining 18 served as normal controls. Tail volume for each group of animals is depicted in Figure 1. At post-surgical day 7, the lymphedema tail volumes were 200%6 50% of baseline (p,0.008 when compared to surgical sham controls). In the animals subjected to lymphatic ablation, the edematous enlargement of the tails persisted until the day of sacrifice (day 14). Of note is the fact that cutaneous healing of the wound, both in the lymphedematous and surgical sham subjects, was complete by day 14. There was no statistically significant change in tail volume in either surgical sham or normal controls.
Histological Assessment of the Cutaneous Response to Lymphatic Interruption
Hematoxylin and eosin specimens derived from the lymphedematous tails were characterized by the presence of marked acute inflammatory changes (Figure 2B), when compared to the tissue derived from the normal tails (Figure 2A). There was a notable increase in cellularity, with an increase in the number of observed fibroblasts and histio-cytes, as well as a large infiltration of neutrophils Granulation tissue was observed closer to the center of the section, with bystander destruction of muscle tissue. In addition, there was hyperkeratosis and spongiosis and edema of the epidermis, with irregularity of the epidermal/dermal junction, elonga-tion of the dermal papillae, and a 2- to 3-fold expansion of
tissue between the bone and the epidermis. Lymphedema specimens were characterized by the presence of numerous dilated lymphatics in the dermis and subdermis, as seen in Figure 2B. In contrast, normal tail sections were devoid of these dilated structures. The normal tissues were character-ized by the presence of a thin dermis and epidermis, with a normal epidermal/dermal junction (Figure 2A). The surgical sham controls were indistinguishable from normals, with no increased cellularity in dermis or epidermis, and no enlarged nuclei or hyperkeratosis.
In order to assess whether the lymphedematous changes created a uniform pathological response distal to the point of lymphatic ablation, the tissues were also sampled distally (4 cm distal to the point of surgical incision) in normal (Figure 2C) and lymphedematous (Figure 2D) tails. The observed changes were comparable to those observed adjacent to the surgical site: lymphedematous tissues were characterized by hypercellularity, inflammatory infiltration, and microlym-phatic dilatation that were not present in the normal tissues.
Quantitative Assessment of Arterial Perfusion in the Murine Tail Lymphedema Model
While we took great care to avoid concurrent injury to adjacent vascular structures during surgical lymphatic abla-tion, we have undertaken an evaluation to exclude inadver-tent arterial injury during surgery. The mouse tails remained grossly stable throughout the post-surgical observation phase, with no evidence of frank necrosis distal to the surgical site. In order to further substantiate the absence of an arterial ischemic contribution to the histological pathology observed in lymphedema, quantitative assessment of arterial perfusion was performed through intracardiac injection of stable 15-lm microspheres into the left ventricles of normal (n¼3) and lymphedema (n¼3) mice. Perfusion of the tail, measured in disintegrations per minute (dpm), did not differ statistically between the two categories (normal, 151,186669,213 dpm; sham, 95,581 6 48,003 dpm), confirming preservation of arterial supply in the lymphedema animals.
LYVE-1 Immunohistochemical Staining
The nature of the lymphatic vascular response distal to the anatomic surgical ablation was assessed with quantitative assessment of lymphatic vessel number and size by immuno-histochemical staining for LYVE-1(Figure 3) [24,25]. As observed in the hematoxylin and eosin sections, lymphedema was characterized by the presence of numerous dilated microlymphatic structures in the dermis and subdermis. Mean lymphatic vessel number was determined by averaging the number of total lymphatic vessels in all the fields of each slide
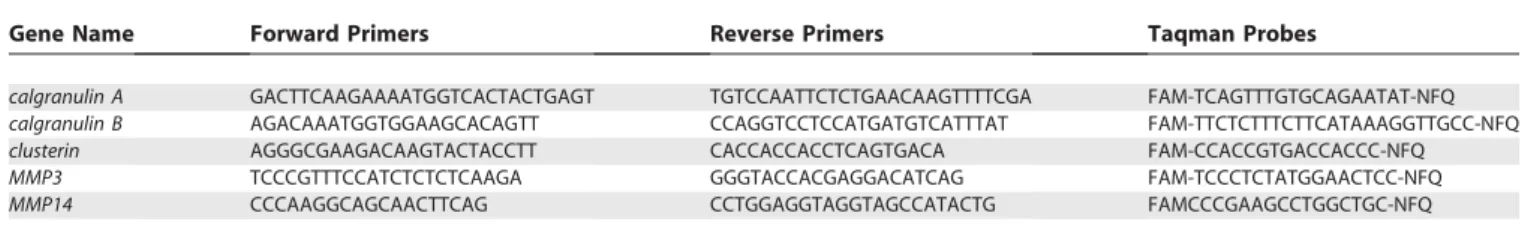
Table 1.Primer/Probe Sequences for the Taqman-Based qRT-PCR
Gene Name Forward Primers Reverse Primers Taqman Probes
calgranulin A GACTTCAAGAAAATGGTCACTACTGAGT TGTCCAATTCTCTGAACAAGTTTTCGA FAM-TCAGTTTGTGCAGAATAT-NFQ
calgranulin B AGACAAATGGTGGAAGCACAGTT CCAGGTCCTCCATGATGTCATTTAT FAM-TTCTCTTTCTTCATAAAGGTTGCC-NFQ
clusterin AGGGCGAAGACAAGTACTACCTT CACCACCACCTCAGTGACA FAM-CCACCGTGACCACCC-NFQ
MMP3 TCCCGTTTCCATCTCTCTCAAGA GGGTACCACGAGGACATCAG FAM-TCCCTCTATGGAACTCC-NFQ
MMP14 CCCAAGGCAGCAACTTCAG CCTGGAGGTAGGTAGCCATACTG FAMCCCGAAGCCTGGCTGC-NFQ
DOI: 10.1371/journal.pmed.0030254.t001
Table 2.Names of Taqman-Based qRT-PCR Probes
Symbol Name Applied Biosystems ID
Cdh11 cadherin 11 Mm00515462_m1
HADH2 hydroxyacyl-coenzyme A dehydrogenase type II
Mm00840109_m1
Myd88 myeloid differentiation primary response gene 88
Mm00440338_m1
Figure 1.Tail Volume Changes at Post-Surgical Day 7 and at Day 14 DOI: 10.1371/journal.pmed.0030254.g001
Figure 2.Histopathology of Experimental Lymphedema in the Murine Tail
Lymphedema was characterized by the presence of marked acute inflammatory changes, both adjacent to the surgical site and within distal regions of the tail, remote from the site of surgical ablation.
(A) Normal tail skin harvested 16 mm from the base of the tail is characterized by the presence of a thin dermis and epidermis, with a normal epidermal/ dermal junction. Surgical sham controls were indistinguishable from normals, with no increased cellularity in dermis or epidermis, and no enlarged nuclei or hyperkeratosis.
(B) Lymphedematous skin harvested immediately distal to the site of prior surgical lymphatic ablation is characterized by the presence of marked acute inflammatory changes, absent in the tissue derived from the normal tails. There is a notable increase in cellularity, with an increase in the number of observed fibroblasts and histiocytes, as well as a large infiltration of neutrophils. There is hyperkeratosis and spongiosis and edema of the epidermis, with irregularity of the epidermal/dermal junction, elongation of the dermal papillae, and a 2- to 3-fold expansion of tissue between the bone and the epidermis. There are numerous dilated lymphatic microvessels in the dermis and subdermis (black arrows). In contrast, normal tail sections were devoid of these dilated structures.
at 103magnification. Single brown-stained endothelial cells with a lumen were counted as individual lymphatic vessels. Quantitation was performed for normals (n ¼ 3), surgical shams (n¼3), and lymphedema tails (n¼3). Lymphedema was characterized by an increase in LYVE-1-positive vessel number per field that was not observed in shams: lymphede-ma, 7.064.8; sham, 0.660.5; and normal, 1.260.8.
Vessel area was quantitated according to the formula
pr1r2. The average lymphatic luminal area per field was 503 6158lm2in normals, 4366345lm2in shams, and 51,3446 18,688lm2in lymphedema. Normals and shams did not differ statistically, but the lymphedema group displayed a statisti-cally significant increase in average vessel area when compared either to normals or to sham surgical animals (p ¼ 0.009 for each comparison). Thus, in summary, the experimental lymphedema is accompanied by an increase in vessel number and, even more notably, by an increase in lymphatic vascular cross-sectional area.
Lymphoscintigraphy of Experimental Lymphedema Whole body lymphoscintigraphy was performed in normal (n¼4) and lymphedema (n¼4) mice. All non-operated mice showed lymphatic drainage from the tip of the tail through two lumbar lymph nodes, asymmetric para-aortic nodes, and mediastinal nodes with final visualization of the liver. The lymphatic flow speed in basal conditions was estimated to be 0.9 6 0.66 mm/s. In the lymphedema animals, significant dermal backflow was present, but no flow was observed beyond the base of the tail. These lymphoscintigraphic findings closely simulate the qualitative changes observed in the analogous imaging of acquired human lymphedema.
Functional In Vivo Imaging of Immune Traffic
The lymphatic vasculature participates in the immune response through the continuous transportation of white
blood cells and antigen-presenting cells. The constellation of histological observations in this model, otherwise unex-plained by impaired interstitial fluid mobilization, suggests that derangements in lymphatic immune traffic might contribute—actively, passively, or both ways—to the biology of lymph stagnation. Accordingly, we chose to corroborate histopathology with observed, quantifiable changes in im-mune traffic.
Bioluminescence imaging was performed on days 3, 5, and 7.5 following the introduction oflucþ
cells into the distal tail (corresponding to post-operative days 10, 12, and 17.5, respectively). In general, when compared to normals, the clearance of bioluminescent immunocytes was delayed in lymphedema, but remained unimpaired in the surgical sham controls. Figure 4 depicts a series of imaging experiments for a representative pair of lymphedema and normal control mice. Relative photon density, expressed as the percent of the observed value on day 1, was significantly greater in lymphedema than in the normals, both at day 3 and at day 7 post-injection (Figure 4).
Large-Scale Analysis of Cutaneous Gene Expression in Response to Lymphatic Vascular Insufficiency (Lymph Stasis)
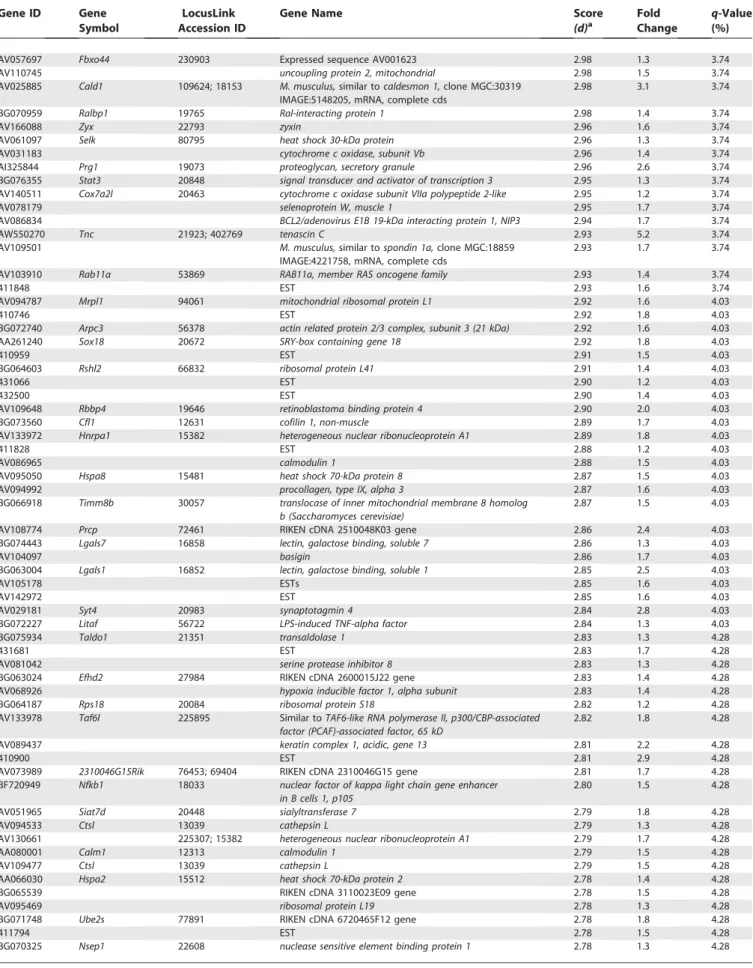
cDNA microarrays containing a large portion of the mouse transcriptome were used to study the repertoire of genes expressed in the murine skin structures. Triplicate micro-array experiments were performed using pooled RNA from the tail skin of female SKH-1 hairless mice representing three biological states: normal, lymphedematous, and surgical sham. Our analyses demonstrated significantly different patterns of gene expression in normal skin and the skin derived from lymphedematous mice. SAM, at a false detection rate (FDR) of 5%, identified 429 upregulated genes in the lymphedema state versus 183 downregulated genes
Figure 3.LYVE-1 Immunohistochemical Staining
Immunohistochemical staining for LYVE-1 is depicted in surgical sham controls (A) and in lymphedema (B) (black arrows). The lymphedema response is characterized by the presence of numerous dilated microlymphatic structures in the dermis and subdermis. Lymphedema produces a statistically significant increase in average cross-sectional vessel area.
Figure 4.Dynamic Imaging of Immune Traffic in Experimental Lymphedema
(A) In vivo bioluminescence imaging of immune traffic. Bioluminescence imaging was performed at defined time points following the introduction of
lucþ
cells. This figure contains a representative series of imaging experiments for paired normal control (A) and lymphedema (B) mice. Photon densities range from red (high) to blue (low). In general, clearance of bioluminescent immunocytes from the lymphedematous tails was delayed, but remained unimpaired in the surgical sham controls. The left panel shows a perceptible increase in photon densities in lymphedema on day 3 post-injection (post-operative day 10). Within several days, the disparity in cellular clearance is even more evident (middle panel); as late as day 17 post-injection, there is still visible bioluminescence in the lymphedematous tail, while all activity has cleared from the normal tail (right panel). The original surgical site is depicted by the white arrows. The black marks on the tail denote 8-mm vertical distances; splenocyte injection was performed 24 mm below the surgical site.
(Figure 5). There were no statistically significant differences between normal mice and surgical control animals (SAM, FDR,25%). A complete list of differentially regulated genes is provided in Tables 3 and 4.
To identify important biological themes represented by genes differentially expressed in the atherosclerotic lesions, we functionally annotated the genes using GO terms. Enrichment analysis with the Fisher’s exact test (EASE software) demonstrated several statistically significant ontol-ogies (Figure 5; Tables 5 and 6), including several pathways associated with inflammation. The inflammatory processes, such as defense response, immune response, response to stress, response to pest/pathogen/parasite, and complement activation, represent both humoral immune response and innate immunity.
Further scrutiny of the list of genes whose expression is significantly altered in lymphedematous skin suggests that the disease process can be characterized by alterations within a relatively small set of functional attributes, as summarized in Table 7. These processes include acute inflammatory response, wound healing and fibrosis, angiogenesis, cytoske-letal organization,Wntpathway activation, and adipogenesis.
qRT-PCR Confirms the Accuracy of Microarray Hybridization Results
Differential expression of eight representative genes from various pathways was confirmed by qRT-PCR. The genes were selected to represent the spectrum of magnitude and direction of change of lymphedematous gene expression relative to normal. The genes assayed includedcalgranulin A, calgranulin B, matrix metalloproteinase 3 (MMP3), matrix metal-loproteinase 14 (MMP14), myeloid differentiation primary response gene 88 (MYD88), hydroxysteroid (17-beta) dehydrogenase 2
(HADH2), cadherin 11,andclusterin. Overall, the results of the two methods correlated well (Figure 6).
Discussion
In this study, we have characterized a mouse model of lymphedema using in vivo functional imaging and histopa-thological correlation. This model of acute, acquired lymph stagnation closely simulates the volume response, histopa-thology, and lymphoscintigraphic characteristics of human acquired lymphedema. LYVE-1 immunohistochemistry dem-onstrates that this acute impairment of lymph transport is accompanied by an increase in the number and size of microlymphatic structures in the lymphedematous cutaneous tissues.
We have also undertaken molecular characterization of the disease process through comprehensive transcriptional profiling of the murine lymphedematous tail skin. We have identified a set of genes and molecular pathways that play a role in the unique biology of this cutaneous response to lymph stasis (lymphedema). Recognition of this molecular response pattern is likely to enhance our comprehension of the pathogenesis and biology of lymphedema.
The model has been elaborated to simulate the regional, acquired lymph stagnation that can arise after trauma, surgery, and cancer therapeutics [8]. Despite apparent rapid healing of the external cutaneous wound, the model features a stable, persistent edematous increase in the volume of the tail, accompanied by a profound inflammatory response; neither edema nor inflammation is seen in surgical controls. The cutaneous inflammatory response observed in this model replicates clinical descriptions of human acquired lymphedema, where there is frequently evidence of
concom-Figure 5.SAM Analysis of Microarray Data
At an FDR of 5%, SAM analysis identified 429 upregulated genes in the lymphedema state versus 183 downregulated genes. There were no statistically significant differences between normal mice and surgical control animals (SAM, FDR,25%). Enrichment analysis with the Fisher’s exact test (EASE software) demonstrated several statistically significant ontologies.
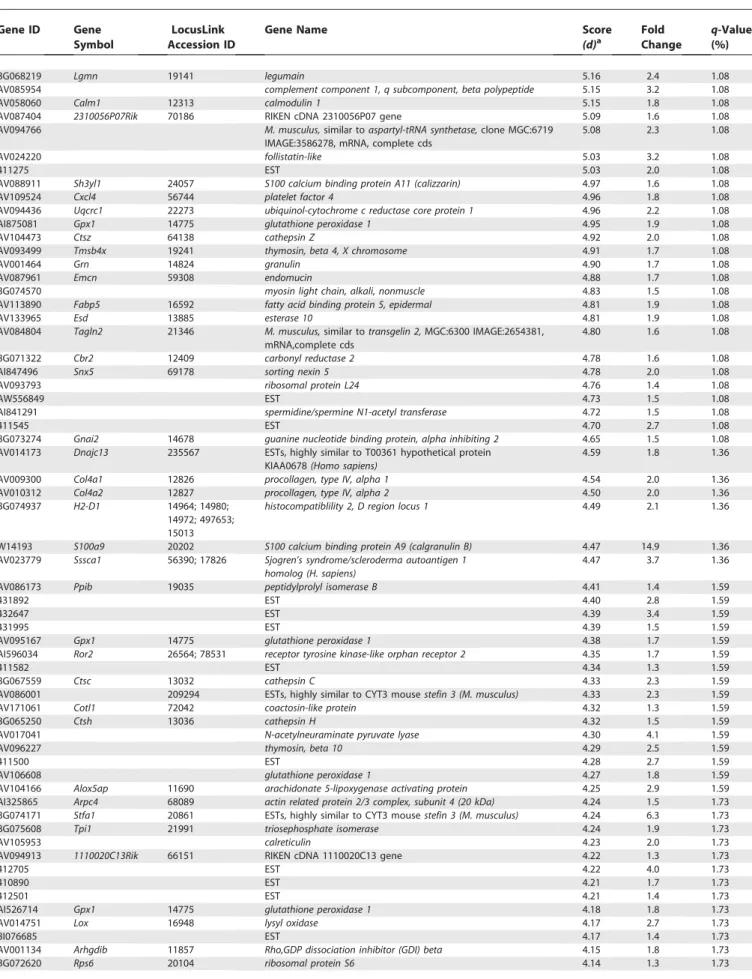
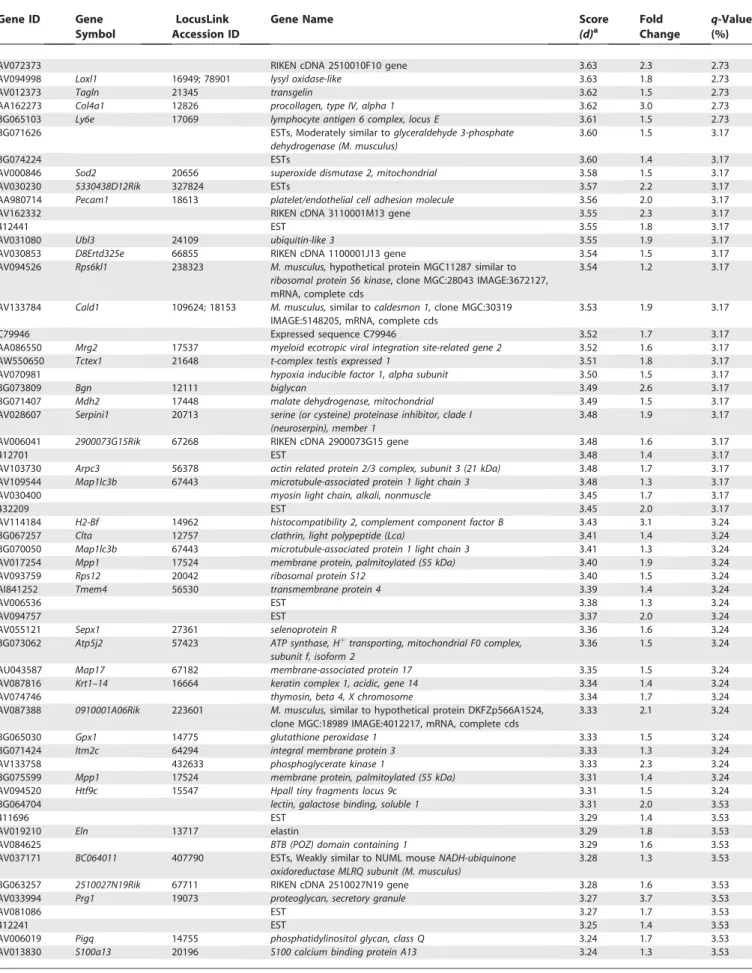
Table 3.Upregulated Genes in Lymphedema versus Normal Control (SAM, FDR,0.05)
Gene ID Gene Symbol
LocusLink Accession ID
Gene Name Score
(d)a
Fold Change
q-Value (%)
AV020023 S100a9 20202 S100 calcium binding protein A9 (calgranulin B) 17.47 21.5 0.91
AV171621 Stfa3 20863 stefin A3 14.55 4.3 0.91
AV038429 Rarres2 71660 Mus musculus,similar to RIKEN cDNA 0610007L05 gene, clone MGC:18838 IMAGE:4212222, mRNA, complete cds
11.98 2.9 0.91
BG072297 Fcer1g 14127 Fc receptor, IgE, high affinity I, gamma polypeptide 11.02 4.2 0.91
AA139015 B2m 12010 beta-2 microglobulin 10.86 3.9 0.91
AV034788 cytotoxic T lymphocyte-associated protein 2 alpha 10.81 4.5 0.91
432238 EST 10.42 3.3 0.91
AV171866 Stfa1 20861 ESTs, highly similar to CTY3 mousestefin 3 (Mus musculus) 10.04 4.6 0.91
AV068500 Lgals2 107753 lysozyme 10.02 4.6 0.91
AA003942 Tnc 21923; 402769 tenascin C 9.21 7.8 0.91
AV109517 Cyba 13057 cytochrome b-245, alpha polypeptide 8.91 2.6 0.91
W48195 1500040F11Rik 22272 RIKEN cDNA 1500040F11 gene 8.80 1.8 0.91
43822 EST 8.68 2.1 0.91
AW547306 C1qg 12262 complement component 1, q subcomponent, c polypeptide 8.38 2.6 0.91
AV083964 heme oxygenase (decyling) 1 8.12 1.6 0.91
BG073325 EST 8.02 1.3 0.91
AV094691 ubiquitin-conjugating enzyme E2 variant 1 8.01 1.5 0.91
AV114351 Rbp1 19659 retinol binding protein 1, cellular 7.66 2.5 0.91
BG063011 Ctla2a 13024; 13025 cytotoxic T lymphocyte-associated protein 2 alpha 7.54 4.0 0.91
AV069980 B2m 12010 beta-2 microglobulin 7.47 3.2 0.91
AV133727 Ssr4 20832 signal sequence receptor, delta 7.04 1.4 0.91
431201 EST 6.84 2.7 0.91
411130 EST 6.83 2.0 0.91
AV09442 EST, weakly similar to RL 15 rat60S ribosomal protein L15 (Rattus norvegicus)
6.72 1.7 0.91
AV068190 Ndufa6 67130 M. musculus,similar to hypothetical protein MGC3178, clone MGC:28887 IMAGE:4911455, mRNA, complete cds
6.58 2.4 0.91
AI118893 S100a8 20201 EST 6.57 16.0 0.91
AW550933 EST, weakly similar to PRP3 mouseproline-rich protein
MP-3 (M. musculus)
6.57 1.3 0.91
AV094499 Isyna1 71780 RIKEN cDNA 1300017C10 gene 6.49 1.6 0.91
AV060165 EST 6.37 3.9 0.91
AV066072 Ifitm3 66141 RIKEN cDNA 1110004C05 gene 6.35 2.1 0.91
432539 EST 6.22 3.8 0.91
AV037118 B2m 12010 beta-2 microglobulin 6.14 3.0 0.91
AV028863 ferritin heavy chain 6.06 2.0 0.91
AV035363 Prg1 19073 proteoglycan, secretory granule 5.98 3.7 0.91
AV013352 1810009M01Rik 65963 RIKEN cDNA 1810009M01 gene 5.94 2.3 0.91
AV054688 Muc1 17829 EST 5.93 1.7 0.91
412016 EST 5.86 3.6 0.91
411315 EST 5.84 1.8 0.91
412595 EST 5.82 1.4 0.91
AV061443 Ifngr1 15979 interferon gamma receptor 5.81 2.0 0.91
BG072156 Ifitm3 66141 RIKEN cDNA 1110004C05 gene 5.78 3.7 0.91
413077 EST 5.73 1.7 0.91
AV035765 EST 5.72 4.5 0.91
AA177689 Mrg2 17537 myeloid ecotropic viral integration site-related gene 2 5.71 1.6 0.91
AA162879 stromal cell-derived factor 1 5.70 2.4 0.91
AV052140 Cxcl12 20315 stromal cell-derived factor 1 5.63 2.0 0.91
AA087526 Rbp1 19659 retinol binding protein 1, cellular 5.59 2.9 0.91
AV109528 myosin light chain, alkali, nonmuscle 5.57 1.7 0.91
AV108847 Gnl2 230737 M. musculus,similar tonucleolar GTPase,clone MGC: 7863 IMAGE: 3501393, mRNA complete cds
5.54 2.3 0.91
BG070106 Lcn2 16819 lipocalin 2 5.47 6.1 0.91
431107 EST 5.41 2.6 1.08
BG073227 Fbln2 14115 fibulin 2 5.41 2.0 1.08
AA072722 Fcer1g 14127 Fc receptor, IgE, high affinity I, gamma polypeptide 5.35 3.0 1.08
412394 EST 5.31 1.7 1.08
BG063844 Lcp1 18826 plastin 2, L 5.29 3.3 1.08
AV087823 Cbr2 12409 carbonyl reductase 2 5.29 1.8 1.08
413592 EST 5.28 2.4 1.08
AV036203 Lsp1 16985 lymphocyte specific 1 5.22 1.7 1.08
AV141619 RIKEN cDNA 1810037I17 gene 5.22 1.4 1.08
BG074642 BC027309 243371 RIKEN cDNA 0610007L05 gene 5.21 2.5 1.08
AV070323 Ndufab1 70316 RIKEN cDNA 2610003B19 gene 5.21 1.7 1.08
Table 3.Continued
Gene ID Gene Symbol
LocusLink Accession ID
Gene Name Score
(d)a
Fold Change
q-Value (%)
BG068219 Lgmn 19141 legumain 5.16 2.4 1.08
AV085954 complement component 1, q subcomponent, beta polypeptide 5.15 3.2 1.08
AV058060 Calm1 12313 calmodulin 1 5.15 1.8 1.08
AV087404 2310056P07Rik 70186 RIKEN cDNA 2310056P07 gene 5.09 1.6 1.08
AV094766 M. musculus,similar toaspartyl-tRNA synthetase,clone MGC:6719 IMAGE:3586278, mRNA, complete cds
5.08 2.3 1.08
AV024220 follistatin-like 5.03 3.2 1.08
411275 EST 5.03 2.0 1.08
AV088911 Sh3yl1 24057 S100 calcium binding protein A11 (calizzarin) 4.97 1.6 1.08
AV109524 Cxcl4 56744 platelet factor 4 4.96 1.8 1.08
AV094436 Uqcrc1 22273 ubiquinol-cytochrome c reductase core protein 1 4.96 2.2 1.08
AI875081 Gpx1 14775 glutathione peroxidase 1 4.95 1.9 1.08
AV104473 Ctsz 64138 cathepsin Z 4.92 2.0 1.08
AV093499 Tmsb4x 19241 thymosin, beta 4, X chromosome 4.91 1.7 1.08
AV001464 Grn 14824 granulin 4.90 1.7 1.08
AV087961 Emcn 59308 endomucin 4.88 1.7 1.08
BG074570 myosin light chain, alkali, nonmuscle 4.83 1.5 1.08
AV113890 Fabp5 16592 fatty acid binding protein 5, epidermal 4.81 1.9 1.08
AV133965 Esd 13885 esterase 10 4.81 1.9 1.08
AV084804 Tagln2 21346 M. musculus,similar totransgelin 2,MGC:6300 IMAGE:2654381, mRNA,complete cds
4.80 1.6 1.08
BG071322 Cbr2 12409 carbonyl reductase 2 4.78 1.6 1.08
AI847496 Snx5 69178 sorting nexin 5 4.78 2.0 1.08
AV093793 ribosomal protein L24 4.76 1.4 1.08
AW556849 EST 4.73 1.5 1.08
AI841291 spermidine/spermine N1-acetyl transferase 4.72 1.5 1.08
411545 EST 4.70 2.7 1.08
BG073274 Gnai2 14678 guanine nucleotide binding protein, alpha inhibiting 2 4.65 1.5 1.08
AV014173 Dnajc13 235567 ESTs, highly similar to T00361 hypothetical protein KIAA0678(Homo sapiens)
4.59 1.8 1.36
AV009300 Col4a1 12826 procollagen, type IV, alpha 1 4.54 2.0 1.36
AV010312 Col4a2 12827 procollagen, type IV, alpha 2 4.50 2.0 1.36
BG074937 H2-D1 14964; 14980; 14972; 497653; 15013
histocompatiblility 2, D region locus 1 4.49 2.1 1.36
W14193 S100a9 20202 S100 calcium binding protein A9 (calgranulin B) 4.47 14.9 1.36
AV023779 Sssca1 56390; 17826 Sjogren’s syndrome/scleroderma autoantigen 1 homolog (H. sapiens)
4.47 3.7 1.36
AV086173 Ppib 19035 peptidylprolyl isomerase B 4.41 1.4 1.59
431892 EST 4.40 2.8 1.59
432647 EST 4.39 3.4 1.59
431995 EST 4.39 1.5 1.59
AV095167 Gpx1 14775 glutathione peroxidase 1 4.38 1.7 1.59
AI596034 Ror2 26564; 78531 receptor tyrosine kinase-like orphan receptor 2 4.35 1.7 1.59
411582 EST 4.34 1.3 1.59
BG067559 Ctsc 13032 cathepsin C 4.33 2.3 1.59
AV086001 209294 ESTs, highly similar to CYT3 mousestefin 3 (M. musculus) 4.33 2.3 1.59
AV171061 Cotl1 72042 coactosin-like protein 4.32 1.3 1.59
BG065250 Ctsh 13036 cathepsin H 4.32 1.5 1.59
AV017041 N-acetylneuraminate pyruvate lyase 4.30 4.1 1.59
AV096227 thymosin, beta 10 4.29 2.5 1.59
411500 EST 4.28 2.7 1.59
AV106608 glutathione peroxidase 1 4.27 1.8 1.59
AV104166 Alox5ap 11690 arachidonate 5-lipoxygenase activating protein 4.25 2.9 1.59
AI325865 Arpc4 68089 actin related protein 2/3 complex, subunit 4 (20 kDa) 4.24 1.5 1.73
BG074171 Stfa1 20861 ESTs, highly similar to CYT3 mousestefin 3 (M. musculus) 4.24 6.3 1.73
BG075608 Tpi1 21991 triosephosphate isomerase 4.24 1.9 1.73
AV105953 calreticulin 4.23 2.0 1.73
AV094913 1110020C13Rik 66151 RIKEN cDNA 1110020C13 gene 4.22 1.3 1.73
412705 EST 4.22 4.0 1.73
410890 EST 4.21 1.7 1.73
412501 EST 4.21 1.4 1.73
AI526714 Gpx1 14775 glutathione peroxidase 1 4.18 1.8 1.73
AV014751 Lox 16948 lysyl oxidase 4.17 2.7 1.73
BI076685 EST 4.17 1.4 1.73
AV001134 Arhgdib 11857 Rho,GDP dissociation inhibitor (GDI) beta 4.15 1.8 1.73
Table 3.Continued
Gene ID Gene Symbol
LocusLink Accession ID
Gene Name Score
(d)a
Fold Change
q-Value (%)
BG065930 RIKEN cDNA 3110023F10 gene 4.13 1.6 1.73
BG076357 erythroid differentiation regulator 4.11 2.7 1.73
AV094406 M. musculus,clone IMAGE:3499608, mRNA, partial cds 4.11 1.5 1.73
AW554113 EST 4.11 1.5 1.73
411855 EST 4.10 1.5 1.73
AV031220 SET translocation 4.09 1.5 1.96
BG072550 Carhsp1 52502 RIKEN cDNA 120011K09 gene 4.08 1.8 1.96
AV038462 Ctla2a 13024; 13025 cytotoxic T lymphocyte-associated protein 2 alpha 4.07 4.0 1.96
AV120085 ribosomal protein S18 4.06 1.2 1.96
AV009166 capping protein beta 1 4.05 1.7 1.96
412280 EST 4.04 2.9 1.96
AV111409 Ubl5 66177 ubiquitin-like 5 4.02 1.3 1.96
AV039992 Dnajc2 22791 zuotin related factor 2 4.02 1.3 1.96
AW543803 hypoxia inducible factor 1, alpha subunit 4.01 1.9 1.96
AW551760 interferon induced transmembrane protein 3-like 4.00 1.7 1.96
BG071182 0610011I04Rik 66058 RIKEN cDNA 0610011I04 gene 4.00 2.7 1.96
BG065327 Aatf 56321 traube 4.00 1.2 1.96
AW553642 Cald1 109624; 18153 M. musculus,similar tocaldesmon 1,clone MGC:30319 IMAGE:5148205, mRNA, complete cds
4.00 2.1 1.96
430643 EST 4.00 3.4 1.96
432671 EST 3.98 1.8 1.96
431125 EST 3.97 2.7 1.96
AV009103 Expressed sequence AA408606 3.96 1.5 1.96
AW554082 EST 3.95 1.8 1.96
AV094414 Slc35b1 73836 M. musculus,clone MGC:31031 IMAGE:5137689, mRNA, complete cds 3.91 2.3 1.96
AV017679 small EDRK-rich factor 2 3.90 1.7 1.96
411766 EST 3.89 1.3 1.96
AV094647 Ndufs8 225887 M. musculus,clone MGC:37950 IMAGE:5132866, mRNA, complete cds 3.89 1.3 2.28
AV105113 Ifitm3 66141 RIKEN cDNA 1110004C05 gene 3.89 1.6 2.28
AF065441 Fgfbp1 14181 fibroblast growth factor binding protein 1 3.87 1.5 2.28
AV065392 Atp6v0b 114143 ESTs 3.87 1.4 2.28
BG063611 lectin, galactose binding, soluble 1 3.86 2.9 2.28
430977 EST 3.86 2.7 2.28
BG072866 M. musculus,clone MGC:28609 IMAGE:4218551, mRNA, complete cds 3.85 1.3 2.28
411576 EST 3.84 2.5 2.28
AV094612 C87860 97112 Expressed sequence C87860 3.83 1.4 2.28
BG075953 Usp33 170822 Vhlh-interacting deubiquitinating enzyme 1 3.83 1.9 2.28
AW548371 EST 3.81 1.7 2.28
432957 EST 3.81 2.1 2.28
AV109529 ferritin heavy chain 3.81 2.2 2.28
AV109316 thymosin, beta 4, X chromosome 3.81 1.7 2.28
433177 EST 3.80 1.6 2.28
413039 EST 3.80 1.8 2.28
AV070066 EST 3.78 1.5 2.28
AV294875 Pgk1 18655 phosphoglycerate kinase 1 3.78 1.7 2.28
BG072801 S100a9 20202 S100 calcium binding protein A9 (calgranulin B) 3.78 19.2 2.28
AV014493 Zbtb17 22642 zinc finger protein 100 3.78 1.6 2.28
413454 EST 3.77 4.5 2.28
BG075853 Sepp1 20363 selenoprotein P, plasma 1 3.77 2.8 2.28
AV087234 Eef2k 13631; 436008 Expressed sequence C86191 3.76 1.7 2.28
AV028503 Sat1 20229 spermidine/spermine N1-acetyl transferase 3.76 1.6 2.73
AV133930 Hexa 15211 hexosaminidase A 3.74 2.0 2.73
410654 EST 3.74 2.7 2.73
AV025941 aquaporin 1 3.74 2.0 2.73
AV050073 S100a9 20202 S100 calcium binding protein A9 (calgranulin B) 3.74 22.5 2.73
AV093600 Atp5j2 57423 ATP synthase, Hþ
transporting, mitochondrial F0 complex, subunit f, isoform 2
3.73 1.6 2.73
AA408841 Csrp1 13007 cystein rich protein 3.73 1.7 2.73
AW553287 osteoblast specific factor 2 (fasciclin I-like) 3.72 2.1 2.73
AV043279 cholinergic receptor, nicotinic, epsilon polypeptide 3.71 1.6 2.73
AV134223 fatty acid binding protein 5, epidermal 3.70 2.2 2.73
BG063873 Ftl1 14325 ferritin light chain 1 3.70 2.4 2.73
AV134053 Rpo1–3 20018 RNA polymerase 1–3 (16-kDa subunit) 3.70 1.2 2.73
AW547223 ribosomal protein L29 3.68 2.5 2.73
BG064350 actinin, alpha 1 3.66 1.8 2.73
AV113595 embryonic ectoderm development 3.65 1.9 2.73
Table 3.Continued
Gene ID Gene Symbol
LocusLink Accession ID
Gene Name Score
(d)a
Fold Change
q-Value (%)
AV072373 RIKEN cDNA 2510010F10 gene 3.63 2.3 2.73
AV094998 Loxl1 16949; 78901 lysyl oxidase-like 3.63 1.8 2.73
AV012373 Tagln 21345 transgelin 3.62 1.5 2.73
AA162273 Col4a1 12826 procollagen, type IV, alpha 1 3.62 3.0 2.73
BG065103 Ly6e 17069 lymphocyte antigen 6 complex, locus E 3.61 1.5 2.73
BG071626 ESTs, Moderately similar toglyceraldehyde 3-phosphate
dehydrogenase (M. musculus)
3.60 1.5 3.17
BG074224 ESTs 3.60 1.4 3.17
AV000846 Sod2 20656 superoxide dismutase 2, mitochondrial 3.58 1.5 3.17
AV030230 5330438D12Rik 327824 ESTs 3.57 2.2 3.17
AA980714 Pecam1 18613 platelet/endothelial cell adhesion molecule 3.56 2.0 3.17
AV162332 RIKEN cDNA 3110001M13 gene 3.55 2.3 3.17
412441 EST 3.55 1.8 3.17
AV031080 Ubl3 24109 ubiquitin-like 3 3.55 1.9 3.17
AV030853 D8Ertd325e 66855 RIKEN cDNA 1100001J13 gene 3.54 1.5 3.17
AV094526 Rps6kl1 238323 M. musculus,hypothetical protein MGC11287 similar to
ribosomal protein S6 kinase, clone MGC:28043 IMAGE:3672127, mRNA, complete cds
3.54 1.2 3.17
AV133784 Cald1 109624; 18153 M. musculus,similar tocaldesmon 1,clone MGC:30319 IMAGE:5148205, mRNA, complete cds
3.53 1.9 3.17
C79946 Expressed sequence C79946 3.52 1.7 3.17
AA086550 Mrg2 17537 myeloid ecotropic viral integration site-related gene 2 3.52 1.6 3.17
AW550650 Tctex1 21648 t-complex testis expressed 1 3.51 1.8 3.17
AV070981 hypoxia inducible factor 1, alpha subunit 3.50 1.5 3.17
BG073809 Bgn 12111 biglycan 3.49 2.6 3.17
BG071407 Mdh2 17448 malate dehydrogenase, mitochondrial 3.49 1.5 3.17
AV028607 Serpini1 20713 serine (or cysteine) proteinase inhibitor, clade I (neuroserpin), member 1
3.48 1.9 3.17
AV006041 2900073G15Rik 67268 RIKEN cDNA 2900073G15 gene 3.48 1.6 3.17
412701 EST 3.48 1.4 3.17
AV103730 Arpc3 56378 actin related protein 2/3 complex, subunit 3 (21 kDa) 3.48 1.7 3.17
AV109544 Map1lc3b 67443 microtubule-associated protein 1 light chain 3 3.48 1.3 3.17
AV030400 myosin light chain, alkali, nonmuscle 3.45 1.7 3.17
432209 EST 3.45 2.0 3.17
AV114184 H2-Bf 14962 histocompatibility 2, complement component factor B 3.43 3.1 3.24
BG067257 Clta 12757 clathrin, light polypeptide (Lca) 3.41 1.4 3.24
BG070050 Map1lc3b 67443 microtubule-associated protein 1 light chain 3 3.41 1.3 3.24
AV017254 Mpp1 17524 membrane protein, palmitoylated (55 kDa) 3.40 1.9 3.24
AV093759 Rps12 20042 ribosomal protein S12 3.40 1.5 3.24
AI841252 Tmem4 56530 transmembrane protein 4 3.39 1.4 3.24
AV006536 EST 3.38 1.3 3.24
AV094757 EST 3.37 2.0 3.24
AV055121 Sepx1 27361 selenoprotein R 3.36 1.6 3.24
BG073062 Atp5j2 57423 ATP synthase, Hþ
transporting, mitochondrial F0 complex, subunit f, isoform 2
3.36 1.5 3.24
AU043587 Map17 67182 membrane-associated protein 17 3.35 1.5 3.24
AV087816 Krt1–14 16664 keratin complex 1, acidic, gene 14 3.34 1.4 3.24
AV074746 thymosin, beta 4, X chromosome 3.34 1.7 3.24
AV087388 0910001A06Rik 223601 M. musculus,similar to hypothetical protein DKFZp566A1524, clone MGC:18989 IMAGE:4012217, mRNA, complete cds
3.33 2.1 3.24
BG065030 Gpx1 14775 glutathione peroxidase 1 3.33 1.5 3.24
BG071424 Itm2c 64294 integral membrane protein 3 3.33 1.3 3.24
AV133758 432633 phosphoglycerate kinase 1 3.33 2.3 3.24
BG075599 Mpp1 17524 membrane protein, palmitoylated (55 kDa) 3.31 1.4 3.24
AV094520 Htf9c 15547 Hpall tiny fragments locus 9c 3.31 1.5 3.24
BG064704 lectin, galactose binding, soluble 1 3.31 2.0 3.53
411696 EST 3.29 1.4 3.53
AV019210 Eln 13717 elastin 3.29 1.8 3.53
AV084625 BTB (POZ) domain containing 1 3.29 1.6 3.53
AV037171 BC064011 407790 ESTs, Weakly similar to NUML mouseNADH-ubiquinone oxidoreductase MLRQ subunit (M. musculus)
3.28 1.3 3.53
BG063257 2510027N19Rik 67711 RIKEN cDNA 2510027N19 gene 3.28 1.6 3.53
AV033994 Prg1 19073 proteoglycan, secretory granule 3.27 3.7 3.53
AV081086 EST 3.27 1.7 3.53
412241 EST 3.25 1.4 3.53
AV006019 Pigq 14755 phosphatidylinositol glycan, class Q 3.24 1.7 3.53
Table 3.Continued
Gene ID Gene Symbol
LocusLink Accession ID
Gene Name Score
(d)a
Fold Change
q-Value (%)
AV015250 DnaJ (Hsp40) homolog, subfamily B, member 5 3.24 2.6 3.53
204387 EST 3.24 1.6 3.53
AW323058 Hsd17b4 15488 CD63 antigen 3.23 1.5 3.53
AI574416 Tgfb2 21808 transforming growth factor, beta 2 3.23 1.8 3.53
BG063870 Actb 11461 actin, beta, cytoplasmic 3.22 1.3 3.53
410751 EST 3.22 1.4 3.53
431101 EST 3.22 1.7 3.53
410791 EST 3.21 1.5 3.53
BE307724 Psap 19156 prosaposin 3.20 1.4 3.53
AV073780 Txln 109658 RIKEN cDNA 2600010N21 gene 3.19 1.9 3.53
AV308712 GLI-Kruppel family member GLI 3.19 1.4 3.53
BG072588 RIKEN cDNA 2410030A14 gene 3.19 1.4 3.53
AV074050 retinol binding protein 1, cellular 3.18 1.8 3.53
AV035206 Ehhadh 74147 RIKEN cDNA 1300002P22 gene 3.17 2.1 3.53
AV094410 5430413I02Rik 56742 differential display and activated by p53 3.17 1.3 3.53
AV171092 Actc1 11464 actin, alpha, cardiac 3.17 1.2 3.53
411087 EST 3.16 1.5 3.53
BG064536 Kdelr2 66913 RIKEN cDNA 1110007A14 gene 3.16 1.6 3.53
AA776162 CACNA1B 774 calcium channel, voltage-dependent, L type, alpha 1B subunit 3.15 1.6 3.73
AV162471 EST 3.15 2.1 3.73
AV041829 thymosin, beta 10 3.15 2.3 3.73
412704 EST 3.15 1.3 3.73
AV089281 Col5a2 12832 procollagen, type V, alpha 2 3.14 2.4 3.73
AV109643 Niemann Pick type C2 3.14 2.0 3.73
AI325874 Hspe1 15528 heat shock 10-kDa protein 1 (chaperonin 10) 3.13 1.5 3.73
432933 EST 3.13 1.3 3.73
BG065380 Pkm2 18746 pyruvate kinase 3 3.13 1.3 3.73
BG063305 Atp1b1 11931 ATPase, Naþ
/Kþ
transporting, beta 1 polypeptide 3.12 1.3 3.73
BG069782 Hsd17b4 15488 CD63 antigen 3.10 1.5 3.73
BG064917 Tmem14c 66154 RIKEN cDNA 1110021D01 gene 3.10 1.3 3.73
BG072879 2610524G07Rik 66494 cytochrome P450, steroid inducible 3a11 3.10 1.3 3.73
AV093637 Pafah1b3 18476 platelet-activating factor acetylhydrolase, isoform 1b, alpha 1 subunit
3.09 1.4 3.73
AV052389 Spink4 20731 serine protease inhibitor, Kazal type 4 3.09 2.6 3.73
RW:284 EST 3.08 3.7 3.73
AV094857 2410003B16Rik 72333 RIKEN cDNA 2410003B16 gene 3.08 1.4 3.73
411234 EST 3.08 1.9 3.73
AV156366 glyceraldehyde 3-phosphate dehydrogenase 3.08 1.6 3.73
41261 EST 3.08 1.8 3.73
BG066823 Ckmt1 12716 creatine kinase, mitochondrial 1, ubiquitous 3.07 1.5 3.73
AV028632 RIKEN cDNA 5530601H04 gene 3.07 1.9 3.73
AV094958 Sec22l1 20333 SEC22 vesicle trafficking protein-like 1 (S. cerevisiae) 3.07 1.4 3.73
X77585 Txn1 22166 thioredoxin 1 3.07 1.6 3.73
AV049504 EST, weakly similar to RL37 human 60Sribosomal
protein L37 (R. norvegicus)
3.07 1.2 3.73
412915 EST 3.06 1.6 3.73
BG071240 Cox7c 12867; 18738 phosphatidylinositol transfer protein 3.06 1.3 3.73
AV088363 Rplp2 67186 ribosomal protein, large P2 3.06 1.4 3.73
AW989643 EST 3.05 1.9 3.73
AV149918 Car2 12349 carbonic anhydrase 2 3.05 2.1 3.74
AV084873 Laptm5 16792 lysosomal-associated protein transmembrane 5 3.05 1.7 3.74
BG072998 Expressed sequence AU018638 3.04 1.8 3.74
413190 EST 3.03 1.3 3.74
AA000350 Fbn1 14118 fibrilin 1 3.02 1.6 3.74
BG075073 Tmsb4x 19241 thymosin, beta 4, X chromosome 3.02 1.7 3.74
AA693053 Ptpn2 19255 protein tyrosine phosphatase, non-receptor type 2 3.02 1.5 3.74
AV035959 Rps21 66481 RIKEN cDNA 2410030A14 gene 3.02 1.3 3.74
BG069532 Npc2 67963 Niemann Pick type C2 3.01 1.4 3.74
AV083728 Npc2 67963 Niemann Pick type C2 3.01 1.4 3.74
AA410137 EST 3.00 1.3 3.74
AV082005 0610040D20Rik 66070 RIKEN cDNA 0610040D20 gene 3.00 1.5 3.74
AV103733 Emp3 13732 epithelial membrane protein 3 3.00 1.4 3.74
BG063700 Sri 109552 RIKEN cDNA 2210417O06 gene 2.99 1.5 3.74
AA608500 S100a6 20200 S100 calcium binding protein A6 (calcyclin) 2.99 1.6 3.74
AI836995 432684 nascent polypeptide-associated complex alpha polypeptide 2.99 1.3 3.74
431042 EST 2.99 1.6 3.74
Table 3.Continued
Gene ID Gene Symbol
LocusLink Accession ID
Gene Name Score
(d)a
Fold Change
q-Value (%)
AV057697 Fbxo44 230903 Expressed sequence AV001623 2.98 1.3 3.74
AV110745 uncoupling protein 2, mitochondrial 2.98 1.5 3.74
AV025885 Cald1 109624; 18153 M. musculus,similar tocaldesmon 1,clone MGC:30319 IMAGE:5148205, mRNA, complete cds
2.98 3.1 3.74
BG070959 Ralbp1 19765 Ral-interacting protein 1 2.98 1.4 3.74
AV166088 Zyx 22793 zyxin 2.96 1.6 3.74
AV061097 Selk 80795 heat shock 30-kDa protein 2.96 1.3 3.74
AV031183 cytochrome c oxidase, subunit Vb 2.96 1.4 3.74
AI325844 Prg1 19073 proteoglycan, secretory granule 2.96 2.6 3.74
BG076355 Stat3 20848 signal transducer and activator of transcription 3 2.95 1.3 3.74
AV140511 Cox7a2l 20463 cytochrome c oxidase subunit VIIa polypeptide 2-like 2.95 1.2 3.74
AV078179 selenoprotein W, muscle 1 2.95 1.7 3.74
AV086834 BCL2/adenovirus E1B 19-kDa interacting protein 1, NIP3 2.94 1.7 3.74
AW550270 Tnc 21923; 402769 tenascin C 2.93 5.2 3.74
AV109501 M. musculus,similar tospondin 1a,clone MGC:18859
IMAGE:4221758, mRNA, complete cds
2.93 1.7 3.74
AV103910 Rab11a 53869 RAB11a, member RAS oncogene family 2.93 1.4 3.74
411848 EST 2.93 1.6 3.74
AV094787 Mrpl1 94061 mitochondrial ribosomal protein L1 2.92 1.6 4.03
410746 EST 2.92 1.8 4.03
BG072740 Arpc3 56378 actin related protein 2/3 complex, subunit 3 (21 kDa) 2.92 1.6 4.03
AA261240 Sox18 20672 SRY-box containing gene 18 2.92 1.8 4.03
410959 EST 2.91 1.5 4.03
BG064603 Rshl2 66832 ribosomal protein L41 2.91 1.4 4.03
431066 EST 2.90 1.2 4.03
432500 EST 2.90 1.4 4.03
AV109648 Rbbp4 19646 retinoblastoma binding protein 4 2.90 2.0 4.03
BG073560 Cfl1 12631 cofilin 1, non-muscle 2.89 1.7 4.03
AV133972 Hnrpa1 15382 heterogeneous nuclear ribonucleoprotein A1 2.89 1.8 4.03
411828 EST 2.88 1.2 4.03
AV086965 calmodulin 1 2.88 1.5 4.03
AV095050 Hspa8 15481 heat shock 70-kDa protein 8 2.87 1.5 4.03
AV094992 procollagen, type IX, alpha 3 2.87 1.6 4.03
BG066918 Timm8b 30057 translocase of inner mitochondrial membrane 8 homolog b (Saccharomyces cerevisiae)
2.87 1.5 4.03
AV108774 Prcp 72461 RIKEN cDNA 2510048K03 gene 2.86 2.4 4.03
BG074443 Lgals7 16858 lectin, galactose binding, soluble 7 2.86 1.3 4.03
AV104097 basigin 2.86 1.7 4.03
BG063004 Lgals1 16852 lectin, galactose binding, soluble 1 2.85 2.5 4.03
AV105178 ESTs 2.85 1.6 4.03
AV142972 EST 2.85 1.6 4.03
AV029181 Syt4 20983 synaptotagmin 4 2.84 2.8 4.03
BG072227 Litaf 56722 LPS-induced TNF-alpha factor 2.84 1.3 4.03
BG075934 Taldo1 21351 transaldolase 1 2.83 1.3 4.28
431681 EST 2.83 1.7 4.28
AV081042 serine protease inhibitor 8 2.83 1.3 4.28
BG063024 Efhd2 27984 RIKEN cDNA 2600015J22 gene 2.83 1.4 4.28
AV068926 hypoxia inducible factor 1, alpha subunit 2.83 1.4 4.28
BG064187 Rps18 20084 ribosomal protein S18 2.82 1.2 4.28
AV133978 Taf6l 225895 Similar toTAF6-like RNA polymerase II, p300/CBP-associated factor (PCAF)-associated factor, 65 kD
2.82 1.8 4.28
AV089437 keratin complex 1, acidic, gene 13 2.81 2.2 4.28
410900 EST 2.81 2.9 4.28
AV073989 2310046G15Rik 76453; 69404 RIKEN cDNA 2310046G15 gene 2.81 1.7 4.28
BF720949 Nfkb1 18033 nuclear factor of kappa light chain gene enhancer in B cells 1, p105
2.80 1.5 4.28
AV051965 Siat7d 20448 sialyltransferase 7 2.79 1.8 4.28
AV094533 Ctsl 13039 cathepsin L 2.79 1.3 4.28
AV130661 225307; 15382 heterogeneous nuclear ribonucleoprotein A1 2.79 1.7 4.28
AA080001 Calm1 12313 calmodulin 1 2.79 1.5 4.28
AV109477 Ctsl 13039 cathepsin L 2.79 1.5 4.28
AA066030 Hspa2 15512 heat shock 70-kDa protein 2 2.78 1.4 4.28
BG065539 RIKEN cDNA 3110023E09 gene 2.78 1.5 4.28
AV095469 ribosomal protein L19 2.78 1.3 4.28
BG071748 Ube2s 77891 RIKEN cDNA 6720465F12 gene 2.78 1.8 4.28
411794 EST 2.78 1.5 4.28
itant chronic inflammation, and regional immune responses are distorted [2]. Architectural changes in the skin and subcutaneous tissues are often profound [3]. Chronic lymph stasis typically stimulates an increase in the number of fibroblasts, adipocytes, and keratinocytes in the skin.
Mono-nuclear cells (chiefly macrophages) often demarcate the chronic inflammatory response [3]. In affected tissues, there is an increase in collagen deposition, accompanied by adipose and connective tissue overgrowth in the edematous regions [26].
Table 3.Continued
Gene ID Gene Symbol
LocusLink Accession ID
Gene Name Score
(d)a
Fold Change
q-Value (%)
AV070988 Mtch2 56428 mitochondrial carrier homolog 2 2.77 1.2 4.28
BG064794 Ftl1 14325 ferritin light chain 1 2.77 2.3 4.28
AI596209 Ror2 26564; 78531 receptor tyrosine kinase-like orphan receptor 2 2.77 1.4 4.28
AA815993 Acta2 11475 actin, alpha 2, smooth muscle, aorta 2.77 1.7 4.28
AV039554 Dmrtb1 56296 proline-rich protein 13 2.76 1.5 4.28
AV094728 eukaryotic translation initiation factor 4E 2.76 1.3 4.28
BG064454 Tax1bp3 76281 RIKEN cDNA 1300011C24 gene 2.76 1.4 4.28
AV006514 Ifnar2 15976 interferon (alpha and beta) receptor 2 2.76 1.5 4.28
AV086929 RIKEN cDNA 9430096L06 gene 2.75 1.8 4.28
BG063866 Finkel-Biskis-Reilly murine sarcoma virus (FBR-MuSV) ubiquitously expressed (fox-derived)
2.75 1.3 4.28
BG072299 2210401K01Rik 72289 receptor (calcitonin) activity modifying protein 2 2.75 1.4 4.28
412038 EST 2.75 1.4 4.28
BG067962 1110020C13Rik 66151 RIKEN cDNA 1110020C13 gene 2.75 1.4 4.28
412958 EST 2.75 1.4 4.28
AI226124 Itgb1 16412 integrin beta 1 (fibronectin receptor beta) 2.74 1.6 4.90
BG066897 Ubl5 66177 ubiquitin-like 5 2.74 1.2 4.90
AV067886 RIKEN cDNA 1810027O10 gene 2.74 1.5 4.90
AV086649 Gmnn 57441 geminin 2.73 1.7 4.90
AV023199 selenoprotein W, muscle 1 2.73 2.2 4.90
AV095185 Rps21 66481 RIKEN cDNA 2410030A14 gene 2.73 1.2 4.90
AV033362 1500040F11Rik 22272 RIKEN cDNA 1500040F11 gene 2.73 1.3 4.90
AW557788 Flna 192176 filamin-like protein 2.72 1.5 4.90
BG070952 Vkorc1l1 69568 RIKEN cDNA 2310024K08 gene 2.72 1.3 4.90
AV084361 RIKEN cDNA 1810036J22 gene 2.72 1.6 4.90
BG063730 A4galt 239559 ESTs 2.71 1.3 4.90
AV086045 Cox7c 12867; 18738 phosphatidylinositol transfer protein 2.71 1.5 4.90
BG063539 Rps20 67427 ribosomal protein S20 2.71 1.2 4.90
BG072985 Rpl7 19989 ribosomal protein L7 2.71 1.3 4.90
AV093845 Atp5e 67126 RIKEN cDNA 2410043G19 gene 2.71 1.6 4.90
BG068855 Rhoa 11848 ribosomal protein L13a 2.70 1.3 4.90
AV094701 Pnkp 59047 polynucleotide kinase 39-phosphatase 2.69 1.3 4.90
BG072570 Rplp2 67186 ribosomal protein, large P2 2.69 1.3 4.90
AV123125 Lgals1 16852 lectin, galactose binding, soluble 1 2.69 2.9 4.90
BG072625 ribosomal protein L19 2.68 1.4 4.90
AV058085 EST 2.68 1.2 4.90
AV008001 ESTs 2.68 1.5 4.90
AA796822 Siat4a 20442 sialyltransferase 4A (beta-galactosidase alpha-2,3-sialytransferase) 2.68 1.8 4.90
W71612 Rab11b 19326 RAB11b, member RAS oncogene family 2.68 1.5 4.90
BG063081 Tmsb10 19240 thymosin, beta 10 2.67 2.2 4.90
AV015233 ESTs 2.67 2.8 4.90
AV061059 Lyn 17096; 70720 Yamaguchi sarcoma viral (v-yes-1) oncogene homolog 2.67 2.1 4.90
AV094452 Dnclc1 56455 dynein, cytoplasmic, light chain 1 2.66 1.5 4.90
AV171729 EST 2.66 1.3 4.90
AV094762 0610042I15Rik 56418 prenylated SNARE protein 2.66 1.2 4.90
AV111434 Myl9 98932 transient receptor protein 2 2.65 1.5 4.90
AV020423 2900073G15Rik 67268 RIKEN cDNA 2900073G15 gene 2.65 1.4 4.90
BG064580 ESTs 2.65 1.3 4.90
AV033259 Hrmt1l2 15469 heterogeneous nuclear ribonucleoprotein methyltransferase-like 2 (S. cerevisiae)
2.65 1.5 4.90
AV171094 Tcf4 21413 transcription factor 4 2.65 1.4 4.90
412427 EST 2.64 1.7 4.90
AV149856 Pfn1 18643 profilin 1 2.64 1.5 4.90
AV149997 5730405M13Rik 66627 RIKEN cDNA 5730405M13 gene 2.63 1.4 4.90
AV013452 Expressed sequence AW743884 2.63 2.4 4.90
AV071157 ESTs 2.63 1.3 4.90
AV065302 membrane-associated protein 17 2.63 1.3 4.90
a
Table 4.Downregulated Genes in Lymphedema versus Normal Control (SAM, FDR,0.05)
Gene ID Gene Symbol
LocusLink Accession ID
Gene Name Score
(d)a
Fold Change
q-Value (%)
BG067123 Cdh1 12550 cadherin 1 14.33 2.27 0.91
BG074458 Dhcr24 74754 RIKEN cDNA 2310076D10 gene 11.37 2.17 0.91
AV008967 ferrochelatase 10.96 1.62 0.91
AV068725 Hod 74318; 330108 RIKEN cDNA 1200015P04 gene 9.82 1.44 0.91
AV030680 D7Ertd743e 233724 RIKEN cDNA 150031M19 gene 9.42 1.53 0.91
AI841373 Lxn 17035 latexin 8.82 1.97 0.91
BG066932 Grcc3f 14792 M. musculus,clone MGC:11670 IMAGE:3709076, mRNA, complete cds 7.61 1.60 0.91
411579 EST 7.55 1.89 0.91
AV087499 EST, moderately similar to A57474extracellular matrix protein 1 precursor (M. musculus)
7.48 1.41 0.91
AA607208 Cdh1 12550 cadherin 1 7.45 1.59 0.91
AV133742 EST 7.26 1.58 0.91
410895 EST 7.20 1.75 0.91
AV024056 Hal 15109 histindine ammonia lyase 7.20 1.39 0.91
410562 EST 6.90 1.77 0.91
BG069499 RIKEN cDNA 6330408J20 gene 6.75 1.31 0.91
AV017203 ESTs, highly similar toafadin (R. norvegicus) 6.64 1.66 0.91
BG066839 C80587 229504 Expressed sequence C80587 6.49 1.93 0.91
413288 EST 6.35 2.02 0.91
AV080417 Gsta4 14860 glutathione S-transferase, alpha 4 6.20 1.73 0.91
AV015934 Ccnd1 382098 cyclin D1 6.15 1.51 0.91
AV135760 434233 RIKEN cDNA 2600017P15 gene 6.08 1.37 0.91
AU040403 Krt1–5 16673 Expressed sequence AU040403 6.07 1.43 0.91
BG069581 Rhou 69581 ras homolog gene family, member U (M. musculus) 6.07 1.49 0.91
BG073053 D10Ertd214e 52637 protein tyrosine phosphatase, receptor type, f polypeptide 5.77 1.42 1.08
AI841275 3110006P09Rik 68036 RIKEN cDNA 2810030L11 gene 5.67 1.78 1.08
412117 EST 5.67 1.37 1.08
AV088691 Nrd1 230598 M. musculus,similar toN-arginine dibasic convertase 1 5.63 1.43 1.08
BG076206 Gng3lg 14705 G protein gamma 3 linked gene 5.61 1.29 1.08
AV074612 Cd164 53599 CD164 antigen 5.53 1.46 1.08
BG072568 Dusp14 56405 dual specificity phosphatase 14 5.52 1.43 1.08
AV081291 68539 RIKEN cDNA 1110006I15 gene 5.46 1.59 1.08
BG075873 67231 RIKEN cDNA 2810442O16 gene 5.44 1.86 1.08
AA111722 Ccnd1 12443 cyclin D1 5.42 1.54 1.08
AW552727 353049 fatty acid synthase 5.36 1.71 1.08
BG072524 Dgat2 67800 diacylglycerol O-acyltransferase 2 5.35 1.87 1.08
412975 EST 5.25 1.42 1.36
AV081155 Expressed sequence AV228068 5.23 1.74 1.36
BG071790 Ppp1cc 19047 protein phosphatase 1, catalytic subunit, gamma isoform 5.21 1.87 1.36
AA725946 keratin complex 1, acidic, gene 5 5.15 1.87 1.36
AV087069 Arhu 69581 ras homolog gene family, member U 5.09 1.75 1.36
AV085989 52637 Expressed sequence AU043390 5.06 1.69 1.36
BG071047 68036 RIKEN cDNA 3110006P09 gene 5.03 1.29 1.36
AV006223 Gsn 66623 gelsolin 5.03 1.81 1.36
AV106079 Gpsn2 106529 Expressed sequence AI173355 5.03 1.65 1.36
AV094491 108673 RIKEN cDNA 4933411H20 gene 4.92 1.46 1.36
AV057616 Atp6v1d 73834 ATPase, Hþ
transporting, lysosomal 34 kDa, V1 subunit D 4.92 1.46 1.36
AV084670 Vil2 22350 villin 2 4.91 1.65 1.36
BG071281 Lap3 66988 leucine aminopeptidase 3 4.89 1.36 1.36
AV022852 73731 RIKEN cDNA 1110001M24 gene 4.88 1.70 1.36
AV005044 Gltp 56356 glycolipid transfer protein 4.88 1.47 1.36
AW554387 Sgpl1 20397 sphingosine phosphate lyase 1 4.88 2.03 1.36
BG069739 Hmgcs1 208715 pre–B cell leukemia transcription factor 1 4.87 1.53 1.36
BG064974 Hsd17b12 56348 hydroxysteroid (17-beta) dehydrogenase 12 4.85 1.50 1.36
AV086231 Sprrl9 67718 small proline rich-like 9 4.83 1.75 1.59
411558 EST 4.80 1.22 1.59
AV032378 109305 M. musculus,similar to hypothetical protein FLJ14466 4.75 1.52 1.59
AV012833 105072 Expressed sequence AA407887 4.74 1.14 1.59
AV029122 Gpr56 14766 G protein-coupled receptor 56 4.73 1.51 1.59
BG071157 Pcyt1a 13026 phosphate cytidylyltransferase 1, choline, alpha isoform 4.68 1.43 1.73
AV088664 Cdh1 12550 cadherin 1 4.65 1.77 1.73
BG074432 Egfl5 230316 ESTs, weakly similar toLMA1 laminin alpha-1 chain precursor (M. musculus) 4.65 1.64 1.73
AV074709 Srebf1 20787 sterol regulatory element binding factor 1 4.63 1.86 1.73
AV043450 Erbb2ip 59079 Erbb2 interacting protein 4.62 1.64 1.73
AV036580 Gsn 227753 gelsolin 4.57 1.72 1.73
BG066848 Expressed sequence AI429612 4.54 1.57 1.73
Table 4.Continued
Gene ID Gene Symbol
LocusLink Accession ID
Gene Name Score
(d)a
Fold Change
q-Value (%)
BG070160 Rbm16 106583; 319358 Expressed sequence AI447644 4.48 1.35 1.96
413523 EST 4.46 1.62 1.96
BG072270 Tom1l2 216810 Expressed sequence AU042072 4.44 1.61 1.96
BG075104 Ecm1 13601 extracellular matrix protein 1 4.43 1.53 1.96
BG076113 1110002B05Rik 104725 RIKEN cDNA 3110040D16 gene 4.39 1.32 1.96
AV087190 Gsn 227753 gelsolin 4.38 1.52 1.96
AV134202 Mocs2 17434 molybdenum cofactor synthesis 2 4.35 1.56 2.28
BG076410 ESTs 4.34 1.51 2.28
411478 EST 4.32 1.44 2.28
412058 EST 4.31 1.34 2.28
AV143646 Rbbp6 19647 retinoblastoma binding protein 6 4.28 1.61
BG069784 Tcte1l 67117 RIKEN cDNA 2310075M16 gene 4.26 1.41 2.73
BG062974 104725 RIKEN cDNA 1110002B05 gene 4.25 1.75 2.73
BG075415 78334 Expressed sequence AW228747 4.25 1.44 2.73
BG064062 Klf4 16600 Kruppel-like factor 4 (gut) 4.23 1.83 2.73
BG075520 70174 Expressed sequence AW547365 4.18 1.26 2.73
AV020091 M. musculus,similar to hypothetical protein FLJ20552 4.17 1.56 2.73
BG075034 Hdac3 15183 histone deacetylase 3 4.15 1.39 2.73
AV057405 Mthfd2 17768 methylenetetrahydrofolate dehydrogenase (NADþ
dependent), methenyltetrahydrofolate cyclohydrolase
4.15 1.62 2.73
BG071256 70564 RIKEN cDNA 5730469M10 gene 4.12 1.39 2.73
AV053048 Sel1h 20338 Expressed sequence AW493766 4.10 1.49 2.73
BG063086 104725 RIKEN cDNA 1110002B05 gene 4.10 1.53 2.73
AV086552 Ube2g2 22213 ubiquitin-conjugating enzyme E2G 2 4.04 1.52 3.17
AV140482 230584 M. musculus,similar to hypothetical protein, clone MGC:6903 IMAGE:2655774 4.03 1.32 3.17
AV085956 Mgea5 76055 RIKEN cDNA 2310016E22 gene 4.00 1.46 3.17
BG063211 Expressed sequence AA408215 3.99 1.46 3.17
AV059238 ESTs 3.98 1.50 3.17
AV089020 2410001H17Rik 66990 RIKEN cDNA 2410001H17 gene 3.95 1.42 3.17
AW551596 76783 ESTs, moderately similar to KIAA0874 protein(H. sapiens) 3.95 1.44 3.17
BG063986 Chc1 100088 RIKEN cDNA 4931417M11 gene 3.94 1.36 3.17
AU016967 Slc31a1 20529 RIKEN cDNA 4930445G01 gene 3.94 1.43 3.17
AV057445 Hist2h3c1 15077 histone gene complex 2 3.94 1.92 3.17
BG064592 Dph2l2 67728 RIKEN cDNA 9130020C19 gene 3.93 1.64 3.17
AV086468 2810442O16Rik 67231 RIKEN cDNA 2810442O16 gene 3.90 1.65 3.24
AV012729 Srebf1 67231 sterol regulatory element binding factor 1 3.90 1.60 3.24
AV021055 8-Sep 20787 septin 8 3.89 1.48 3.24
BG074257 Atp6v1h 108664 Expressed sequence AU022349 3.89 1.28 3.24
BG063838 353049 fatty acid synthase 3.88 1.79 3.24
AV012338 1110058A 66195 RIKEN cDNA 1110058A15 gene 3.85 1.80 3.24
AV033310 Ss18 synovial sarcoma translocation, Chromosome 18 3.82 1.34 3.24
AV012385 Sprrl10 small proline rich-like 10 3.80 1.82 3.24
AV005017 Sult4a1 29859 sulfotransferase family 4A, member 1 3.80 1.42 3.24
AV084927 Sh3glb2 227700 M. musculusSH3GLB2 mRNA, complete cds 3.79 1.45 3.24
AV133665 Dnajb1 81489 DnaJ (Hsp40) homolog, subfamily B, member 1 3.79 1.63 3.24
BG063266 Gclc 14629 glutamate-cysteine ligase, catalytic subunit 3.78 1.27 3.24
BG075637 Nf2 18016 neurofibromatosis 2 3.78 1.25 3.24
BG063956 Etf1 225363 M. musculus, eukaryotic translation termination factor 1,
clone MGC:18745 IMAGE:3992883
3.78 1.31 3.24
BG072153 Mod1 17436 malic enzyme, supernatant 3.77 1.72 3.24
AV084064 Atp9a 11981; 436431 ATPase, class II, type 9A 3.76 1.64 3.53
BG065176 9130404D14Rik 227737 M. musculus,clone IMAGE:4038329, mRNA, partial cds 3.73 1.59 3.53
BG074922 Rnf167 70510 ring finger protein 167 3.71 1.29 3.53
BG075099 Rbbp6 19647 retinoblastoma binding protein 6 3.68 1.55 3.53
BG075709 Nt5c3 107569 RIKEN cDNA 2610206B05 gene 3.67 1.49 3.53
BG072411 Epb4.1l4b 54357 erythrocyte protein band 4.1-like 4b 3.66 1.51 3.53
AV085951 Calm4 80796 calmodulin 4 3.65 1.30 3.53
AV041686 Rmp 19777 RPB5-mediating protein 3.64 1.79 3.53
BG063540 Sypl 19027 pantophysin 3.63 1.32 3.73
BG063290 Nfe2l1 18023 nuclear factor, erythroid-derived 2-like 1 3.62 1.38 3.73
AF249870 Perp 64058 p53 apoptosis effector related to Pmp22 3.62 1.30 3.73
AV013952 1300007F 67477 RIKEN cDNA 1300007F04 gene 3.62 1.53 3.73
AV065655 Hod 74318; 330108 RIKEN cDNA 1200015P04 gene 3.60 1.61 3.73
BG074645 2210413I1 109004 ESTs, moderately similar to T42707 hypothetical protein DKFZp586EO41.1(H. sapiens)
3.59 1.44 3.73
BG063778 Dag1 13138 dystroglycan 1 3.58 1.30 3.73
Table 4.Continued
Gene ID Gene Symbol
LocusLink Accession ID
Gene Name Score
(d)a
Fold Change
q-Value (%)
BG068048 1110007A06Rik 68477 Hypothetical protein, clone MTA.D02.090 3.57 1.38 3.73
AV034519 Hmgcr 15357 3-hydroxy-3-methylglutaryl-coenzyme A reductase 3.54 1.48 3.73
AU020667 Uchl3 50933 ubiquitin carboxyl-terminal esterase L3 (ubiquitin thiolesterase) 3.54 1.31 3.73 AV094982 Rgs19ip1 67903 regulator of G-protein signaling 19 interacting protein 1 3.54 1.50 3.73
AA106674 Ltbp4 108075 RIKEN cDNA 2310046A13 gene 3.53 1.50 3.73
BG070746 1110067D22Rik 216551 RIKEN cDNA 1110067D22 gene 3.51 1.48 3.74
BG064041 0610011N22Rik 67433 RIKEN cDNA 0610011N22 gene 3.49 1.34 3.74
AV049386 0610039C 66853 RIKEN cDNA 0610039C21 gene 3.49 1.44 3.74
AI840878 Hod 74318; 330108 RIKEN cDNA 1200015P04 gene 3.49 1.54 3.74
AV105934 Sphk1 20698 sphingosine kinase 1 3.47 1.68 3.74
AV085893 D10Ertd21 52637 Expressed sequence AU043990 3.47 1.62 3.74
AA118482 Edg4 53978 endothelial differentiation, lysophosphatidic acid G-protein-coupled receptor 4 3.45 1.25 3.74 BG063967 9130207N01 212684 M. musculus,clone MGC:7094 IMAGE:3157493, mRNA, complete cds 3.44 1.48 3.74 AV031353 M. musculus,similar tophosphatidylserine decarboxylase,clone
MGC:7133 IMAGE:3158145,
3.44 1.70 3.74
AV162240 Irf3 54131 interferon regulatory factor 3 3.43 1.24 4.03
AV162274 3110001I2 70354 RIKEN cDNA 3110001I20 gene 3.42 1.92 4.03
BG072974 Neo1 18007 ESTs 3.40 1.53 4.03
AV005287 Scamp2 24044 secretory carrier membrane protein 2 3.37 1.19 4.03
AV089034 Expressed sequence AI316859 3.37 1.41 4.03
BG069319 Baz2a 116848 Expressed sequence AA415431 3.37 1.61 4.03
AV087585 Noc4 18117 neighbor of Cox4 3.36 1.35 4.03
AA863549 Notch1 18128 Notch gene homolog 1 (Drosophila) 3.36 2.07 4.03
BG075813 Hipk1 15257 homeodomain interacting protein kinase 1 3.36 1.38 4.03
BG075318 3100002M 69276 RIKEN cDNA 4933429H19 gene 3.35 1.29 4.03
AV024434 1200003E16Rik 66860 RIKEN cDNA 1200003E16 gene 3.35 1.66 4.03
BG074608 1110003H 68561 RIKEN cDNA 1300009F09 gene 3.34 1.41 4.03
AV084667 Tuft1 22156 tuftelin 1 3.33 1.56 4.03
AV087829 Clic3 69454 chloride intracellular channel 3 3.33 1.72 4.03
BG063343 Dhcr7 13360 7-dehydrocholesterol reductase 3.33 1.65 4.03
AV052668 1810018L0 70380 RIKEN cDNA 1810018L05 gene 3.32 1.51 4.03
AI194827 Osbpl1a 64291 oxysterol binding protein-like 1A 3.31 1.80 4.03
410847 EST 3.31 1.41 4.28
AV093444 Golga7 57437; 71655 hypothetical protein, MNCb-1213 3.29 1.25 4.28
BG076201 Vil2 22350 villin 2 3.29 1.29 4.28
AV021431 Mkrn1 54484 ESTs 3.29 1.39 4.28
BG072487 3110018K 73122 RIKEN cDNA 3110118K12 gene 3.27 1.37 4.28
AV084649 Ldb1 16825 LIM domain binding 1 3.27 1.36 4.28
AV081983 Hop 74318 RIKEN cDNA 1200015P04 gene 3.27 1.51 4.28
AV055811 Ugalt2 110172 UDP-galactose translocator 2 3.26 1.22 4.28
BG075832 Ccnd2 12444 cyclin D2 3.26 1.50 4.28
413170 EST 3.24 1.38 4.28
BG070048 Hipk1 15257 homeodomain interacting protein kinase 1 3.24 1.30 4.28
AV040013 Tes3 114893 Expressed sequence C85469 3.23 1.36 4.28
AV084288 Sprrl2 73722 small proline rich-like 2 3.22 1.60 4.90
AV093474 1300009F 66890 RIKEN cDNA 1300009F09 gene 3.19 1.35 4.90
AV149993 Rnf167 70510 ring finger protein 167 3.19 1.49 4.90
411517 EST 3.18 1.36 4.90
BG075876 Atp9a 11981; 436431 ATPase, class II, type 9A 3.18 1.31 4.90
BG075368 LOC21616 216169 M. musculus,similar to CGI-67 protein, clone MGC:11699 IMAGE:3964094, mRNA, complete cds
3.17 1.48 4.90
410554 EST 3.17 1.43 4.90
BG071335 5730469M 70564 RIKEN cDNA 5730469M10 gene 3.16 1.54 4.90
BG074934 2810037C 67211 RIKEN cDNA 2810037C14 gene 3.16 1.42 4.90
BG063413 CD2 antigen (cytoplasmic tail) binding protein 2 3.14 1.32 4.90
a