Using DNA Barcodes to Identify Road-Killed
Animals in Two Atlantic Forest Nature
Reserves, Brazil
Angélica H. Klippel1, Pablo V. Oliveira1, Karollini B. Britto1, Bárbara F. Freire1, Marcel R. Moreno2, Alexandre R. dos Santos1, Aureo Banhos1, Greiciane G. Paneto1
*
1Federal University of Espirito Santo, Centre of Agricultural Sciences, Alto Universitário, s/n, Guararema, Alegre, Espírito Santo, 29.500–000, Brazil,2Chico Mendes Institute of Biodiversity Conservation, Sooretama Biological Reserve, Highway BR-101, km 101, Linhares, Espírito Santo, 29.900–970, Brazil
Abstract
Road mortality is the leading source of biodiversity loss in the world, especially due to frag-mentation of natural habitats and loss of wildlife. The survey of the main species victims of roadkill is of fundamental importance for the better understanding of the problem, being nec-essary, for this, the correct species identification. The aim of this study was to verify if DNA barcodes can be applied to identify road-killed samples that often cannot be determined morphologically. For this purpose, 222 vertebrate samples were collected in a stretch of the BR-101 highway that crosses two Discovery Coast Atlantic Forest Natural Reserves, the Sooretama Biological Reserve and the Vale Natural Reserve, in Espírito Santo, Brazil. The mitochondrial COI gene was amplified, sequenced and confronted with the BOLD data-base. It was possible to identify 62.16% of samples, totaling 62 different species, including Pyrrhura cruentata,Chaetomys subspinosus,Puma yagouaroundiandLeopardus wiedii considered Vulnerable in the National Official List of Species of Endangered Wildlife. The most commonly identified animals were a bat (Molossus molossus), an opossum (Didelphis aurita) and a frog (Trachycephalus mesophaeus) species. Only one reptile was identified using the technique, probably due to lack of reference sequences in BOLD. These data may contribute to a better understanding of the impact of roads on species biodiversity loss and to introduce the DNA barcode technique to road ecology scenarios.
Introduction
Road mortality has been one of the main causes of vertebrate species biodiversity loss [1,2]. It can reduce population abundance as wildlife–vehicle collisions add an extra toll to background mortality rates, reducing gene flow by eliminating either dispersing and/or breeding individu-als [3]. Road-killed species are good representatives of the actual diversity of species of a partic-ular site [4]. Genetic identification of multiple target species can also access road effects in
a11111
OPEN ACCESS
Citation:Klippel AH, Oliveira PV, Britto KB, Freire BF, Moreno MR, dos Santos AR, et al. (2015) Using DNA Barcodes to Identify Road-Killed Animals in Two Atlantic Forest Nature Reserves, Brazil. PLoS ONE 10(8): e0134877. doi:10.1371/journal.pone.0134877
Editor:MatjažKuntner, Scientific Research Centre, Slovenian Academy of Sciences and Arts, SLOVENIA
Received:April 10, 2015
Accepted:July 14, 2015
Published:August 5, 2015
Copyright:© 2015 Klippel et al. This is an open access article distributed under the terms of the Creative Commons Attribution License, which permits unrestricted use, distribution, and reproduction in any medium, provided the original author and source are credited.
Data Availability Statement:All relevant data are within the paper and its Supporting Information files.
Funding:This work was supported by the Conselho Nacional de Desenvolvimento Científico e
Tecnológico–CNPq (grant number 475862/2012-0;
www.cnpq.br) and the Fundação de Amparo à Pesquisa e Inovação do Espírito Santo–FAPES
species composition [5]. For those reasons, identification of these samples in road ecology stud-ies is of great relevance, especially in natural reserves.
The Discovery Coast Atlantic Forest Reserves (DCAFR) are World Heritage Sites that con-sist of eight separate protected areas containing 112,000 ha of Atlantic forest and displays the biological richness and evolutionary history of the few remaining areas of Atlantic forest of Northeast Brazil, in Bahia and of Southeast Brazil, in Northern Espírito Santo [6]. Located in Espírito Santo are two DCARFs, the Sooretama Biological Reserve (SBR) and the Vale Natural Reserve (VNR) (also called Linhares Forest Reserve) which are protected areas of old Brazil, the conservation history of these areas dates from the 1940s [7]. These reserves form an Atlan-tic forest block measuring approximately 50,000 ha of table lands that since the late 1960s are crossed by a 25 kilometer stretch of federal highway called BR-101, fragmenting wildlife popu-lations and causing high mortality by roadkill. Today, this highway is one of the most impor-tant and busiest in Brazil. There is a major concern about the potential loss of biodiversity due to the large amount of fauna and flora present in these reserves as well as about road expansion plans in the coming years.
The stretch that crosses the reserves has been monitored with some projects developed to evaluate the impact of this road stretch on the local fauna. However, a major obstacle found so far is that many animals are extremely disfigured after road-kills, hindering in many cases, their morphological identification.
Classical methods for species identification are based on morphological characteristics and depend on the knowledge of taxonomists who are usually experts in a particular group of organisms. Such professionals are difficult to find in today’s market [8,9] and many of the used methods require quality information (adult individuals with intact morphology) [10], which does not allow the identification of juveniles or fragmented exemplars. These factors represent obstacles to reliable species-level identification on a large scale and routinely performed. Another important issue is the existing high rates of biodiversity loss what makes necessary to accelerate the acquisition of knowledge regarding this topic [11] since many species will become extinct even before taxonomically recorded [12]. Although molecular methods may not replace traditional taxonomy, they can assist in solving this problem [13].
Knowing these conditions, DNA barcoding may be a powerful tool to solve or, at least, help on it. DNA barcodes uses, for animals, a specific region of the mitochondrial (mt) gene encod-ing cytochrome c oxidase subunit 1 (COI) to identify a species [14,15]. DNA barcodes from dif-ferent species (deposited in museums or other institutions and previously identified by
taxonomists) are being compiled in an online platform calledBarcode of Life Data Systems
(BOLD) (http://www.boldsystems.org/) [16] that promise to be the source of identification of all or most of the described species.
Within this context, the aim of this study was to verify whether DNA barcoding can be applied to identify road-killed samples.
Materials and Methods
Ethics statement
This study was approved by Instituto Chico Mendes de Conservação da Biodiversidade (ICM-Bio) in accordance with the Brazilian law (Permit Number: SISBIO31762-1).
Study site and sample collection
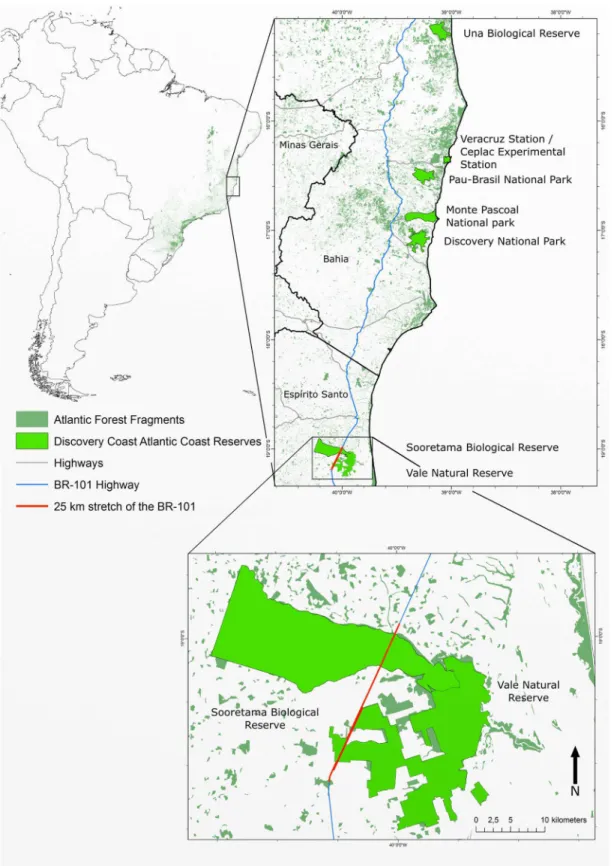
SBR and VNR are located in Northern Espírito Santo State in South-Eastern Brazil, which is situated between 18°53'40'' and 19°15'20'' S latitude and 39°44'32'' and 40°16'51'' W longitude (Fig 1).
Fig 1. Map locating the Sooretama Biological Reserve and the Vale Natural Reserve in Southeast Brazil.Twenty-five kilometer stretch of BR 101 stretch of the BR-101 that intercepts SBR and VNR is showed in red double line. Note. Map generated with GRASS GIS, version 7.0. Layout generated with Inkscape vector graphics software, version 0.91. Sources: Instituto Brasileiro de Geografia e Estatística (IBGE); Departamento Nacional de Infraestrutura de Transportes (DNIT); Instituto Chico Mendes de Conservação da Biodiversidade (ICMBio); Reserva Natural Vale (RNV); United Nations Organization for
Education, Science and Culture (UNESCO); United Nations Environment Programme's World Conservation Monitoring Centre (UNEP-WCMC).
In this work, tissue samples from 222 road-killed animals were collected within the 25 kilo-meter stretch of the BR-101 that intercepts SBR and VNR, from April 2011 to July 2014. From these, 179 samples were part of known taxonomic groups (non-volant mammals, bats, birds, amphibians and reptiles) and 43 samples were from unknown taxonomic groups. Eighty-nine samples had photographic registry and 133 had no photo. Photos were used for previous mor-phological species identification and the results were compared to DNA barcoding identifica-tions. These data are part of the roadkill monitoring held since 2010 on foot and by car. During monitoring, road-killed animals were registered and photographed, collection date and taxo-nomic group were noted. Tissue samples (skin and/or muscle) were collected and placed in a microtube with 70% alcohol and stored in a refrigerator (4°C) until analysis. Then, samples were deposited in a curated reference collection (Coleção de Tecidos Animais da Universidade Federal do Espírito Santo, reference number 2654–2838). When possible and in good condi-tion, whole specimens were collected and stored. However, these specimens were not analyzed in this study because they were easily identified morphologically.
DNA extraction, amplification and data processing
DNA was extracted from about 30 mg of animal tissue using NucleoSpin Tissue (Macherey-Nagel) and quantified using Nanodrop 2000 UV-Vis Spectrophotometer (Thermo Scientific). Primer pairs LCO1490 and HCO2198 were used for amplification of the mitochondrial cyto-chrome c oxidase I gene (COI) [17]. Alternative primers (BirdF1 and BirdR1; Chmf4 and Chmr4) were used when necessary [18,19]. PCR master mix was carried out using 8μL
ultra-pure water, 1.25μL of 10X Buffer PCR (Invitrogen Life Technologies), 2.5 mM MgCl2 (Invitro-gen Life Technologies), 50μM dNTPs, 100 nM of each primer and 1 Unit of Platinum Taq
DNA polymerase (Invitrogen Life Technologies) making up a final volume of 12.5μL mix for
each sample. Samples were loaded onto Veriti thermo-cycler (Life Technologies). The thermal profile for all reactions consisted of 94°C for 1 minute, followed by 5 denaturation cycles at 94°C for 30 seconds, primer annealing at 45°C for 40 seconds, and extension at 72°C for 1 min-ute. Samples were submitted to 35 denaturation cycles at 94°C for 30 seconds, annealing of primers at 51°C for 40 seconds and extension at 72°C for 1 minute. A final cycle extension of 10 minutes at 72°C was included, followed by 4°C.
Negative controls were run in all PCR sets for possible reagent contamination. PCR prod-ucts were electrophoresed through 1.2% agarose gel stained with ethidium bromide and visual-ized on an UV trans-illuminator. PCR products were enzymatically cleaned with ExoSap-IT (USB Corporation). Cleaned products were sequenced using BigDye Terminator v3.1 (Life Technologies) according to manufacturer’s protocols and analyzed using ABI 3500 Genetic Analyzer (Life Technologies).
Sequence analyses
Electropherograms were generated in Sequence Analysis Software (Life Technologies) and edited using BioEdit Sequence Alignment Editor v7.0.5.3 [20]. Sequences were classified as
“good quality electropherograms”when more than 90% of bases showed QV>20 and“poor
quality electropherograms”when most of bases had QV<20. Good quality sequences were
Results
Identification efficiency using DNA barcodes and BOLD
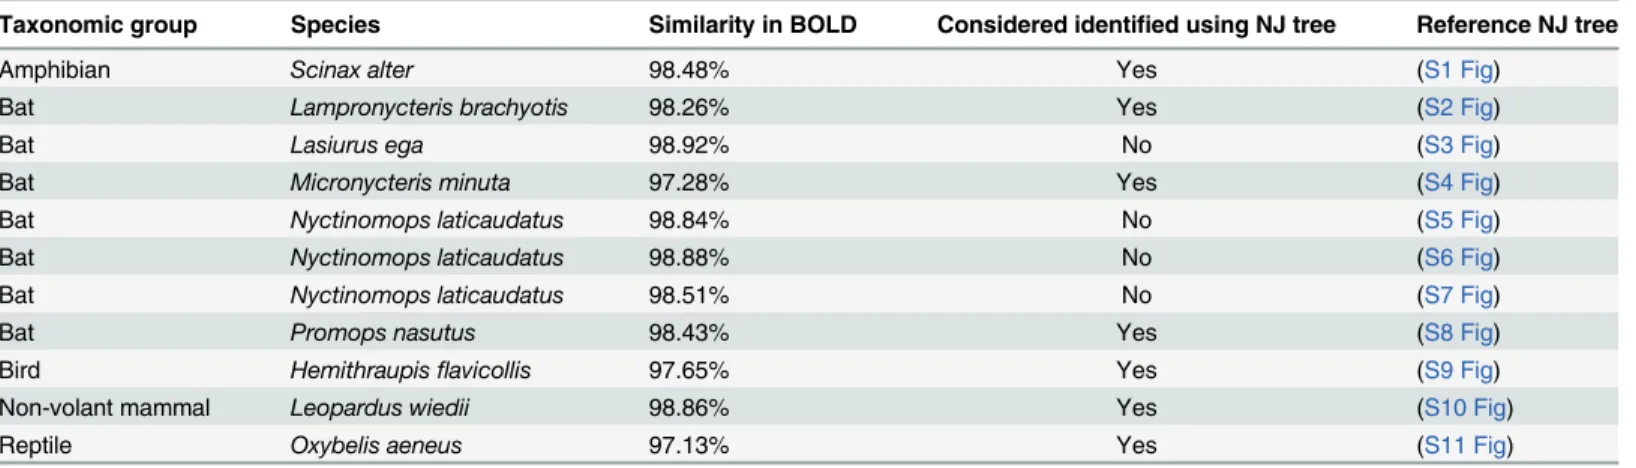
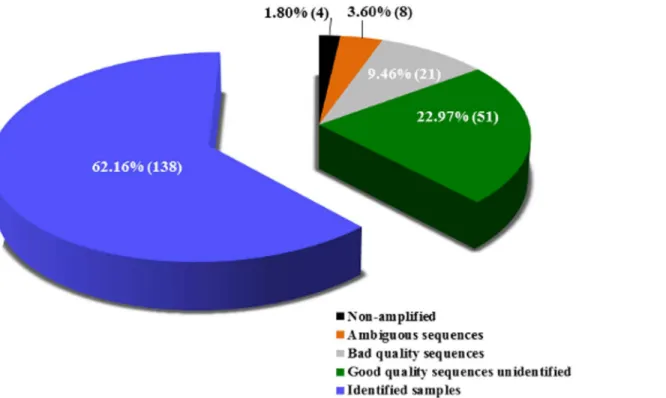
Of 222 tested samples, 138 (62.16%) could be identified using DNA barcoding and BOLD (Table 1). From these, 131 samples showed similarity>99% and seven had<99% in BOLD
database. In the last case, the NJ tree was analyzed to consider the sample identified (Table 2). Eighty-four (37.84%) could not be identified at all: 51 (22.97%) samples generated good quality electropherograms, but they could not be identified in BOLD (“no match”was obtained, with exception of four samples with a match<99% but reproved in NJ tree analysis) (Table 2), 21
(9.46%) generated poor quality electropherograms even by repeating the technique, eight (3.60%) generated ambiguous identification and four (1.80%) did not amplify (Fig 2,Table 1
andS1 Table).
With regards to a prior taxonomic group classification, 35 (87.50%) of 40 samples of non-volant mammals were identified by DNA barcoding, 28 (56.00%) of 50 bats, 14 (66.67%) of 21 amphibians, 35 (87.50%) of 40 birds and 26 (60.46%) of 43 samples of unknown taxonomic groups. None of the 28 reptile (previously classified taxonomically) were identified using the technique described, although most samples (26 samples; 92.86%) exhibited good quality sequences (Table 1&S1 Table).
Table 1. Number of identified and unidentified species (and percentages) classified in taxonomic groups.
Taxonomic group
N° of samples
Identified samples (%)
Good quality
sequence unidentified (%)
Bad quality seguence unidentified (%)
Ambiguous sequences
Non-amplified
N° of species identified
Non-volant mammals
40 35 (87.50%) 0 (0.00%) 3 (7.50%) 1 (2.50%) 1 (2.50%) 13
Bats 50 28 (56.00%) 11 (22.00%) 8 (16.00%) 2 (4.00%) 1 (2.00%) 14
Amphibians 21 14 (66.66%) 2 (9.52%) 3 (14.28%) 1 (4.76%) 1 (4.76%) 4
Birds 40 35 (87.50%) 1 (2.50%) 1 (2.50%) 3 (7.50%) 0 (0.00%) 25
Reptiles 28 0 (0.00%) 26 (92.86%) 2 (7.14%) 0 (0.00%) 0 (0.00%) 0
Unknown 43 26 (60.46%) 11 (25.58%) 4 (9.30%) 1 (2.32%) 1 (2.32%) 13*
Total 222 138 (62.16%) 51 (22.97%) 21 (9.46%) 8 (3.60%) 4 (1.80%) 62
*Six species identified exclusively in the Unknown taxonomic group Where N° is the number
doi:10.1371/journal.pone.0134877.t001
Table 2. Samples with less than 99% similarity after confronting sequences in BOLD.
Taxonomic group Species Similarity in BOLD Considered identified using NJ tree Reference NJ tree
Amphibian Scinax alter 98.48% Yes (S1 Fig)
Bat Lampronycteris brachyotis 98.26% Yes (S2 Fig)
Bat Lasiurus ega 98.92% No (S3 Fig)
Bat Micronycteris minuta 97.28% Yes (S4 Fig)
Bat Nyctinomops laticaudatus 98.84% No (S5 Fig)
Bat Nyctinomops laticaudatus 98.88% No (S6 Fig)
Bat Nyctinomops laticaudatus 98.51% No (S7 Fig)
Bat Promops nasutus 98.43% Yes (S8 Fig)
Bird Hemithraupisflavicollis 97.65% Yes (S9 Fig)
Non-volant mammal Leopardus wiedii 98.86% Yes (S10 Fig)
Reptile Oxybelis aeneus 97.13% Yes (S11 Fig)
Identified species
The 138 samples identified in this study encompassed 62 different animal species: 13 non-volant mammals, 14 bats, four amphibians, 25 birds and six of previously taxonomic group unknown (one non-volant mammal, two amphibians, one bat, one bird and one reptile) (Table 1). The most commonly identified animals species were a bat (Molossus molossus), an opossum (Didelphis aurita) and a frog (Trachycephalus mesophaeus) species (Table 3).
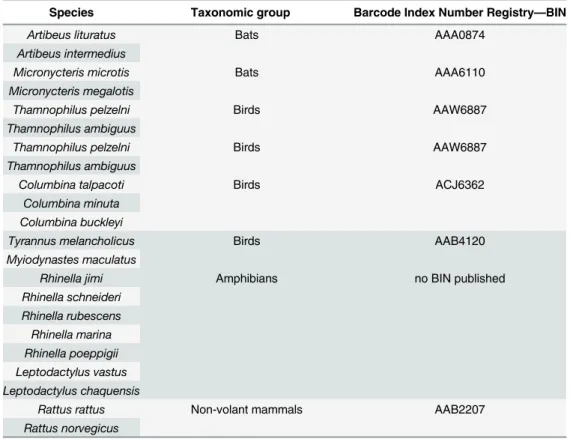
Ambiguous sequences
Ambiguous identification occurred in eight (3.6%) samples (Table 1), with BOLD
reporting>99% similarity to more than one species, thereby precluding the identification
(Table 4).
Discussion
Identified species
All 62 identified species were previously recorded in the studied area [21] or in the North of Espírito Santo State [22–31]. Therefore, the presence of all species confirmed in the region reinforces the molecular results.
The identified speciesPyrrhura cruentata and Chaetomys subspinosusare considered Vulner-able–VU and theLeopardus wiediiis classified as Near Threatened—NT in the IUCN Red List of Threatened Species (2015). In Brazil, these three species and alsoPuma yagouaroundiare con-sidered VU in the National Official List of Species of Endangered Wildlife [32]. This fact is very alarming since wildlife road-kill collaborates to the decline of populations making their recovery
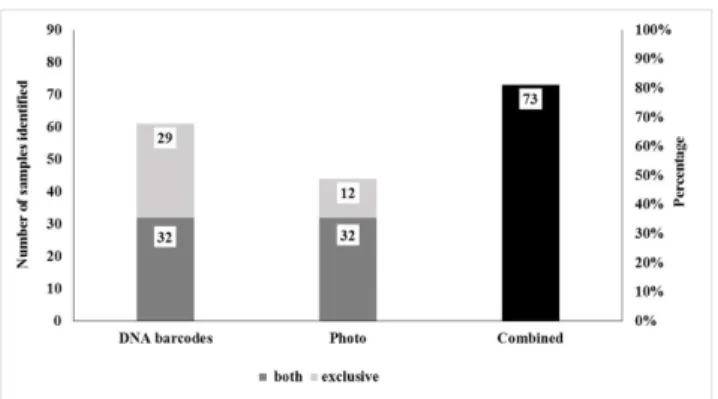
Fig 2. Percentage and absolute number of identified and unidentified samples in this study.
Table 3. List of species, taxonomic group and number of samples identified using only DNA barcod-ing in this study.
Species—DNA Barcoding Taxonomic group Number of samples
Aparasphenodon brunoi amphibian 4
Hypsiboas faber amphibian 1
Scinax alter amphibian/a 2
Trachycephalus mesophaeus amphibian 12
Hypsiboas semilineatus amphibiana 1
Leptodactylus natalensis amphibiana 1
Artibeus gnomus bat 1
Carollia perspicillata bat 1
Chiroderma villosum bat 2
Lampronycteris brachyotis bat 1
Lophostoma brasiliense bat 1
Micronycteris minuta bat 1
Molossus molossus bat 19
Molossus rufus bat 1
Myotis riparius bat 1
Promops nasutus bat 2
Rhinophylla pumilio bat 1
Saccopteryx bilineata bat 2
Trachops cirrhosus bat 1
Vampyressa pusilla bat 1
Anoura geoffroyi bata 1
Buteo magnirostris bird 2
Cairina moschata bird 1
Coccyzus melacoryphus bird 1
Coragyps atratus bird 1
Crotophaga ani bird 1
Dacnis cayana bird 1
Dixiphia pipra bird 1
Euphonia violacea bird 3
Euphonia xanthogaster bird 1
Hemithraupisflavicollis bird 1
Lepidocolaptes squamatus bird 1
Megascops choliba bird 1
Myrmotherula axillaris bird 4
Nyctidromus albicollis bird 1
Pachyramphus polychopterus bird 2
Patagioenas picazuro bird 1
Piaya cayana bird 1
Pipra rubrocapilla bird 4
Porphyrio martinica bird 1
Pteroglossus aracari bird 2
Pyrrhura cruentata* bird 1
Saltator maximus bird 2
Tangara seledon bird 1
Turdus leucomelas bird 1
Vireo olivaceus bird 1
Table 3. (Continued)
Species—DNA Barcoding Taxonomic group Number of samples
Tapera naevia birda 1
Bradypus variegatus non-volant mammals 1
Callithrix geoffroyi non-volant mammals 3
Cerdocyon thous non-volant mammalsa 1
Chaetomys subspinosus* non-volant mammals 1
Cuniculus paca non-volant mammals 6
Dasypus septemcinctus non-volant mammals 1
Didelphis aurita non-volant mammals 16
Gracilinanus microtarsus non-volant mammals 2
Marmosa murina non-volant mammals 2
Marmosops incanus non-volant mammals 3
Puma yagouaroundi non-volant mammals 1
Sylvilagus brasiliensis non-volant mammals 2
Leopardus wiedii** non-volant mammalsa 2
Tamandua tetradactyla non-volant mammalsa 1
Oxybelis aeneus reptilea 1
aTaxonomic group previously unknown
*Vulnerable in IUCN Red List **Near Threatened in IUCN Red List
doi:10.1371/journal.pone.0134877.t003
Table 4. Ambiguous species identification obtained after BOLD analysis.
Species Taxonomic group Barcode Index Number Registry—BIN
Artibeus lituratus Bats AAA0874
Artibeus intermedius
Micronycteris microtis Bats AAA6110
Micronycteris megalotis
Thamnophilus pelzelni Birds AAW6887
Thamnophilus ambiguus
Thamnophilus pelzelni Birds AAW6887
Thamnophilus ambiguus
Columbina talpacoti Birds ACJ6362
Columbina minuta Columbina buckleyi
Tyrannus melancholicus Birds AAB4120
Myiodynastes maculatus
Rhinella jimi Amphibians no BIN published
Rhinella schneideri
Rhinella rubescens
Rhinella marina
Rhinella poeppigii Leptodactylus vastus
Leptodactylus chaquensis
Rattus rattus Non-volant mammals AAB2207
Rattus norvegicus
difficult, especially to endangered species [33,1]. It indicates the importance of road-killed spe-cies’identification in DCAFRs, which was possible with the method applied in this study.
Unidentified species
Some good quality DNA sequences (n = 51) could not be identified in BOLD demonstrating the absence of reference sequences for some species [34]. Most of the unidentified sequences were from reptiles (n = 28). Thus, most reptiles could not be identified in this study (with exception of one sample) due to the lack of reference sequences in BOLD. This was evidenced by the lack of studies covering this taxonomic group using COI gene [35]. The percentage of amphibian identification (66.66%) was also relatively low compared to the successful identifi-cation of non-volant mammals (87.50%) and bird samples (87.50%). The reason may be the fact that for reptiles and amphibians the 16S rDNA gene is more commonly used nowadays than COI, since the 16S fragment is considered superior to COI. In addition, it can be
explained by methodological challenges caused by high mitochondrial DNA sequence variabil-ity, including PCR priming sites [36–38].
Despite this, some recent studies showed that COI is still a better marker for certain groups, such as species of salamanders [39]. Initiatives have been promoted to increase the number of reference sequences of reptiles and amphibian species in BOLD [35]. The identification of bats was also relatively low (56%), most of the sequences not identified in this group showed good quality electropherograms (n = 11; 22%). In spite of having a considerable amount of bat sequences deposited in BOLD [40,41], apparently it was not enough to identify all samples ana-lyzed in this study.
Further efforts should be made to deposit sequences from specific biomes such as the Atlan-tic Forest, characterized by the presence of numerous endemic species and many others of restricted distributions [42,43]. In 2012, the National Research Council—CNPq founded the BrBol—Brazilian Network for Molecular Identification of Biodiversity, which aims to increase the number of COI sequences of neotropical species deposited in BOLD (brbol.org). This may be promising to improve the identification of roadkilled samples in the region.
Ambiguous sequences
To verify the reasons for ambiguities, the BIN (Barcode Index Number) was checked. BIN is the result of an analysis method that applies clustering algorithms to distinguish partitions in the genetic distance among a group of individuals, creating a final array of OTUs (Operational Taxonomic Unit) that closely reflects species groupings. According to Ratnasingham & Hebert [44], cases of discordance between BIN assignments and current taxonomy reflect taxonomic errors, sequence contamination, the inability of sequence variation at COI to diagnose species because of introgression or their young age or deficits in Refined Single Linkage algorithms.
In this work, a bat sample was ambiguous toArtibeus lituratusandArtibeus intermedius. Clare et al. [40], for example, failed to distinguish these two species using COI gene in a study of 163 neotropical bat species. Another bat sample was also ambiguous betweenMicronycteris megalotisandMicronycteris microtis, and both occur in the region of this study. Clare et al. [40] distinguished these two species using COI, but did not find interspecific divergence between them and neither intraspecific divergence withinMicronycteris microtis. However,
Two bird samples were ambiguous betweenThamnophilus pelzelniandThamnophilus ambiguus. Some morphological characteristics overlap considerably and may cause errors in identification. They are most easily distinguished by subtle and localized changes in plumage colors of males and females [46]. Lacerda et al. [47] suggest that the genetic divergence (using sequences of the Control Region, Cytochrome b and ND2 genes) found betweenThamnophilus ambiguusandThamnophilus pelzelniis high enough to corroborate the separate species status of these two antbird taxa. The geographical region studied is part of the distribution area of the
Thamnophilus ambiguus, that is endemic to southeast Brazil and do not overlap the distribu-tion area of theThamnophilus pelzelnia [46]. Another bird was assigned asTyrannus melanch-olicusandMyiodynastes maculatus, but it appears that the species isTyrannus melancholicus
since only one specimen ofM.maculatesis assigned in the BIN. The third bird sample was ambiguous amongColumbina talpacoti,Columbina minutaandColumbina buckleyi.
One sample was ambiguous amongRhinella jimi,Rhinella schneideri,Rhinella rubescens,
Rhinella marinaandRhinella poeppigii. However, onlyRhinella jimiandRhinella schneideri
are known species in Espírito Santo [29].
One sample was ambiguous betweenRattus rattusandRattus norvegicus, although, it appears that the correct classification isRattus rattussince only one specimen ofRattus norve-gicuswas assigned in the suggested BIN. At this point, it is important to highlight thatRattus rattusis an exotic species in the area what pinpoints the road as a route to the introduction of exotic species to protected areas.
Low quality sequences and samples not amplified
Another relevant issue is that some samples (n = 21) had DNA amplified but generated low quality electropherograms and four did not amplify (even by repeating all the steps). It could be due to the exposure of biological material to climate action and repeated road-kills (more than once), compromising the quality of the material analyzed. It should be stressed that a 650-bp fragment of COI gene is difficult to amplify in degraded DNA samples [48]. However, we believe that the quality of sequences could be improved by a cautious protocol of collecting and storing samples, such as using 96% ethanol and below zero temperatures or using FTA Elute Card [49], and also those used for non-invasive sample collection [50]. The use of primer cocktails available [51] can increase the efficiency of barcode recovery and have demonstrated utility in a series of studies on different vertebrate groups [52,53]. A set of primers that amplify smaller fragments encompassing the entire region to be examined can also generate better results. On the other hand, it makes the work time consuming and laborious given that road-killed animal analysis involves a very wide range of taxonomic groups.
Importance of the DNA barcoding technique to road-killed animal
’
s
identification
Road-killed animal studies based on morphology identification have been often carried out in road ecology studies e.g., [54–56]. However, in many situations where animals were disfigured, it is not possible to carry out morphological identifications. Therefore, current DNA barcoding technique success seems to generate good results when compared to morphological
identification.
identified using DNA barcodes, while only 23 species were identified by photos. However, by combining both methods, DNA barcodes and photos, it was possible to identify 73 (82.02%) samples and 42 species (Figs3and4).
From the eight species identified solely by photo, six had no reference sequences in BOLD: five of them generated good quality sequences (electropherograms), including three species of reptiles (Epicrates cenchria,Pseudoboa nigraandTyphlops brongersmianus), one of bat ( Pro-mops nasutus), one of bird (Tinamus solitarius), and one sample that generated poor quality sequence, a non-volant mammal (Sphiggurus insidiosus). Two species had their reference sequences deposited in BOLD but one sample generated a poor quality sequence, a bat ( Centro-nycteris maximiliani), and three samples generated good quality sequences, another bat ( Nycti-nomops laticaudatus). However, although they kept 98.84, 98.88 and 98.51% of similarity to the species in BOLD, the identification was not confirmed using the NJ tree option in BOLD (Table 2). Thus, besides highlighting few shortcomings of reference sequences in BOLD, it was also confirmed the existence of gaps in the system, which does not allow the identification of many species (no match found), especially for reptiles.
Despite the current limitations in applying DNA barcodes, the results show that this method can be applied with relative success in road ecology studies. They can also provide important inputs to the work undertaken at Discovery Coast Atlantic Forest Reserves, which may serve to improve the understanding of the BR-101 highway impacts on species in this World Heritage Site. More importantly, identification of road-killed species can help to develop preventive mea-sures focused on the animals most affected by road-kill and on endangered species.
Fig 3. Number of samples and percentage of samples identified using DNA barcoding, photo identification and combined methods, respectively.
doi:10.1371/journal.pone.0134877.g003
Fig 4. Number of species identified using DNA barcoding, photo identification and combined methods.
Data Accessibility
GenBank accession number: KR005651; KR017933 through KR017960; KT236170 through KT236278.
Supporting Information
S1 Fig. Neighbor-joining tree of K2P distances forScinax alter.
(PDF)
S2 Fig. Neighbor-joining tree of K2P distances forLampronycteris brachyotis.
(PDF)
S3 Fig. Neighbor-joining tree of K2P distances forLasiurus ega.
(PDF)
S4 Fig. Neighbor-joining tree of K2P distances forMicronycteris minuta.
(PDF)
S5 Fig. Neighbor-joining tree of K2P distances forNyctinomops laticaudatus(sample 1).
(PDF)
S6 Fig. Neighbor-joining tree of K2P distances forNyctinomops laticaudatus(sample 2).
(PDF)
S7 Fig. Neighbor-joining tree of K2P distances forNyctinomops laticaudatus(sample 3).
(PDF)
S8 Fig. Neighbor-joining tree of K2P distances forPromops nasutus.
(PDF)
S9 Fig. Neighbor-joining tree of K2P distances forHemithraupis flavicollis.
(PDF)
S10 Fig. Neighbor-joining tree of K2P distances forLeopardus wiedii.
(PDF)
S11 Fig. Neighbor-joining tree of K2P distances forOxybelis aeneus.
(PDF)
S1 Table. Information about 222 samples analyzed in this work (taxonomic group, species identified by DNA barcoding and species identified by photos).
(DOC)
Acknowledgments
We thank Yuri Luiz Reis Leite and Juliana de Freitas Justino from Núcleo de Genética Aplicada à Conservação da Biodiversidade—NGACB/UFES for technical support, Ruan Preato Deo-lindo for technical support in collecting samples on the highway and all professionals from Sooretama Biological Reserve and the Vale Natural Reserve who helped us in implementing this project.
Author Contributions
References
1. Trombulak CS, Frissel AC. Review of ecological effects of roads on terrestrial and aquatic communities. Conserv Biol. 2000; 14: 18–30. doi:10.1046/j.1523-1739.2000.99084.x
2. Vadivalagan C, Gunasekaran C, Salahudeen I. Molecular phylogeny of recurrent road killed butterflies in Nilgiri biosphere reserve, India, using CO1 gene marker. Afr J Biotechnol. 2012; 11: 14433–14439.
3. Jackson ND, Fahrig L. Relative effects of road mortality and decrease connectivity on population genetic diversity. Biol. Conserv. 2011; 144, 3143–3148.
4. Vadivalagan C, Gunasekaran C, Salahudeen I. Molecular phylogeny of recurrent road killed butterflies in Nilgiri biosphere reserve, India, using CO1 gene marker. Afr J Biotechnol. 2012; 11: 14433–14439.
5. Balkenhol N, Waits LP. Molecular road ecology: exploring the potential of genetics for investigating transportation impacts on wildlife. Mol Ecol. 2009; 18: 4151–4164. doi:10.1111/j.1365-294X.2009. 04322.xPMID:19732335
6. United Nations Educational, Scientific and Cultural Organization. Convention concerning the protection of the world cultural and natural heritage world heritage committee. Twenty-third session Marrakesh, Morocco; 1999. Available:http://whc.unesco.org/archive/1999/whc-99-conf209-22e.pdf. Accessed 09 March 2015
7. Instituto Brasileiro de Desenvolvimento Florestal. Plano de Manejo Reserva Biológica de Sooretama; 1981. Available:http://www.icmbio.gov.br/portal/images/stories/docs-planos-de-manejo/rebio_ sooretama_pm.pdf. Accessed 09 March 2015
8. Hopkins GW, Freckleton RP. Declines in the numbers of amateurs and professional taxonomists: impli-cations for conservation. Anim Conserv. 2002; 5: 245–249.
9. Jinbo U, Kato T, Ito M. Current progress in DNA barcoding and future implications for entomology. Ento-mol Sci. 2011; 14: 107–124. doi:10.1111/j.1479-8298.2011.00449.x
10. Fišer Pečnikar Z, Buzan EV. 20 years since the introduction of DNA barcoding: from theory to applica-tion. J Appl Genet. 2014; 55: 43–52. doi:10.1007/s13353-013-0180-yPMID:24203863
11. Savage JM. Systematics and the Biodiversity Crisis: There is an urgent need for an accelerated accu-mulation of knowledge about biodiversity. Bio Sci. 1995; 45: 673–679. doi:10.2307/1312672
12. Mora C, Tittensor DP, Adl S, Simpson AGB, Worm B. How many species are there on Earth and in the ocean? PLoS Biol. 2011; 9: 1–8. doi:10.1371/journal.pbio.1001127
13. Padial JM, Miralles A, De la Riva I, Vences M. The integrative future of taxonomy. Front Zool. 2010; 7: 1–14.
14. Miller SE. DNA barcoding and the Renaissance of taxonomy. Proc Natl Acad Sci USA. 2007; 104: 4775–4776. doi:10.1073/pnas.0700466104PMID:17363473
15. Hebert PDN, Ratnasingham S, de Waard JR. Barcoding animal life: cytochrome c oxidase subunit 1 divergences among closely related species. Proc R Soc. 2003; 270: S96–S99. doi:10.1098/rsbl.2003. 0025
16. Ratnasingham S, Hebert PDN. BOLD: The Barcode of Life Data System (http://www.barcodinglife.org). Mol Ecol Notes 2007; 7: 355–364. PMID:18784790
17. Folmer O, Black M, Hoeh W, Lutz R, Vrijenhoek R. DNA primers for amplification of mitochondrial cyto-chrome c oxidase subunit I from diverse metazoan invertebrates. Mol Mar Biol Biotechnol. 1994; 3: 294–299. PMID:7881515
18. Hebert PDN, Stoeckle MY, Zemlak TS, Francis CM. Identification of Birds through DNA Barcodes. Plos Biol. 2004; 2:1657–1663. doi:10.1371/journal.pbio.0020312
19. Che J, Chen HM, Yang JX, Jin JQ, Jiang K, Yuan ZY, et al. Universal COI primers for DNA barcoding amphibians. Mol Ecol Resour. 2012; 12: 247–258. doi:10.1111/j.1755-0998.2011.03090.xPMID: 22145866
20. Hall TA. BioEdit: a user-friendly biological sequence alignment editor and analysis program for Win-dows 95/98/NT. Nucleic Acids Symp Ser. 1999; 41: 95–98.
21. Ecosystem Environmental Consulting. Relatório da Avaliação Ecológica Rápida—Segunda Versão—
Reserva Biológica de Sooretama. Ecossistema Consultoria Ambiental Ltda/ Instituto Chico Mendes de Conservação da Biodiversidade (ICMBio), Paraná, Brazil; 2009.
22. Willis EO, Oniki Y. Birds of Santa Teresa, ES, Brazil: Do Humans add or subtract species? Pap Avulsos Zool. 2002; 42: 193–264.
24. Moreira DO, Coutinho BR, Mendes SL. O status do conhecimento sobre a fauna de mamíferos do Espírito Santo baseado em registros de museus e literatura científica. Biota Neotrop. 2008; 8: 163–
173.
25. Luz JL, Costa LM, Lourenço EC, Gomes LAC, Esbérard CEL. Bats from the restinga of Praia das Neves, state of Espírito Santo, Southern Brazil. Check List 2009; 5: 364–369.
26. Mendes P, Vieira TB, Rovida JC, Martinelli MM, Lopes SR, Oprea M, et al. Registros notáveis de mor-cegos (Chiroptera: Molossidae) no estado do Espírito Santo, Brasil. Bol Mus Biol Mello Leitão, Nova
Sér. 2009; 25: 87–93.
27. Serpa GA, Olmos F, Gussoni COA, Macarrão A, Albano C, de Luca A, et al. As aves do SESC Praia Formosa, Aracruz, Espírito Santo: observações durante o XVII Congresso Brasileiro de Ornitologia.
Atual Ornitol On-line 2009; 151: 39–52.
28. Simon JE. A Lista das Aves do Espírito Santo. Livro de resumos do XVII Congresso Brasileiro de Orni-tologia, Aracruz-ES; 2009. Available:http://www.ceo.org.br/listas_de_aves/Lista_ES_Simon.pdf. Accessed 09 March 2015
29. Almeida AP, Gasparini JL, Peloso PLV. Frogs of the state of Espírito Santo, southeastern Brazil—The need for looking at the cold spots. Check List 2011; 7: 542–560.
30. Peracchi AL, Nogueira MR, Lima IP. Novos achegosàlista dos quirópteros do município de Linhares, estado do Espírito Santo, sudeste do Brasil (Mammalia, Chiroptera). Chiropt Neotrop. 2011; 17: 842–
852.
31. Tonini JFR, Mendonça IS, Coutinho AB, Gasparini JL. Anurans from Costa Bela, state of Espírito Santo, south-eastern Brazil: inventory at an urban area and the rediscovery of Allobates in the state. Herpetol Notes 2011; 4: 435–444.
32. Ministério do Meio Ambiente. Portaria MMA n°444 de 17 de dezembro de 2014. Available:www. icmbio.gov.br/cepsul/images/stories/legislacao/Portaria/2014/p_mma_444_2014_lista_espécies_ ameaçadas_extinção.pdf
33. Forman TTR, Alexander LE. Roads and their major ecological effects. Annu Rev Ecol Evol Syst. 1998; 29: 207–232. doi:10.1146/annurev.ecolsys.29.1.207
34. Sanches A, Tokumoto PM, Peres WA, Nunes FL, Gotardi MS, Carvalho CS, et al. Illegal hunting cases detected with molecular forensics in Brazil. Investig Genet. 2012; 3: 1–5. doi:10.1186/2041-2223-3-17 PMID:22863070
35. Murphy RW, Crawford AJ, Bauer AM, Che J, Donnellan SC, Fritz U, et al. Cold Code: the global initia-tive to DNA barcode amphibians and nonavian reptiles. Mol Ecol Resour. 2013; 13: 161–167. doi:10. 1111/1755-0998.12050
36. Vences M, Thomas M, van der Meijden A, Chiari Y, Vieites DR. Comparative performance of the 16S rRNA gene in DNA barcoding of amphibians. Front Zool. 2005; 2: 1–12.
37. Hawkins MA, Sites JW Jr, Noonan BP.Dendropsophus minutes(Anura: Hylidae) of the Guiana Shield: using DNA barcodes to assessidentity and diversity. Zootaxa 2007; 1540: 61–67.
38. Vieites DR, Wollenberg KC, Andreone F, Köhler J, Glaw F, Vences M. Vast underestimation of Mada-gascar’s biodiversity evidenced by an integrative amphibian inventory. Proc Natl Acad Sci USA 2009; 106: 8267–8272. doi:10.1073/pnas.0810821106PMID:19416818
39. Xia Y, Gu H-F, Peng R, Chen Q, Zheng Y-C, Murphy RW, et al. COI is better than 16S rRNA for DNA barcoding Asiatic salamanders (Amphibia: Caudata: Hynobiidae). Mol Ecol Resour. 2012; 12: 48–56. doi:10.1111/j.1755-0998.2011.03055.xPMID:21824335
40. Clare EL, Lim BK, Engstrom MD, Eger JL, Hebert PDN. DNA barcoding of Neotropical bats: species identification and discovery within Guyana. Mol Ecol Notes 2007; 7: 184–190. doi: 10.1111/j.1471-8286.2006.01657.x
41. Clare EL, Lim BK, Fenton MD, Hebert PDN. Neotropical bats: estimating species diversity with DNA barcodes. PLoS One 2011; 6: e22648. doi:10.1371/journal.pone.0022648PMID:21818359
42. Myers N, Mittermeier RA, Mittermeier CG, da Fonseca GAB, Kent J. Biodiversity hotspots for conserva-tion priorities. Nature 2000; 403: 853–858. doi:10.1038/35002501PMID:10706275
43. Scudeller VV, Martins FR, Shepherd GJ. Distribution and abundance of arboreal species in Atlantic ombrophilus dense forest in Southastern Brazil. Plant Ecol. 2001; 152: 185–199.
44. Ratnasingham S, Hebert PDN. A DNA-based registry for all animal species: the Barcode Index Number (BIN) system. Plos One 2013; 8: e66213. doi:10.1371/journal.pone.0066213PMID:23861743
45. Clare EL. Cryptic species? Patterns of maternal and paternal gene flow in eight Neotropical bats. PLoS One 2011; 6: e21460. doi:10.1371/journal.pone.0021460PMID:21814545
47. Lacerda DR, Marini MA, Santos FR. Mitochondrial DNA corroborates the species distinctiveness of the Planalto (Thamnophilus pelzelni Hellmayr, 1924) and the Sooretama (T. ambiguus Swainson, 1825) Slaty-antshrikes (Passeriformes: Thamnophilidae). Braz J Biol. 2007; 67: 873–82. PMID:18278354
48. Hajibabaei M, Smith MA, Janzen DH, Rodriguez JJ, Whitfield JB, Hebert PDN. A minimalist barcode can identify a specimen whose DNA is degraded. Mol Ecol Notes 2006; 6: 959–964. doi:10.1111/j. 1471-8286.2006.01470.x
49. Ivanova NV, Borisenko AV, Hebert PDN. Express barcodes: racing from specimen to identification. Mol Ecol Resour. 2009; 9: 35–41. doi:10.1111/j.1755-0998.2009.02630.xPMID:21564962
50. Myers N, Mittermeier RA, Mittermeier CG, da Fonseca GAB, Kent J. Biodiversity hotspots for conserva-tion priorities. Nature 2000; 403: 853–858. doi:10.1038/35002501PMID:10706275
51. Ivanova NV, Zemlak TS, Hanner RH, Hebert PDN. Universal primer cocktails for fish DNA barcoding. Mol Ecol Notes 2007; 7: 544–548. doi:10.1111/j.1471-8286.2007.01748.x
52. Chaves BRN, Chaves AV, Nascimento ACA, Chevitarese J, Vasconcelos MF, Santos FR. Barcoding Neotropical birds: assessing the impact of nonmonophyly in a highly diverse group. Mol Ecol Resour. 2015; 15: 921–931. doi:10.1111/1755-0998.12344PMID:25417731
53. Eaton MJ, Meyers GL, Kolokotronis S-O, Leslie MS, Martin AP, Amato G. Barcoding bushmeat: molec-ular identification of Central African and South American harvested vertebrates. Conserv Genet. 2010; 11: 1389–1404. doi:10.1007/s10592-009-9967-0
54. Glista DJ, DeVault TL, DeWoody JA. Vertebrate road mortality predominantly impacts amphibians. Herpetol Conserv Biol. 2008; 3: 77–87.
55. Hobday AJ, Minstrell ML. Distribution and abundance of roadkill on Tasmanian highways: human man-agement options. Wildlife Res. 2008; 35: 712–726. doi:10.1071/WR08067