A test of the utility of DNA barcoding in the radiation of the freshwater
stingray genus
Potamotrygon
(Potamotrygonidae, Myliobatiformes)
Daniel Toffoli
1, Tomas Hrbek
1,2, Maria Lúcia Góes de Araújo
3, Maurício Pinto de Almeida
4,
Patricia Charvet-Almeida
5and Izeni Pires Farias
11
Laboratório de Evolução e Genética Animal, Departamento de Ciências Biológicas,
Universidade Federal do Amazonas, Manaus, AM, Brazil.
2
Biology Department, University of Puerto Rico, Rio Piedras, San Juan, Puerto Rico.
3
Laboratório de Histologia, Departamento de Morfologia, Universidade Federal do Amazonas,
Manaus, AM, Brazil.
4Museu Paraense Emílio Goeldi, Universidade Federal do Pará, PA, Brazil.
5
Departamento de Sistemática e Ecologia, Universidade Federal da Paraíba, João Pessoa, PB, Brazil.
Abstract
DNA barcoding is a recently proposed global standard in taxonomy based on DNA sequences. The two main goals of DNA barcoding methodology are assignment of specimens to a species and discovery of new species. There are two main underlying assumptions:i) reciprocal monophyly of species, and ii) intraspecific divergence is always less than interspecific divergence. Here we present a phylogenetic analysis of the family Potamotrygonidae based on mito-chondrial cytochromec oxidase I gene, sampling 10 out of the 18 to 20 valid species including two non-described species. Potamotrygonidae systematics is still not fully resolved with several still-to-be-described species while some other species are difficult to delimit due to overlap in morphological characters and because of sharing a com-plex color patterns. Our results suggest that the family passed through a process of rapid speciation and that the spe-ciesPotamotrygon motoro, P. scobina, and P. orbignyi share haplotypes extensively. Our results suggest that systems of identification of specimens based on DNA sequences, together with morphological and/or ecological characters, can aid taxonomic studies, but delimitation of new species based on threshold values of genetic dis-tances are overly simplistic and misleading.
Key words: Potamotrygon, barcoding, radiation, phylogenetics, COI, mtDNA. Received: October 20, 2006; Accepted: May 22, 2007.
Introduction
The Consortium for the Barcode of Life was created in order to develop DNA barcoding as a global standard (http://barcoding.si.edu). The objective of DNA barcoding is the use of one or more genes toi)assign unknown
speci-mens to its species, andii)increase the discovery of new
species (Moritz and Cicero, 2004). The proponents of barcoding argue that there exists an overwhelming number of undescribed species and the number of traditional taxon-omists is too few to handle this diversity; morphologically cryptic species are overlooked by traditional morphological methods; and larval stages of some species groups often
cannot be assigned to the correct species based on morphol-ogy (Hebertet al., 2003). The DNA barcoding supposedly
would be a fast, efficient, and globally accessible method for delimiting and identifying new species (Hebertet al.,
2003). The mitochondrial gene cytochrome c oxidase I
(COI) was chosen as the standard gene for DNA barcoding because it shows a conserved amino acid sequence that fa-cilitates the design of universal primers applicable to a di-verse group of organisms; COI also apparently functions well to discriminate species (Hebert et al., 2003, 2004;
Wardet al., 2005; Hajibabaeiet al., 2006).
There are two basic assumptions that underpin DNA barcoding methodology; 1) monophyly of species with re-spect of the molecular marker used, and 2) intraspecific ge-netic divergence is much smaller than gege-netic differences among species, thus justifying the use of divergence thresh-olds to assign individuals to correct species based on ge-netic divergence. In a seminal publication on barcoding,
Genetics and Molecular Biology, 31, 1 (suppl), 324-336 (2008) Copyright © 2008, Sociedade Brasileira de Genética. Printed in Brazil www.sbg.org.br
Send correspondence to Izeni Pires Farias. Laboratório de Evo-lução e Genética Animal, Departamento de Ciências Biológicas, Universidade Federal do Amazonas, Mini Campus ICB, Av. Gen. Rodrigo Octávio Jordão Ramos 3000, 69077-000 Manaus, AM, Brazil. E-mail: izeni_farias@ufam.edu.br.
Hebertet al.(2004) found in a survey of 260 North
Ameri-can bird species that COI divergences among close rela-tives were on average 18 times higher than intraspecific divergences. The authors proposed a 10x threshold diver-gence between clades to within clades as a way to acceler-ate the discovery of new species,i.e.divergences over the
10x threshold most likely represent divergences among species rather than within species. Using this approach Hebertet al.(2004) identified four possible new species of
birds nesting in North America. Hajibabaeiet al.(2006)
found distinct COI barcodes for 97.9% out of 521 lepi-dopteran species surveyed in Costa Rica, albeit no thresh-old value was proposed to assign specimens to described species or to identify new species, an important component of barcoding.
However, critics of DNA barcoding argue that many of the barcoding studies do not compare sister species, the primary candidates to share haplotypes and to show low interspecific divergence. Additionally, because these stud-ies do not sample diversity within the geographical distri-bution of the species,i.e.they are typological in character,
current DNA barcoding studies tend to underestimate intra-specific genetic variability (Moritz and Cicero, 2004). In-deed, Johnson and Cicero (2004) found results that sharply contrast those of Hebertet al.(2004) when comparing sister
species of birds from North America. They found average interspecific genetic values much lower and intraspecific genetic variability much higher than those found by Hebert
et al.(2004), and they also found many cases of paraphyly.
In the present study we test the efficiency of the mito-chondrial gene COI for delimiting species of freshwater stingrays of the family Potamotrygonidae, using the meth-odology proposed by the DNA barcoding consortium. The family Potamotrygonidae is currently composed of three genera, Paratrygon Duméril, 1865, Plesiotrygon Rosa,
Castello and Thorson, 1987, andPotamotrygonGarman,
1877. The first two genera are considered monotypic while
Potamotrygoncontains 16 (Carvalho et al., 2003) to 18
(Rosa, 1985) taxonomically valid species. However, the taxonomy of the family is not well resolved with some spe-cies being considered taxonomically dubious, and several species yet to be described (Carvalhoet al., 2003).
Earliest taxonomic recognition of potamotrygonid stingrays dates to the colonial period (Castexet al., 1963
and references therein); however, it was not until the 1960’s and 1970’s that taxonomist became interested in this group. Studies from this period were based on few individuals (e.g. Castex et al., 1963; Castex, 1964; Achenbach and
Achenbach, 1976) and were unable to encompass the phenotypic variation observed in nature. Rosa (1985) pro-vided the first taxonomic revision of the family, generating the first genus-level phylogenetic hypothesis. Rosa (1985) also produced a species key for the Potamotrygonidae; the key was based primarily on coloration patterns, although his study relied primarily on specimens already deposited
in museums. We used the key of Rosa (1985) and charac-ters in original descriptions to classify our specimens.
Starting in the late 1990’s, several groups of research-ers initiated field studies and collections in the Amazon basin focusing particularly on the Negro River (Araújo, 1998), the Amazon River (Charvet-Almeida, 2004), especially its mouth and lower portion (Charvet-Almeida, 2001; Almeida, 2003), the Xingu River (Charvet-Almeida, 2006) and To-cantins River (Rincon, 2006). These studies resulted in the discovery of new and what appear to be new species, but also demonstrated very high degrees of polychromatism in some species pointing out the difficulty of delimiting species using the key proposed by Rosa (1985). An especially high degree of polychromatism was observed inPotamotrygon motoro
and Potamotrygon orbignyi in the Negro River (Araújo,
1998),Potamotrygon motoroin the Amazon River
(Char-vet-Almeida, 2004),Potamotrygon scobinain the mouth of
the Amazon River (Almeida, 2003), and Potamotrygon orbignyiin the Paranã-Tocantins River (Rincon, 2006), and
in the Xingu River (Charvet-Almeida, 2006). Despite their high degree of polychromatism, the taxonomic validity of these three species ofPotamotrygonis uncontested by
tax-onomists specializing in chondrichthyans (Carvalhoet al.,
2003; Rosa and Carvalho, 2007).
To test the efficacy of DNA barcoding in delimiting potamotrygonid species, we generated the first comprehen-sive hypothesis of intra-familial phylogenetic relationships for the freshwater stingray family Potamotrygonidae and also evaluated the intraspecific genetic diversity of sam-pled species. We survey 10 out of the 18 valid species using a 522 bp portion of the COI gene, to infer phylogenetic rela-tionships within the family, to test alternate phylogenetic hypotheses, and to test the utility of DNA barcoding in this family.
Material and Methods
Sampling of taxa
We sampled six valid species and two non described species of the genusPotamotrygonwith at least two indi-viduals per species, for a total of 36 specimens (Table 1).
We analyzed the species Potamotrygon motoro
(n = 10),P. orbignyi(n = 6),P. scobina(n = 2),P. leopoldi
(n = 2),P. falkneri(n = 3),P. schroederi(n = 4),
Potamo-trygon cf. motoro(n = 4), andPotamotrygonsp.1 (n = 5).
Potamotrygonsp.1 andPotamotrygon cf. motoro are
en-demic to the Amazonian Negro River and Tapajós River, respectively. Both species are well characterized morpho-logically and ecomorpho-logically (Araújo, 1998; Carvalho, pers. com.), but have yet to be scientifically described. We also included sequences ofP. henlei(n = 1), andPlesiotrygon
iwamae(n = 1) from Marques (2000). As outgroup, we
in-cluded the shark Heterodontus francisci (GenBank#
AJ310141), and the Myliobatiformes stingray species
Himantura pacifica. The genus Himantura is considered
the most likely sister taxon of Potamotrygonidae (Lovejoy, 1996; McEachranet al., 1996; Lovejoyet al., 1998; Dunn et al., 2003).
DNA extraction, amplification and sequencing
Total genomic DNA was extracted from muscle tis-sues preserved in alcohol by the standard protocol of Sam-brooket al. (1989). We amplified the mitochondrial COI
gene by the polymerase chain reaction (PCR) with the primers COIf 5’-ctgcaggaggagaycc-3’ (forward) and COIa 5’-agtataagcgtctgggtagtc-3’ (reverse), described by Palum-bi and Benzie (1991). The PCR reactions were performed in 25 µL reaction volume, containing 2.5 µL of dNTPs
(2.5 mM); 2.5 µL of 10X buffer (100 mM Tris-HCl,
500 mM KCl); 2µL from each primer (2 µM), 3 µL of
MgCl2(25 mM); lµL of DNA (ca. 10 ng) e 1 U of Taq DNA
polymerase. The amplification cycles were carried out as follows: 35 cycles of denaturing at 92 °C for 1 min; anneal-ing at 52 °C for 35 s; and extension at 72 °C for 90 s. A final extension was carried out at 72 °C for 5 min. PCR products were visualized on 1% agarose gel. PCR products were then purified with theGFX PCR DNA Kit(GE Healthcare),
and eluted in 20µL of elution buffer. Amplification
prim-ers were used as cycle sequencing primprim-ers, and cycle
se-quencing reactions were carried out at 52 °C following the protocol recommended by the manufacturer of the kitET
Terminator Cycle Sequencing Kit(GE Healthcare). Cycle
sequencing reactions were carried out in a final volume of 10µL and contained 4µL of DNA, 2µL of 0.2µM primer,
2µL of buffer supplied in theETkit, and 2µL ofETmix.
Amplified products were precipitated using standard am-monium acetate/ethanol precipitation. Cycle sequencing products were resuspended in Hi-Di Formamide, and re-solved on the MegaBACE 1000 (GE Healthcare) automatic sequencer.
Alignment
Sequences were aligned in ClustalW (Thompsonet al., 1996) using default setting and edit by eye. ClustalW is implemented in the program BioEdit (Hall, 1999). Variable sites were checked in MEGA 3.0 (Kumaret al., 2004), and the complete alignment was translated into putative amino acids. The 522 bp alignment did not show insertions or de-letions, and conceptual translation did not reveal any unex-pected stop codons.
Phylogenetic analyses and hypotheses testing Phylogenetic analyses under neighbor-joining (NJ), Maximum-likelihood (ML), and Bayesian-inference (BI) optimality criteria were performed using PAUP* 4.0b10
326 Barcoding freshwater stingray radiation
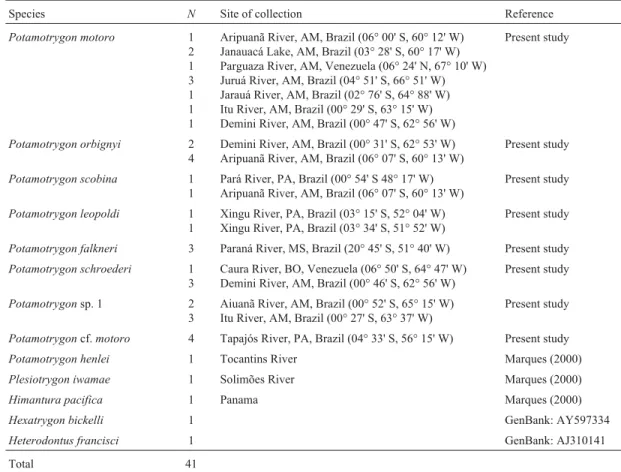
Table 1- Analyzed species and localities of collection.
Species N Site of collection Reference
Potamotrygon motoro 1 2 1 3 1 1 1
Aripuanã River, AM, Brazil (06° 00' S, 60° 12' W) Janauacá Lake, AM, Brazil (03° 28' S, 60° 17' W) Parguaza River, AM, Venezuela (06° 24' N, 67° 10' W) Juruá River, AM, Brazil (04° 51' S, 66° 51' W) Jarauá River, AM, Brazil (02° 76' S, 64° 88' W) Itu River, AM, Brazil (00° 29' S, 63° 15' W) Demini River, AM, Brazil (00° 47' S, 62° 56' W)
Present study
Potamotrygon orbignyi 2 4
Demini River, AM, Brazil (00° 31' S, 62° 53' W) Aripuanã River, AM, Brazil (06° 07' S, 60° 13' W)
Present study
Potamotrygon scobina 1 1
Pará River, PA, Brazil (00° 54' S 48° 17' W) Aripuanã River, AM, Brazil (06° 07' S, 60° 13' W)
Present study
Potamotrygon leopoldi 1 1
Xingu River, PA, Brazil (03° 15' S, 52° 04' W) Xingu River, PA, Brazil (03° 34' S, 51° 52' W)
Present study
Potamotrygon falkneri 3 Paraná River, MS, Brazil (20° 45' S, 51° 40' W) Present study Potamotrygon schroederi 1
3
Caura River, BO, Venezuela (06° 50' S, 64° 47' W) Demini River, AM, Brazil (00° 46' S, 62° 56' W)
Present study
Potamotrygonsp. 1 2 3
Aiuanã River, AM, Brazil (00° 52' S, 65° 15' W) Itu River, AM, Brazil (00° 27' S, 63° 37' W)
Present study
Potamotrygoncf.motoro 4 Tapajós River, PA, Brazil (04° 33' S, 56° 15' W) Present study Potamotrygon henlei 1 Tocantins River Marques (2000)
Plesiotrygon iwamae 1 Solimões River Marques (2000)
Himantura pacifica 1 Panama Marques (2000)
Hexatrygon bickelli 1 GenBank: AY597334
Heterodontus francisci 1 GenBank: AJ310141
(Swofford, 2002). The NJ methodology is the standard method of phylogenetic inference in DNA barcoding stud-ies (Hebertet al., 2003); its use in DNA barcoding studies is
in part due to its strong track record in being able to rapidly analyze large species assemblages (Kumar and Gadagkar, 2000). The chosen molecular substitution model was the computationally simple Kimura-two-parameter (K2P) (Ki-mura, 1980) which is the standard model of molecular evo-lution used in DNA barcoding studies (Hebertet al., 2003).
Robustness of the NJ topology was assessed using 2,000 bootstrap replicates.
We used the software Modeltest 3.7 (Posada and Crandall, 1998) to determine the best suited model of se-quence evolution and the accompanying evolutionary pa-rameter values for the data. The General Time Reversible (GTR) model of molecular evolution (Rodríguez et al.,
1990), with rate homogeneity and a portion of sites treated as invariable, was determined to be the most likely model of sequence evolution. The GTR + inv model of sequence evolution was implemented in ML and BI analyses. Maxi-mum-likelihood topology was also estimated in PAUP* 4.0b10 (Swofford, 2002) with 25 heuristic searches using random addition of sequences, and implementing the tree bisection and reconnection (TBR) algorithm. Statistical ro-bustness of the ML topology was accessed using 200 boot-strap replicates.
Bayesian-inference analysis was performed in the program MrBayes 3.01 (Ronquist and Huelsenbeck, 2003). The data were partitioned into three categories representing first, second, and third positions of the COI gene, each fol-lowing the GTR + inv model of sequence evolution. We ran 2,000,000 generations using default long and short chain and heating parameters, sampling trees, and branch-length every 100 generations. Log likelihoods stabilized within the first 10% of the run, and therefore we discarded these initial 200,000 trees as burnin steps in the computation of a 50% majority rule consensus tree.
Pair-wise distances under Kimura-two-parameter (K2P), and maximum likelihood GTR + inv models of mo-lecular evolution were generated in PAUP* 4.0b10 (Swof-ford, 2002).
Alternate phylogenetic hypotheses were tested within the ML and NJ frameworks. Four hypotheses were tested: monophyly of P. motoro, monophyly of P. orbignyi,
monophyly ofP. scobina, and the reciprocal monophyly of
the three species. We found the most likely or the best NJ trees that satisfied these constrains, and compared them against the most likely and best NJ topologies using the Kishino-Hasegawa (K-H) test (Kishino and Hasegawa, 1989), and Shimodaira-Hasegawa (S-H) tests (Shimodaira and Hasegawa, 1999). Assessment of significance was tested using the RELL bootstrap (Kishinoet al., 1990). We
also tested the hypothesis that our data follows a clock-like tempo of molecular evolution by enforcing the constraint of a clock-like mode of molecular evolution, and testing if this
constraint resulted in a significantly less likely phylogen-etic hypothesis using the likelihood-ratio test (Huelsenbeck and Rannala, 1997). To test if alleles of species were under natural selection, we used the McDonald-Kreitman test (McDonald and Kreitman, 1991) implemented in the pro-gram DnaSP 3.1 (Rozaset al., 2003).
Results
Phylogenetic analyses
The COI sequence alignment comprises 522 sites of which 180 were variable and 121 were parsimony informa-tive (GenBank accession numbers EF532644-EF532683). Within Potamotrygonidae, the dataset contained 111 vari-able sites and 79 parsimony informative sites. All three methods of phylogenetic reconstruction indicated that the three most broadly distributed species in the Amazon basin,
P. motoro,P. orbignyi, andP. scobina, are not reciprocally
monophyletic (Figures 1-3). Monophyly of the other spe-cies includingPotamotrygonsp. 1, andPotamotrygon cf. motoro, is statistically well supported in all analyses. The
speciesP. motoro,P. orbignyi,P. scobina,P. leopoldi,P. falkneri,Potamotrygon cf. motoro, andP. henlei, hereafter
called the rosette-spot clade, form a well defined and well supported clade; however, relationships among the species of the rosette-spot clade remain unresolved in all three methods of phylogenetic reconstruction (Figures 1-3).
The phylogenetic position of Plesiotrygon iwamae
conflicts among NJ, ML, and BI analyses. In the NJ topol-ogy,Plesiotrygon iwamaeappears as sister to all species of
Potamotrygon (Figure 1). In the ML phylogeny,
Plesiotrygon iwamaeis sister toPotamotrygon schroederi,
andPotamotrygonsp.1 appears as sister to the rest of the
species of the family Potamotrygonidae (Figure 2). In the BI phylogeny,Plesiotrygon iwamaeappears nested within PotamotrygonwithP. schroederias sister to other species
in family (Figure 3). The internal tree branches within the Potamotrygonidae phylogeny are relatively short, espe-cially within the rosette-spot clade.
Maximum parsimony analysis was not carried out since we have multiple individuals represented by the same haplotype which in turn resulted in a large number of equally parsimonious topologies. The consensus of these equally parsimonious topologies had the same phylogen-etic pattern obtained in other analyses, but statistical tests could not be carried out efficiently.
Genetic distances among the speciesP. motoro,P.
scobina, andP. orbignyican not be considered true
mea-sures of divergence, since these species are not reciprocally monophyletic. Because of their lack of reciprocal mono-phyly, intraspecific genetic distances within these species show similar levels of divergence as among species mea-sure of genetic distance (Table 2).
Hypotheses testing
Testing of alternate ML and NJ topological hypothe-ses under the Kishino-Hasegawa (1989) and Shimodai-ra-Hasegawa (1999) frameworks resulted in essentially the same conclusions (Tables 4 and 5). The monophyly of
Potamotrygon motorowas not statistically rejected in the
ML topology and was only rejected by the K-H test in the NJ topology. Monophyly ofP. orbignyi was rejected by
both tests in the ML topology and the NJ topology. Like-wise, monophyly ofP. scobinawas rejected in the ML
to-pology by the K-H test, but not by the S-H test, and was re-jected by both tests in the NJ topology. Enforcing the reciprocal monophyly of all three species resulted in signif-icantly worse phylogenetic hypotheses under the ML crite-rion, as well as under the NJ phylogenetic estimate. Results of the McDonald-Kreitman test indicated that natural
selec-328 Barcoding freshwater stingray radiation
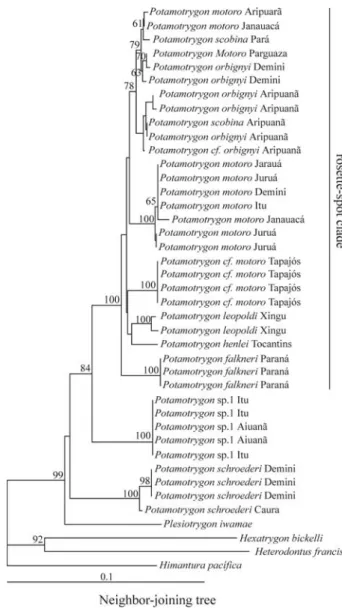
Figure 1- Phylogenetic relationships of the potamotrygonids based on a
Neighbor-Joining analyses of mitochondrial COI sequence data using K2P substitution model. Bootstrap values less than 50% were not shown.
Plesiotrygon iwamaeappears sister to all species ofPotamotrygon.P. motoro,P. scobina, andP. orbignyiare non-monophyletic. The relation-ships among species of rosette-spot group are not well supported and branch lengths are short, evidence of a radiation.
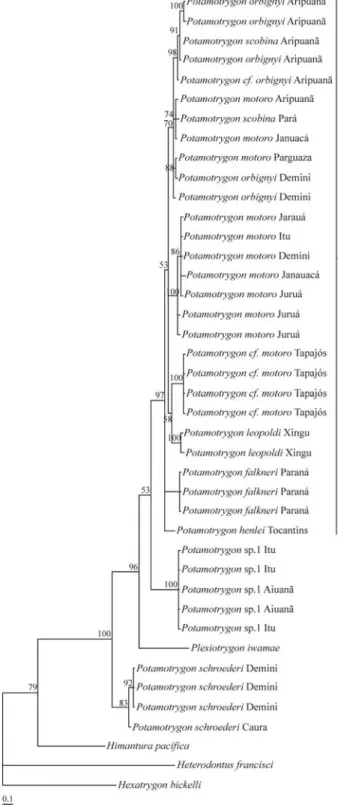
Figure 2- Phylogenetic relationships of the potamotrygonids based on a Maximum-Likelihood phylogenetic analyses of mitochondrial COI se-quence data using GTR + inv substitution model.Plesiotrygon iwamaeis
sister toPotamotrygon schroederiandPotamotrygonsp.1 appears as the sister species of the family Potamotrygonidae.P. motoro,P. scobina, and
tion is or was acting inP. orbignyi(p < 0.05), however,
overall sequence data evolve in a clock-like fashion (LTR test p > 0.05).
Discussion
Potamotrygonidae is the only family of the Class Chondrichthyes that is considered completely adapted to liv-ing in fresh water (Thorsonet al., 1983). Initial phylogenetic
studies of Rosa (1985), Lovejoy (1996), Lovejoy et al.
(1998), and Marques (2000) aimed to test the monophyly of this family, to infer the phylogenetic relationships among its three described genera, and to establish its sister group. These studies supported the monophyly of the Potamo-trygonidae and most of them concluded that colonization of fresh water in South America is the result of a single coloni-zation event. The majority of authors also considered the ma-rine genusHimanturato be the sister taxon of
Potamotry-gonidae. Relationships within the Potamotrygonidae were hypothesized as (Paratrygon (Plesiotrygon
(Potamotrygon))), although Marques (2000) and Quijada
(2003) foundPlesiotrygonnested withinPotamotrygon. The
first attempt to define species relationships within the genus
Potamotrygonwas made by Marques (2000), although his
study was based on only few specimens per species and spe-cies were not sampled throughout their geographical distri-bution. This sampling design assumes that species are monophyletic with respect to the alleles at the studied locus, and that they show no or only very limited intraspecific vari-ation (Funk and Omland, 2003). In turn, this assumption re-quires that nominal study species represent genetically and reproductively independent lineages whose boundaries have been accurately identified by taxonomists and whose recon-structed gene trees are accurate approximations of orga-nismal history,i.e.species trees (Funk and Omland, 2003).
This scenario also does not accommodate species that are paraphyletic or polyphyletic, cases extensively reported in the literature (Funk and Omland, 2003, and references therein). Non-reciprocal monophyly of species can, for example, be caused by the retention of ancestral polymorphism or intro-gression following a hybridization event (Avise, 2000; Moritz and Cicero, 2004). In our phylogenetic analysis we sampled four species in at least two different localities, and majority of species are represented by at least four individuals. Even with this sampling scheme, we find extensive haplotype sharing, and lack of monophyly in three out of the eight in-vestigated species with more than one specimen sampled.
Potamotrygon motoro, Potamotrygon scobina, and Potamotrygon orbignyi
We found that three of the four species with broadest distribution in the Amazon basin (the fourth species
Paratrygon aierebawas not included in this study), species
which also are highly polymorphic, were not reciprocally monophyletic, and extensively shared haplotypes among species. Haplotype sharing may indicate thati)taxonomic
validity of these species should be reassessed;ii) lineages did
not have enough time to reach reciprocally monophyly;iii)
hybridization; or iv) combination of these factors (Moritz
and Cicero, 2004).
Figure 3- Phylogenetic relationships of the potamotrygonids based on a
330
Barcoding
freshwater
stingray
radiation
Table 2- Maximum and minimum genetic distances between species under K2P (below diagonal) and GTR + inv (above diagonal) substitution model. Distances among the polyphyletic taxa (sensu Funk and
Omland, 2003)Potamotrygon motoro,P. scobina, andP. orbignyiare indicated in bold. Diagonal elements are K2P intraspecific divergences. Note that distances in bold are within range of intraspecific variability and cannot be used to discriminate these species based on thresholds. The proposed 10x threshold also cannot be used to discriminateP. leopoldifrom all otherPotamotrygonspecies.
1 2 3 4 5 6 7 8 9 10 11 12 13
1 Himantura pacifica min - 0.36039 0.48298 0.26358 0.26033 0.24875 0.27669 0.23774 0.35266 0.27973 0.25546 0.24636 0.25665
max - 0.36039 0.48298 0.26358 0.26033 0.26676 0.27669 0.25798 0.35266 0.27973 0.25547 0.25238 0.25665
2 Hexatrygon bickelli min 0.21571 - 0.51363 0.35694 0.38597 0.39116 0.42223 0.38737 0.38315 0.41943 0.38833 0.40410 0.40817
max 0.21571 - 0.51363 0.35694 0.38737 0.44773 0.42223 0.41301 0.38315 0.41095 0.39262 0.41228 0.40817
3 Heterodontus francisci min 0.24499 0.23618 - 0.41983 0.41221 0.42093 0.45371 0.41221 0.49989 0.41095 0.41654 0.42701 0.42450
max 0.24499 0.23618 - 0.41983 0.42460 0.45796 0.45371 0.43947 0.49989 0.07734 0.42063 0.43396 0.42450
4 Potamotrygonsp.1 min 0.17137 0.21119 0.22852 0.00000 0.06078 0.06341 0.07865 0.06078 0.11505 0.07734 0.10454 0.07343 0.07628
max 0.17137 0.21119 0.22852 0.00000 0.06823 0.08589 0.07865 0.07130 0.11505 0.07734 0.10455 0.07624 0.07628 5 Potamotrygon scobina min 0.16130 0.2139 0.23171 0.05652 0.01359 0.00387 0.02979 0.00000 0.11358 0.02906 0.08812 0.02649 0.03540 max 0.16380 0.22209 0.23728 0.06297 0.01359 0.03558 0.03212 0.02026 0.11578 0.03135 0.10079 0.03099 0.03750 6 Potamotrygon motoro min 0.16380 0.21661 0.23171 0.05866 0.00385 0.00000 0.02766 0.00193 0.11360 0.02696 0.08814 0.02444 0.03541
max 0.17118 0.24373 0.23937 0.07572 0.03350 0.03147 0.04445 0.03137 0.13901 0.04348 0.11578 0.04294 0.04764
7 Potamotrygon henlei min 0.17354 0.22436 0.23127 0.06926 0.02747 0.02546 - 0.02767 0.12176 0.03503 0.10008 0.02775 0.03922
max 0.17354 0.22436 0.23127 0.06926 0.02949 0.03954 - 0.03710 0.12176 0.03503 0.11118 0.03008 0.03922
8 Potamotrygon orbignyi min 0.16130 0.21661 0.22620 0.05652 0.00000 0.00192 0.02546 0.00192 0.11578 0.02697 0.09339 0.02444 0.03541 max 0.16865 0.23016 0.23984 0.06514 0.01950 0.03549 0.0335 0.01751 0.12734 0.03152 0.11113 0.03115 0.04493
9 Plesiotrygon iwamae min 0.20114 0.20563 0.23034 0.09735 0.09508 0.09508 0.09708 0.09735 - 0.12770 0.12883 0.11998 0.13176
max 0.20114 0.20563 0.23034 0.09735 0.09735 0.11072 0.09708 0.10408 - 0.12770 0.12885 0.12280 0.13176
The phylogenetic results are consistent with the pos-sibility that these species can actually represent one highly polychromatic species with broad geographical distribution within the Amazon basin. There is overlap in some mor-phometric characters (Rosa, 1985), although this author mostly measured juveniles, and there is also a large amount of color and pattern variation withinP. scobinafrom the
Marajó Bay (Almeida, 2003), and P. orbignyi from the
Tocantins River (Rincon, 2006). There also appears to be some overlap in color pattern among the speciesP. motoro, P. orbignyi, andP. scobinafrom various places in the
Ama-zon basin (Araújo and Toffoli, unpublished data). For ex-amples of color patterns see electronic appendix at http://www.evoamazon.net/publications. However, there are also several morphological as well as ecological charac-ters that have been argued to separate these species. Differ-ences between P. scobina andP. orbignyi include
pres-ence/absence of a labial furrow (Almeida, 2003), color of the ventral portion of tail, teeth cuspid, and dorsal color pat-terns (Rincon, 2006).
Another hypothesis is thatP. motoro,P. orbignyi, and P. scobinaare true evolutionary species, andP. motorois
the ancestor. Although non-monophyletic, very little haplo-type sharing among geographic localities ofP. scobinaand
P. orbignyioccurs, and both species are phylogenetically
nested within P. motoro. Potamotrygon scobina and P. orbignyimay be in the process of incipient speciation with
not yet well defined species borders. The observed selec-tion acting onP. orbignyisupports this scenario, as does a
phylogeographic analysis (Toffoli, 2006), but additional data including ecological, behavioral, and populational studies are needed to test this hypothesis rigorously. The potential role of hybridization in the diversification of this group is unknown.
Phylogenetic relationships within the rosette-spot clade - “The Radiation”
Phylogenetic relationships among species of the ro-sette-spot clade are not resolved. With the exception of
Potamotrygon motoro, P. orbignyi and P. scobina, the
monophyly of all other species is well supported, but no statistical support exists for phylogenetic relationships among them. This pattern suggests that the rosette-spot clade underwent or is still in the process of phylogenetic ra-diation, resulting in a rapid increase in number of species (Schluter, 2000). A phylogenetic signature of this process is generally a polytomy, due to extremely short evolution-ary periods that separate successive speciation events. This prevents the accumulation of synapomorphic characters at internode branches, leading to the failure of all phylogen-etic methods to reconstruct a statistically supported bifur-cating topology. Radiations are not rare or restricted in time or space, and usually fill a previously unoccupied niche. Some examples include the Cambrian radiation (Philippeet al., 1994; Bromhamet al., 1998; Conway-Morris, 1999), Anolislizards from the Caribbean (Jackmanet al., 1999), Table 3 - Distances among outgroup taxa and an average of
Potamotrygonidae species under K2P and GTR + inv model of evolution.
K2P distance ML distance
Himanturax Potamotrygonidae 0.17713 0.27001
Hexatrygonx Potamotrygonidae 0.22182 0.39907
Heteredontusx Potamotrygonidae 0.22241 0.43416
Table 4- Results of ML constraint tests of monophyly of speciesPotamotrygon motoro,P. orbignyi, andP. scobina. * p < 0.05.
Topology type KH-test SH-test
-ln L Diff -ln L p p
Unconstrained topology 2267.274 (best)
Monophyly ofP. motoro 2287.596 20.322 0.057 0.078 Monophyly ofP. orbignyi 2293.598 26.323 0.022* 0.017*
Monophyly ofP. scobina 2287.120 19.846 0.037* 0.059 Reciprocal monophyly ofP. motoro, P. orbignyi, andP. scobina 2318.833 51.559 0.003* 0.003*
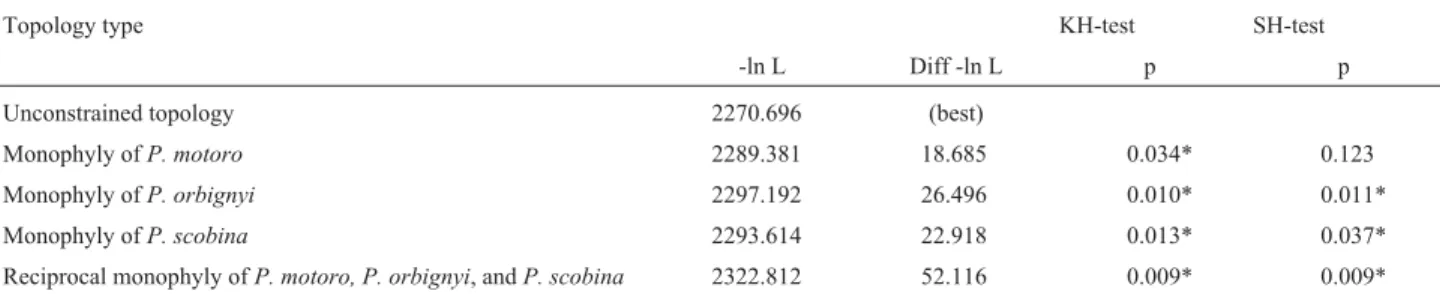
Table 5- Results of NJ constraint tests of monophyly of speciesPotamotrygon motoro,P. orbignyi, andP. scobina. *p < 0.05.
Topology type KH-test SH-test
-ln L Diff -ln L p p
Unconstrained topology 2270.696 (best)
Monophyly ofP. motoro 2289.381 18.685 0.034* 0.123 Monophyly ofP. orbignyi 2297.192 26.496 0.010* 0.011*
the Hawaiian silversword alliance (Baldwin and Sander-son, 1998), cichlid fishes of the east African lakes (Avise, 1990; Turneret al., 2001), and sciaenid fishes of the
west-ern Atlantic (Vinsonet al., 2004), among others.
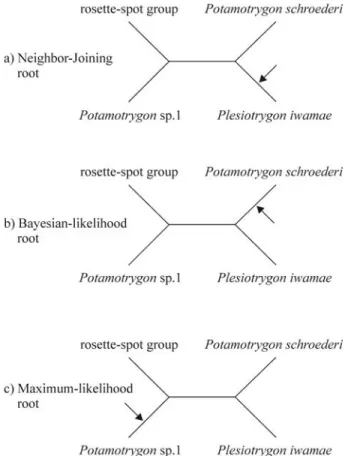
Rooting the Potamotrygonidae
In the NJ topology,Plesiotrygon iwamaeappears
sis-ter to all species ofPotamotrygon(Figure 1), in the ML
phylogeny,Plesiotrygon iwamaeis sister toPotamotrygon
schroederi (Figure 2), and in the BI phylogeny,
Plesiotrygon iwamae appears nested with Potamotrygon
(Figure 3). The phylogenetic relationship ofPlesiotrygon iwamaein the ML topology is not statistically supported by
a high bootstrap value. Despite these conflicts, the unrooted ingroup topology among Plesiotrygon iwamae,
Potamotrygon schroederi,Potamotrygonsp.1, and the
ro-sette-spot clade ofPotamotrygonremains the same in all
three methods of phylogenetic inference (Figure 4). Correct placement of the root is especially difficult in phylogenies with relatively short internal branches rooted by a distantly related or highly divergent outgroup. Classic example in-volves the placement of the root of birds whose closest rela-tives are the distantly related crocodilians, and vice versa (Mindellet al., 1999; García-Moreno and Mindell, 2000).
The average maximum likelihood within Potamotry-gonidae distance is 5.9%, while the average maximum like-lihood distance observed between Potamotrygonidae and
theHimanturasister group is 27.0%, and higher to other
cartilaginous outgroup species (Table 3). Therefore, it is not entirely surprising that the root of the Potamotrygo-nidae is difficult to place. However, we suspect that
Plesiotrygon iwamae is phylogenetically nested within
Potamotrygon,as suggested by the ML and BI topologies
(Figures 2 and 3). This supposition is derived from the use of a more complex and more appropriate model of molecu-lar evolution in the ML and BI analyses, and the consis-tently better performance of likelihood-based methods of phylogenetic inference when proper models of molecular evolution are used (Huelsenbeck and Hillis, 1993; Hilliset al., 1994). Eliminating third codon positions or translating
the sequence data into putative amino acids, and analyzing these datasets using NJ also placesPlesiotrygon iwamae
within the genusPotamotrygon(results not shown).
Fur-thermore, the inference drawn from the ML and BI topol-ogy is supported by Marques (2000) and Quijada (2003) who also hypothesize the paraphyly ofPotamotrygonand
the nested position ofPlesiotrygonwithPotamotrygon.
DNA barcoding
Studies supporting DNA barcoding often do not com-pare sister species which are the natural candidates to share haplotypes (Moritz and Cicero, 2004). Assuming that
Potamotrygon motoro, P. scobina, and P. orbignyi are
valid species in the sense of being a natural kind, our results showed that the use of DNA sequences to assign unknown specimens to any of these three species would invariably fail. Correct assignment would only be possible with the addition of other data types such as morphological, ecologi-cal, and behavioral characters, or even haplotype frequency data if non-random distribution of haplotypes across geog-raphy existed. Methodologies such as DNA barcoding which rely solely on one data type and one criterion will in-evitably have higher failure rates than those incorporating diverse sources of information. Substituting one charac-ter-type philosophical system (e.g., based on meristic
char-acters) of taxonomy for another one character-type system (e.g., based on COI DNA barcoding) will not solve existing
taxonomic problems. One system may clarify some taxo-nomic questions, but it will also obscure other questions. Thus, unless a holistic approach to taxonomy and systemat-ics is used we will inevitably fail to understand important aspects of biological diversity.
With the above caveat in mind, and assuming our
sampling is representative of the genetic diversity present in the remaining analyzedPotamotrygonspecies, the
re-maining species surveyed in this study form monophyletic and well supported groups separated by reasonably large genetic distances. This pattern would allow the use of the COI phylogeny to assign unknown specimens to their
cor-332 Barcoding freshwater stingray radiation
rect species, as proposed by the Barcoding Consortium. However, this assignment is critically dependent on suffi-ciently dense genetic sampling of the group studied,i.e.it
requires populational rather than typological sampling. The case of specimens from the Caura River, Venezuela, and specimens from Negro River, Brazil, is an illustrative ex-ample. As recognized morphologically,P. schroederi
oc-curs both in the Negro and Orinoco River basins; the type specimen was from the Orinoco, but after being lost, a neotype was designated from the Negro River (Carvalho, 2001).
Our analyses indicate that the Venezuelan Caura River specimen is sister to the Negro River specimens, and separated by 0.8% sequence divergence. The genetic diver-gence of 0.8% is relatively low compared to the average 2.5% among rosette-spot clade divergence, and would indi-cate, based on barcoding assumptions, that fishes from the Caura and the Negro Rivers represent a single species. This barcoding-based inference is predicated on the assumption that the clades from which these individuals were sampled are sister, an assumption which critically hinges on taxo-nomic sampling. On the other hand, the color pattern of the Orinoco basinP. schroederiis quite different when
com-pared to animals from Negro River. The Negro/Orinoco watershed divide represents a major barrier to gene flow for a number of species, with numerous instances of sister spe-cies occurring on either side of the divide (Reis et al.,
2003), and therefore it is possible thatP. schroederifrom
the Negro and Caura Rivers represent different species. We, therefore, can neither accept nor reject that P.
schroederioccurring on either side of the Negro/Orinoco
watershed divide represents more than one species. These results pose serious questions about the exclusive reliance on the DNA barcoding methodology in species identifica-tion, at least for the freshwater stingrays of the family Potamotrygonidae.
Assuming that species are well characterized, are monophyletic, and that intraspecific divergence is much smaller than interspecific divergence, criteria that can only be verified through populational rather than the currently prevalent typological sampling and analyses, DNA barcoding should be powerful in assigning unknown sam-ples to species. However, DNA barcoding is not powerful in discovering new species using the proposed threshold methods as advocated by Hebertet al.(2003). For example,
in a comprehensive study of the adoption of threshold val-ues for three thoroughly sampled groups of invertebrates, Meyer and Paulay (2005) found a significant overlap of intraspecific genetic variability and interspecific distance, providing strong evidence against the adoption of thresh-olds. Furthermore, the use of thresholds implicitly assumes that molecular sequences evolve in a clock-like manner. While we cannot reject a clock-like mode of molecular evo-lution in the potamotrygonid COI dataset, a clock-like mode of molecular evolution is rare in all groups of
organ-ism (for a review see Li, 1997) which resulted in the devel-opment of multiple algorithms specifically taking this fact into account in the calculation of divergence times (Sander-son, 1997, 2002; Thorne and Kishino, 2002).
DNA barcodes have been proposed as a fast, efficient, and inexpensive way to catalogue all biodiversity (Hebert
et al., 2003). However, most studies that advocate
useful-ness of barcoding actually test its assumptions in already predefined taxonomic groups based on previous works, whereas true barcoding consists of broad, essentially blind and random surveys of communities, with little or no back-ground taxonomic information (Rubinoff, 2006a). The study of Hajibabaeiet al.(2006) is one of the most striking
positive results of barcoding, identifying 98% of previously well characterized species of tropical Lepidoptera. How-ever, Funk and Omland (2003) found species level paraphyly and polyphyly in 23% of 2,319 vertebrate spe-cies whose mitochondrial genomes were surveyed. The Lepidoptera results (Hajibabaeiet al., 2006) should be seen
as an exception rather than norm. The study does not report the intraspecific sampling scheme used.
The more geographically widespread a species is, the higher is the probability of finding elevated levels of intra-specific variability if the species is sampled across its distri-butional range. Consequently, such a study would have a higher probability of finding overlaps between genetic dis-tance among closely related species and variability within a species, making even more questionable the establishment of thresholds, as well as increasing the likelihood of observ-ing paraphyly and polyphyly. If, however, all specimens of a particular species were sampled from the same locality, one is likely to observe much less intraspecific variability than if sampling was done across a distributional range of the species. This consequently would lead to a reduction in the variation within species, and to a reduction in the num-ber of observed cases of paraphyly and polyphyly. The de-gree of difference between intraspecific and interspecific divergence would also be overestimated.
The fundamental problem with using thresholds lies in the fact that species are a natural kind that embody an evolutionary process. Species are subject to demographic and selective processes that will act to increase or decrease genetic diversity and coalescent depth of individual species (e.g., Avise, 2000; Hey, 2001; Coyne and Orr, 2004).
Spe-cies may not be morphologically distinct from other spe-cies, yet be genetically distinct (e.g., Hrbeket al., 2006),
and conversely species may be morphologically distinct without being genetically distinct (e.g., Verheyen et al.,
Freshwater stingrays are a taxonomic group similar to several other tropical biota in the sense that much taxon-omy is yet to be done and therefore a good exercise for test-ing usefulness of barcodtest-ing in discovery life on Earth. We found that four out of 10 species surveyed (40%) could not be discriminated by barcoding criteria (we observed shar-ing of haplotypes among Potamotrygon motoro, P.
orbignyi, andP. scobina, and small sequence divergence
between P. aff. schroederi from Venezuela and P.
schroederifrom Negro River). DeSalle (2006) advocates
that DNA barcoding should focus mainly on the identifica-tion of specimens rather than the discovery of new species, which should be essentially the domain of taxonomy. How-ever, this radically changes the main goal of barcoding, which is identification of life on Earth in a cost-effective fashion. This mission makes it obligatory to deal with taxo-nomic groups in which previous taxotaxo-nomic efforts are vir-tually nonexistent. The results of the current and other studies pose serious doubts of the appeal of designating bil-lions of dollars to the barcoding enterprise (Cameronet al.,
2006; Rubinoff, 2006a,b). So should one trust and rely on barcoding? By any standard, 23% (Funk and Omland, 2003) or even higher (40% - present study) failure rates to identify taxonomically valid species are not acceptable, and the political, economical, and environmental consequences of using DNA barcoding as currently proposed can be enor-mous.
Acknowledgments
This research was supported in part by a research grant from the Fundação de Amparo à Pesquisa do Estado do Amazonas (FAPEAM), and International Foundation for Science (IFS) to IPF, and the BECA program to DT. Permission to conduct fieldwork and to collect tissue sam-ples was granted by IBAMA (License n. 05/2005 and 098/2006-DIFAP), and to conduct genetic assessment by CGEN/IBAMA (Deliberation n. 025/2005). We thank Pia-gaçu-Purus RDS and PROBIO personnel especially Rafael Bernhard, Stuart Willis, and local fishermen for helping us to obtain tissue samples, and Aureo Banhos dos Santos and Adam Souza de Alencar Leão for help in the laboratory. This article forms a portion of DT’s Masters Thesis at the Genetics, Conservation and Evolutionary Biology program of INPA/UFAM; DT acknowledges CAPES for financial support during his Masters tenure.
References
Achenbach GM and Achenbach SVM (1976) Notas acerca de algunas especies de raya fluvial (Batoidei, Potamotrygo-nidae), que frecuentam el sistema hidrografico del Rio Para-na medioen el departamento La Capital. Com Mus Prov Cien Nat “Florentino Ameghino” 8:3-34.
Almeida MP (2003) Pesca, policromatismo e aspectos sistemáti-cos de Potamotrygon scobina, Garman 1913 (Chondri-chthyes, Potamotrygonidae) da região da Ilha de Colares da
IIha de Marajó, Pará. M.Sc. Thesis, Universidade Federal do Pará and Museu Paraense Emílio Goeldi, Belém.
Araújo MLG (1998) Biologia reprodutiva e pesca de Potamotrygonsp. C (Chondrichthyes, Potamotrygonidae), no médio rio Negro, Amazonas. M.Sc. Thesis, Universidade Federal do Amazonas and Instituto Nacional de Pesquisas da Amazônia, Manaus.
Avise JC (1990) Flocks of African fishes. Nature 347:512-513. Avise JC (2000) Phylogeography: The History and Formation of
Species. Harvard University Press, Cambridge, 384 pp. Baldwin BG and Sanderson MJ (1998) Age and rate of
diversifi-cation of the Hawaiian silversword alliance (Compositae). Proc Natl Acad Sci USA 95:9402-9406.
Bromham L, Rambaut A, Fortey R, Cooper A and Penny D (1998) Testing the Cambrian explosion hypothesis by using a mo-lecular dating technique. Proc Natl Acad Sci USA 95:12386-12389.
Cameron S, Rubinoff D and Will K (2006) Who will actually use DNA barcoding and what will it cost? Syst Biol 55:844-847. Carvalho MR (2001) Review of: Freshwater Stingrays from South
America. Copeia 4:1167-1169.
Carvalho MR, Lovejoy NR and Rosa RS (2003) Family Potamotrygonidae (river stingrays). In: Reis RE, Kullander SO and Ferraris CJ (eds) Check List of the Freshwater Fishes of South and Central America. EDIPUCRS, Porto Alegre, pp 22-28.
Castex MN (1964) Estado actual de los estudios sobre la raya flu-vial neotropical. In: Cincuentenario del Museo Provincial de Ciencias Naturales “Florentino Ameghino”. Museo Provin-cial de Ciencias Naturales “Florentino Ameghino”, Santa Fé, pp 9-49.
Castex MN, Maciel I and Achenbach GM (1963) Acerca de la raya fluvialP. labradori. Neotropica 9:117-121.
Charvet-Almeida P (2001) Ocorrência, biologia e uso das raias de água doce na baía de Marajó (Pará, Brasil), com ênfase na biologia de Plesiotrygon iwamae (Chondrichthyes, Potamotrygonidae). MSc Thesis, Universidade Federal do Pará and Museu Paraense Emílio Goeldi, Belém.
Charvet-Almeida P (2006) Historia natural e conservação das raias de água doce (Chondrichthyes, Potamotrygonidae) no médio Rio Xingu, área de influência do projeto hidrelétrico de Belo Monte (Pará, Brasil). PhD Thesis, Universidade Federal da Paraíba.
Charvet-Almeida P (2004) Sub-Estudo Elasmobrânquios. Rela-tório Técnico agosto de 2004. Estudo Estratégico n. 8, Bases Científicas para a Conservação da Várzea: Identificação e Caracterização de Zonas Biogeográficas. Pro Várzea/ IBA-MA, Manaus.
Conway-Morris S (1999) The Crucible of Creation: The Burgess Shale and the Rise of Animals. Oxford University Press, New York, 276 pp.
Coyne JA and Orr HA (2004) Speciation. Sinauer Associates, Inc., Sunderland, 545 pp.
DeSalle R (2006) Species discoveryvs.species identification in DNA barcoding efforts: Response to Rubinoff. Conserv Biol 20:1545-1547.
Duda Jr TF and Rolán E (2005) Explosive radiation of Cape Verde Conus, a marine species flock. Mol Ecol 14:267-272. Dunn KA, McEachran JD and Honeycutt RL (2003) Molecular
phylogenetics of myliobatiform fishes (Chondrichthyes, Myliobatiformes), with comments on the effects of missing
data on parsimony and likelihood. Mol Phylogenet Evol 27:259-270.
Funk DJ and Omland KE (2003) Species-level paraphyly and polyphyly: Frequency, causes, and consequences, with in-sights from animal mitochondrial DNA. Annu Rev Ecol Syst34:397-423.
García-Moreno J and Mindell DP (2000) Rooting a phylogeny with homologous genes on opposite sex chromosomes (gametologs): A case study using avian CHD. Mol Biol Evol 17:1826-1832.
Hajibabaei M, Janzen DH, Burns JM, Hallwachs W and Hebert PDN (2006) DNA barcodes distinguish species of tropical Lepidoptera. Proc Natl Acad Sci USA 103:968-971. Hall T (1999) BioEdit: A user-friendly biological sequence
align-ment editor and analysis program for Windows 95/98/NT. Nucleic Acids Symp Ser 41:95-98.
Hebert PDN, Cywinska A, Ball SL and deWaard JR (2003) Bio-logical identifications through DNA barcodes. Proc R Soc London B 270:313-321.
Hebert PDN, Stoeckle MY, Zemlak TS and Francis CM (2004) Identification of birds through DNA barcodes. PLoS Biol 2:1657-1663.
Hey J (2001) Genes, Categories and Species: The Evolutionary and Cognitive Causes of the Species Problem. Oxford Uni-versity Press, New York, 217 pp.
Hillis DM, Huselsenbeck JP and Cunningham CW (1994) Appli-cation and accuracy of molecular phylogenies. Science 264:671-677.
Hrbek T, Keivany Y and Coad BW (2006) New species of Aphanius(Teleostei, Cyprinodontidae) from Isfahan prov-ince of Iran and a reanalysis of other Iranian species. Copeia 2006:244-255.
Huelsenbeck JP and Hillis DM (1993) Success of phylogenetic methods in the four-taxon case. Syst Biol 42:247-264. Huelsenbeck JP and Rannala B (1997) Phylogenetic methods
come of age: Testing hypotheses in an evolutionary context. Science 276:227-232.
Jackman TR, Larson A, de Queiroz K and Losos JB (1999) Phylo-genetic relationships and tempo of early diversification in Anolislizards. Syst Biol 48:254-285.
Johnson NK and Cicero C (2004) New mitochondrial DNA data affirm the importance of Pleistocene speciation in North American birds. Evolution 58:1122-1130.
Kimura M (1980) A simple method for estimating evolutionary rates of base substitutions through comparative studies of nucleotide sequences. J Mol Evol 16:111-120.
Kishino H and Hasegawa M (1989) Evaluation of the maximum likelihood estimate of the evolutionary tree topologies from DNA sequence data, and the branching order in Hominoidea. J Mol Evol 29:170-179.
Kishino H, Miyata T and Hasegawa M (1990) Maximum likeli-hood inference of protein phylogeny and the origin of chlo-roplasts. J Mol Evol 30:151-160.
Kumar S and Gadagkar SR (2000) Efficiency of the neighbour-joining method in reconstructing deep and shallow evolu-tionary relationships in large phylogenies. J Mol Evol 51:544-553.
Kumar S, Tamura K and Nei M (2004) MEGA3: Integrated soft-ware for molecular evolutionary genetics analysis and se-quence alignment. Briefings Bioinfor 5:150-163.
Li W-H (1997) Molecular Evolution. Sinauer Associates, Sunder-land, 487 pp.
Lovejoy NR (1996) Systematics of myliobatoid elasmobranchs: With emphasis on the phylogeny and historical biogeo-graphy of neotropical freshwater stingrays (Potamotry-gonidae, Rajiformes). Zool J Linn Soc 117:207-257. Lovejoy NR, Bermingham E and Martin AP (1998) Marine
incur-sion into South America. Nature 396:421-422.
Marques FPL (2000) Evolution of neotropical freshwater sting-rays and their parasites: Taking into account space and time. Ph.D. Thesis, University of Toronto, Toronto.
McDonald JH and Kreitman M (1991) Adaptive protein evolution at Adh locus inDrosophila. Nature 351:652-654.
McEachran JD, Dunn KA and Miyake T (1996) Interrelationships within the batoid fishes (Chondrichthyes, Batoidea). In: Stiassny MLJ, Parenti LR and Johnson GD (eds) Interrela-tionship of Fishes. Academic Press, New York, pp 63-84. Meyer CP and Paulay G (2005) DNA barcoding: Error rates based
on comprehensive sampling. PLoS Biol 3:2229-2238. Mindell DP, Sorenson MD, Dimcheff DE, Hasegawa M, Ast JC
and Yuri T (1999) Interordinal relationships of birds and other reptiles based on whole mitochondrial genomes. Syst Biol 48:138-152.
Moritz C and Cicero C (2004) DNA barcoding: Promises and pit-falls. PLoS Biol 2:1529-1534.
Quijada CCD (2003) Relações filogenéticas intergenéricas de raias neotropicais de água doce (Chondricthyies, Potamotrigonidae). M.Sc. Thesis, Universidade Estadual da Paraíba, João Pessoa.
Palumbi SR and Benzie J (1991) Large mitochondrial DNA dif-ferences between morphologically similar Penaeid shrimp. Mol Mar Biol Biotech 1:27-34.
Philippe H, Chenuil A and Adoutte A (1994) Can the Cambrian explosion be inferred through molecular phylogeny? Devel-opment 1994(suppl):15-25.
Posada D and Crandall KA (1998) MODELTEST: Testing the model of DNA substitution. Bioinformatics 14:817-818. Reis RE, Kullander SO and Ferraris CJ (2003) Check List of the
Freshwater Fishes of South and Central America. EDIPUCRS, Porto Alegre, 734 pp.
Rincon GF (2006) Aspectos taxonômicos, alimentação e reprodu-ção da raia de água docePotamotrygon orbignyi(Castelnau) (Elasmobranchii, Potamotrygonidae) no rio Paranã-Tocan-tins. Ph.D. Thesis, Universidade Estadual Paulista “Julio de Mesquita Filho”, Rio Claro.
Rodríguez FJ, Oliver JL, Marín A and Medina JR (1990) The gen-eral stochastic model of nucleotide substitution. J Theor Biol 142:485-501.
Ronquist F and Huelsenbeck JP (2003) MrBayes 3: Bayesian phylogenetic inference under mixed models. Bioinformatics 19:1572-1574.
Rosa RS (1985) A systematic revision of the South American freshwater stingrays (Chondrichthyes, Potamotrygonidae). Ph.D. Thesis, The College of William and Mary, Williams-burg.
Rozas J, Sánchez-DelBarrio JC, Messenguer X and Rozas R (2003) DnaSP, DNA polymorphism analyses by the coales-cent and other methods. Bioinformatics 19:2496-2497. Rubinoff D (2006a) Utility of mitochondrial DNA barcodes in
species conservation. Conserv Biol 20:1026-1033. Rubinoff D (2006b) DNA barcoding evolves into the familiar.
Conserv Biol 20:1548-1549.
Sambrook J, Fritsch EF and Maniatis T (1989) Molecular Clon-ing: A Laboratory Manual. v. 1. 2nd ed. Cold Springs Har-bor LaHar-boratory Press, Cold Springs HarHar-bor.
Sanderson M (1997) A nonparametric approach to estimating di-vergence times in the absence of rate constancy. Mol Biol Evol 14:1218-1231.
Sanderson MJ (2002) Estimating absolute rates of molecular evo-lution and divergence times: A penalized likelihood ap-proach. Mol Biol Evol 19:101-109.
Schluter D (2000) The Ecology of Adaptive Radiation. Oxford University Press, Oxford, 288 pp.
Shimodaira H and Hasegawa M (1999) Multiple comparisons of log-likelihoods with applications to phylogenetic inference. Mol Biol Evol 16:1114-1116.
Swofford DL (2002) PAUP*. Phylogenetic Analysis Using Parsi-mony (* and Other Methods), Beta Version 4b10. Sinauer Associates. Sunderland.
Thompson JD, Higgins DG and Gibson TJ (1996) CLUSTAL W: Improving the sensitivity of progressive multiple sequence alignment through sequence weighting, position specific gap penalties and weight matrix choice. Nucleic Acids Res 22:4673-4680.
Thorne JL and Kishino H (2002) Divergence time and evolution-ary rate estimation with multilocus data. Syst Biol 51:689-702.
Thorson TB, Brooks DM and Mayes MA (1983) The evolution of freshwater adaptation in stingrays. Nat Geo Soc Res Reports 15:663-694.
Toffoli D (2006) História evolutiva de espécies do gênero PotamotrygonGarman, 1877 (Potamotrygonidae) na Bacia Amazônica. M.Sc. Thesis, Instituto Nacional de Pesquisas da Amazônia and Universidade Federal do Amazonas, Manaus.
Turner GF, Seehausen O, Knight ME, Allender CJ and Robinson RL (2001) How many species of cichlid fishes are there in African lakes? Mol Ecol 10:793-806.
Verheyen E, Salzburger W, Snoeks J and Meyer A (2003) Origin of the superflock of cichlid fishes from Lake Victoria, East Africa. Science 300:325-329.
Vinson C, Gomes G, Schneider H and Sampaio I (2004) Sciaenidae fish of the Caeté River estuary, Northern Brazil: Mitochondrial DNA suggests explosive radiation for the Western Atlantic assemblage. Genet Mol Biol 27:174-180. Ward RD, Zemlak TS, Innes BH, Last PR and Hebert PDN (2005)
DNA barcoding Australia’s fish species. Phil Trans R Soc Lond B, Biol Sci 360:1-11.
Internet Resources
Consortium for the Barcode of Life (CBOL), http://barcoding.si.edu/ (April 1, 2007).
Laboratório de Evolução e Genética Animal (LEGAL), http://www.evoamazon.net/.
Associate Editor: Cláudio Oliveira
336 Barcoding freshwater stingray radiation