Bridging of Digital Gap and
E-Inclusion: Case for Chosen
EU27 Countries and
FY Republic of Macedonia
Vera Naumovska
Article Info:
Management Information Systems, Vol. 8 (2013), No. 1, pp. 020-028
Received 05 December 2012 Accepted 24 February 2013
UDC 004(497.7)
Summary
Information Communication Technologies (ICT) and Internet have made the communi-cation between businesses, institutions and individuals very fast, simple and without any kind of limits, everywhere, every time, and always. Its conveniences are under-stood in general from every country and every country gravitates to implement it de-pends of its economic prospects. In this paper the conception is to consider the ap-proaches and situations for digital inclusion, and efforts for bridging the digital gap in chosen EU27 countries and the FY Republic of Macedonia (FYRM). EU has adminis-tered a lot of laws from ICT. FYRM has done similar efforts for higher and faster im-plementation of ICT. Both of these considered sites in the paper tend to include a par-allel attention to interoperability between devices, applications, data repositories, ser-vices and networks as a key requisite for taking advantage of the benefits of digital technologies with main goal to restrict digital gap and digital e-inclusion
Keywords
digital gap, digital inclusion, ICT, information society
1. Introduction
Every innovation appears sometimes, somewhere and from somebody. Its disperse and acceptance sometimes is very fast, but sometimes is slow be-cause it depends on the innovation in question. In common sense, the theory recognizes that in more situations a small segment of the population (very often no more 3%) accepts some new product, idea, invention or behavior before anyone else or immediately after advent, and they are called first movers.. Considering from outside and after rec-ognizing the benefits from some innovation, then the majority adopts the new products, ideas or other kinds of innovation (Markus, 1987; Rogers 1995; Valente, 1993). This paper tends to elaborate one segment of ICT, which is not a history of ICT: when or where have been advent, or how are ad-vent, nor how was going or is going its acceptance and implementation were done. The paper tends to show current situation today as result of different level of implementation and usage called digital gap and efforts for e-inclusion in chosen EU27 coun-tries: United Kingdom, Germany, Sweden, France, Denmark, Netherlands, Greece, and Bulgaria, Croatia as pre-accession status country – hoping to be member state at 2013, FYRM as candidate country and neighbour’s countries with (Albania and Serbia). Why this choice has been made? The reasons are: the neighbours are included in consid-eration because it is naturally that the collaboration
between them to be highest and the basic factor is proximity; the part of developed countries of EU27 were chosen because with them, FYRM has closer communication and collaboration. Other reason is not to do compare with them, but only to show that in common consideration inside of these developed countries exist areas or cohort groups which still does not use ICT on satisfactory level.
2. Research Methodology
It was collected data from a wide variety of sources that provide a historical and comparative view-points, with main goal to compare and analysis them. Then, it was analyzed the data by descriptive statistical methods and presented some basic facts regarding the digital divide that exists of the chosen countries today. Also, the content tend to discuss and point out the valiant efforts that some are making for the bridging of the digital gap with “haves” from the “have-nots” and achieving digital or e-Inclusion.
3. Digital Divide as Inevitability
Management Information Systems
Vol. 8, 1/2013, pp. 020-028
21
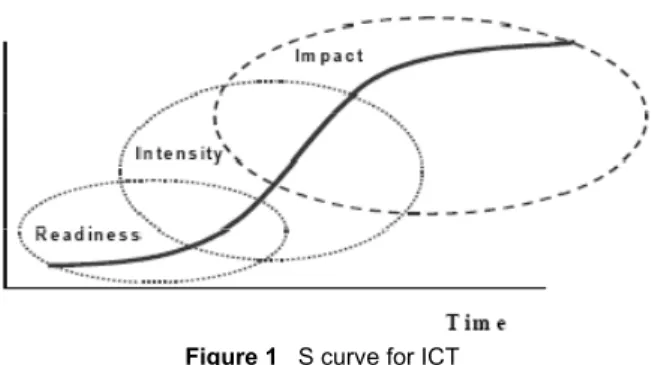
we are using term digital gap or digital divide whichpresent divide between someone who has access and uses ICT and someone who has not access and does not use ICT or the usage is on very low level. From view point of OECD (2001, p.5), this term “digital divide refers to the gap between individu-als, households, businesses and geographic areas at different socio-economic levels with regard both to their opportunities to access ICT and to their use of the Internet for a wide variety of activities”. Hargittai (2003) offers a detailed understanding of the digital divide including five factors: quality of equipment, autonomy of use, presence of social support networks, experience and online skills. One way of explaining the digital divide is by ap-plying diffusion theory. According to the Measur-ing the impacts of ICT usMeasur-ing official statistics, (2008), ICT as innovations from its appearance until its bigger acceptance ask for time, or the de-velopment of ICT as many others categories and news always has S curve of development): appear-ance (readiness) - reflecting the level of networked infrastructure and access to ICT; development
(in-tensity) - reflecting the level of use of ICT in the
society, saturation-max implementation (impact) - reflecting the result of efficient and effective ICT use.
Level of Activity
Figure 1 S curve for ICT
According to the diffusion theory, adoption of technological innovations is a function of one's innovativeness, or willingness to try new products, (Rogers, 1995). Therefore, the S curve shows that from implementation to saturation time is needed, and because it is not equal in different countries, the digital gap existence is inevitable and efforts appeared for its bridging treated as e-inclusion or digital inclusion. The nature of diffusion and adop-tion of a new communicaadop-tion technology such as the Internet can be viewed from the perspective of diffusion theory. Rogers (1995) classified the adopters of innovations into five categories based on how long a period of time they take to adopt an innovation: innovators, early adopters, the early
majority, the late majority and laggards. Factors such as risk willingness, wealth, cosmo-politeness, education and social pressure influence individual’s adoption of an innovation.
The term unequal or divide is not connected only with ICT. It can be in use for many other situations: gap in the level of economic develop-ment, gap in level of education, gap in poverty, in level of employment, etc. There are situations where the divide in some volume is normal to be present-for example some number of unemployed are in this category after graduation (finalisation of education) because they do not want to work im-mediately after graduation. They delay the process of searching a job for some period of time and think what is preferable for them to work. How-ever, it is only one small number of individuals and for shorter period of time.
Every country has understood inevitability, the advantages of ICT that depends on their own eco-nomic possibilities and every country fight to achieve higher level of using of ICT. As some re-searches and analysis were done for chosen and mentioned countries, we can conclude that the S curve is present in implementation and usage of ICT, and for FYRM where in 2011, the percentage of Internet users approximate 55%, and for com-puters 58.9%, which means that more than half of population is IT literate.
ICT in comparison with other kinds of innova-tion has enormous meaning because it is used in different areas of human life. Also there are influ-ence on growth of effectiveness and efficiency in carrying out in any kind of activity, where the ef-fects are direct and indirect (Hîncu, FrăŃilă & TanŃău, 2011).
Figure 2 GDP per capita for chosen EU27 countries
GDP per capita for chosen EU countries
0 15000 30000 45000 60000Bulgaria
Germany
Greece
Netherland
Italy Romania
Slovenia Sweeden
l i p h I l E l p m From view country tends level of imple achieved dep development ized effort sh ernment, thro public institu holds and in developed co capita (Figure that 60-70%, (Figure 4). T ICT between developed.
Figure
Source: Int
By reason development level of dom EU27 or SEE lower GDP p percentage o compared wit countries (Fig means, the dig
Figure 4 Inter
Source: Int
wpoint of m s to have as m ementation an pending from
or GDP per hould be inves ough all step utions, busine
dividuals. GD ountries of E
e 2) and its I and in some o That is one fa
them, which
3 GDP per cap ternet Usage Stats a
n of different in every cou mination of IC
E countries (B per capita (Figu of users of c
th chosen hig gure 4) consid gital gap is ine
rnet users for cho region co
ternet Usage Stats a
meaning of I much as poss nd usage. But the level of capita, and h sted on the le
s of educatio ess communi DP per capita U is above $ Internet users of them more actor among makes them t
pita for Balkan re and Telecom Report
level at socio untry, we hav CT in every Balkan region ure 3), which computers an ghly develope dered in this p evitable.
osen EU27 coun untries
and Telecom Report
ICT, every sible higher
this can be f economic how organ-evel of gov-on process,
ity, house-a in highly $40000 per s are more e them 90%
others and to be highly
egion ts, 2012
o-economic ve different
country of n with very have lower nd Internet ed EU (27)
paper. That
tries, Balkan
ts, 2012
The digit cannot be d presented to inside the se regions, or c tional-dome and interna vided. Its ra trainings, co different lev ployed, and then a big m ICT produc Internet, che installation countries wi market of IC (Figure 5).
Figure 5 Exp
Source: Informati
Why is i tion to digit number of I oping count portion is 1 Meanwhile, of the Intern in developed saturation if more than 9 highest deve developed an age is not a (Table 1).
tal gap is an
decreased, but o challenge pro
eparate areas continents. So stic (in fram tional (amon ange can be ourses and oth vels between employed in meaning has d cts (cheaper a
eaper comput equipment-b ithout compe CT have the
penses for ICT by ion and Communica
it important t tal gap, becau Internet users tries, which ye :12 in 2000 a the growth fo net users still h
d countries, a f this percen 98%. It is sti eloped countr nd undevelop half from th
unbridgeable
t in the situati oblems in com
in one coun ome authors t ework of som ng countries)
abridged wit her forms of e n the popula
private and p decreasing of t access to Int ers, & softwar but the econ tition or liber highest expen
y continents and ation Technology (IC
to dedicate en use it is obvio
s in developed ear by year de and 1:3 at 201 or ICT from p has space for and we can ta tage of usage ill unrealized ries in the wo ped countries
at of develop
e gap, which
ion which is mmunication try, between reat it as na-me country) digitally di-th organized education on ation, unem-public sector,
the prices of ternet, faster
re, and other nomic poor ration of the nses for ICT
GNI per capita CT) Statistics, 2012
nough atten-ous from the
d and devel-ecreases (the 10, Table 1). point of view growth even alk for some e of ICT is
Management Information Systems
Vol. 8, 1/2013, pp. 020-028
23
Today, a multitude published papers exist,con-ferences and other organized forms, which have dedicated attention in considering the digital gap. Contribution to this field presents harmonization statistical indicators, which expresses this term in dimension, which can be comparable or measured as time dimension. At the World Summit on the Information Society (WSIS) in Geneva in Decem-ber 2003, world leaders and heads of state, high-lighted the importance of benchmarking and meas-uring progress toward the information society. The key stakeholders involved in the statistical meas-urement of the Information Society including the International Telecommunication Union (ITU), the Organization for Economic Co-Operation and Development (OECD), Eurostat, the United Na-tions Conference on Trade and Development (UNCTAD), the UN ICT Task Force, four UN Regional Commissions (UNECA, UNECLAC, UNESCAP and UNESCWA), the UNESCO Insti-tute for Statistics (UIS) and the World Bank (WB), all joined forces to create a global Partnership for measuring ICT for development. The Partnership was officially launched during the UNCTAD XI conference held in Brazil in June 2004. The main objectives of the Partnership are the following (Measuring ICT: The global status of ICT indica-tors-Partnership on Measuring ICT for Develop-ment, 2005, p. 1) have included: (i) To agree on a common set of core ICT indicators that are com-parable at the international level; (ii) To assist in building the statistical capacity in developing coun-tries, and (iii) To set up a global database for host-ing data on core ICT indicators. They accepted 20 ICT indicators in households (Measuring ICT: The global status of ICT indicators-Partnership on Measuring ICT for Development, 2005, p. 9) and same number for ICT indicators in the Business sector (Measuring ICT: The global status of ICT indicators-Partnership on Measuring ICT for De-velopment, 2005, p. 23).
The communication and collaboration is very important for businesses. In today world, the num-ber of existing firms, the micro, small and medium size companies (SMEs) constitute the majority and
absorb an enormous part of active population. SMEs dominate the European Union’s economy, make up 99% of all businesses, provide two-thirds of private sector jobs and create most new jobs. More than half of the EU’s private sector workers are employed by SMEs. Thus, SMEs are the engine of the economy, and their success is critical for economic growth.
SMEs, also dominate the Macedonian economy (99% of all companies are SMEs). The deployment of ICT by enterprises of all sizes is growing, but one issue for the knowledge society is that small enterprises are lagging behind large firms. For in-stance, while 96% of large enterprises had a broad-band connection in 2008, it has been 79% of small enterprises. There is also a wide variation in the take up of advanced applications that are associated with higher productivity: in 2008, only 14% of small enterprises received orders online compared with 33% of large firms (European Commission, 2009). SMEs are especially heterogeneous, with high-tech knowledge-based firms at one extreme and corner shop at the other. On average, innova-tion intensity is generally greater in larger firms, and of course, we should recognize that SMEs of-ten thrive as suppliers to large companies. Not all small firms are innovative or possess the aspiration and potential for high growth. All above discussed and presented means that using of ICT is impor-tant equally for all economic subjects (all kinds of companies, institutions and population). However, if we want high implementation and using of ICT, we need to invest efforts to achieve it. Therefore, the EU in view point of ICT is result of organized access yet in early ‘90s in the last century, take over different systematic actions documented in many documents – we will adduce some of them: eEu-ropa-An Information Society-eEurope-an informa-tion society for all, e-Europe 2002 and IS for all, Action plan eEurope 2005: Information society for all, EU: Riga Ministerial Declaration, Ministers of the EU - where working document was promoted in 2007 with main focus in facets of inclusion: 1) access divide or “early digital divide” which con-siders the gap between with and without access; 2) Table 1 Internet user per 100 inhabitants, 2000-2010*
the usage divide or “primary digital divide” concen-trate to those who have access, but are non-users;
3) the divide stemming from quality of use or “sec-ondary digital divide” focusing on differentials in participation rates for people who have access and are users. The European Commission adopted the Digital Agenda for Europe-DAE 2010, which is update with Lisbon conference 2015. European knowledge society with conference in Lisbon -Agenda-creating impact for eUnion 2015, for prosperity and competitive economy, sustainable environment and healthy society and many others.
4. Digital Gap among Chosen Member States of EU27
Digital gap exists among EU27 countries, which for different ICT indicators is very different. The biggest range or lagging behind, we have among last received member states Romania and Bulgaria, and Greece as older member state, that is not very different towards them from view-point of ICT. Therefore form aspect of households with fixed broadband Internet connection, the households with Internet access, online banking, reading news-papers online, use of government services online and others, for chosen country members, the per-centage is about the average of EU27, and only Bulgaria, Romania and Greece and Croatia are un-der the average of EU27 (Table 2). Internet users can use e-government services which has highest level towards all ICT indicators (for EU27 is 80.9%), e-commerce inside separate countries are 40.4% which is EU level and cross-border
e-commerce is (8.8%) as a percentage of population (Table. 2.). But, there are citizens in EU27 who still
aren’t using the Internet. This percent on level EU27 is 26.3% and the last countries which ad-joined EU, influence to this high percentage. Among the developed countries this percent is be-tween 10 and 20% compared with 2005 when it was above 30% (Table 2).
Titles of column rows from 1-13 in Table 2:
1. Households with a fixed broadband connection 2. Households with access to the Internet at home 3. Population who have never used the Internet 4. Online banking (% of population)
5. Reading online news paper/magazines (% population)
6. Use of e-government services last 3 month (%population)
7. Online banking (% of Internet users)
8. Use of e-government services (% of Internet users last 3 months)
9. Enterprises with fixed broadband connection 10.Available e-government services – citizens 11.Ordering goods/services online (%population) 12.Cross-border e-commerce (%population) 13.Cross-border e-commerce (% of Internet users)
At view point of business sectors and its busi-ness process indicators, for example: integrated Internet processes in large companies that have a high percent (at level of EU27 is 79.6%, at level of SMEs is 39,6%), e-commerce as selling/buying online is still on unsatisfied level (SMEs selling is 12.8%, SMEs purchasing is 26.4% at level of EU27). Using of e-government services is high Table 2 Chosen ICT indicators for chosen EU27 countries (population), Albania, Croatia, FYR Macedonia, Kosovo,
Monte-negro and Serbia in 2010
1 2 3/2005 3/2010 4 5 6 7 8 9 10 11 12 13
EU27 60.8 70.1 43.2 26.3 36.0 34.3 31.7 52.1 45.8 80.9 40.4 8.8 12.4 71.5
Sveeden 82.6 90.9 11.6 6.3 75.0 54.1 61.6 82.6 67.8 100 65.7 12.7 13.8 92.4
Germany 75.2 82.5 28.8 16.6 42.6 42.0 37.1 53.4 46.5 90.9 59.4 7.9 9.6 79.1
France 66.8 73.6 45.7/2006 17.8 52.6 21.3 36.8 67.0 46.8 83.3 55.7 15.5 19.4 68.9
Netherland 79.7 90.9 11.6 8.2 77.3 47.9 58.5 85.6 64.8 100 67.2 11.8 13.0 88.6
Denmark 80.1 86.1 14.4 9.3 70.5 63.3 72.0 80.3 82.0 91.7 67.5 28.4 32.0 85.9
UK 75.2 78.6 28.2 12.7 45.5 42.6 40.2 54.7 48.3 97.0 67.5 10.4 12.2 82.0
Slovenia 62.0 68.1 47.7 28.4 28.5 41.1 40.4 42.0 59.5 100 26.7 9.8 14 64.8
Greece 41.2 46.4 72.8 52.5 5.7 25.4 13,4 12.8 30.2 37.50 12.4 4.4 9.6 47.546.2
Bulgary 26.0 33.1 70.6/2006 42.1 2.5 20.0 15.3 5.7 35.4 66.7 5.1 3.1 3.8 50.047.5
Croatia 49.1 56.5 55.6/2007 51.2 20.3 38.1 16.1 37.3 29.6 50.0 14.1 3.1 5.5 50.0
Albania n.a. n.a. n.a. n.a. n.a. n.a. n.a. n.a. n.a. n.a. n.a. n.a. n.a. 43.5
Kosovo n.a. n.a. n.a. n.a. n.a. n.a. n.a. n.a. n.a. n.a. n.a. n.a. n.a. 20.6
FYR
Mace-donia 42.1 61.2 38.2 n.a. n.a. 65.1 22.2 n.a. n.a. 38.5 4.1 n.a. n.a. 51.0
Serbia 31.0 n.a. 53.0 n.a. n.a. 63.7 13.2 63.2 n.a. n.a. 9.3 n.a. n.a. 55.9
Montenegro 33.9 18.8 n.a. n.a. n.a. n.a. n.a. n.a. n.a. n.a. n.a. n.a. 44.1
Management Information Systems
Vol. 8, 1/2013, pp. 020-028
25
(75.7% at EU27 level). Only the indicator“Avail-able e-government services for enterprises” at level EU27 is 89.4% or for separate countries as Swe-den, Germany, Netherland, Denmark and UK and some other countries have a saturation of 100% (Table 3).
Titles of column rows from 1-10 for Table 3:
1. Integration of Internal processes (large enter-prises)
2. Integration of Internal processes (SMEs) 3. Enterprises selling online
4. Enterprises purchase online 5. SMEs- selling online 6. SMEs- purchases online
7. Use of e-government services (% enterprises) 8. Use of e-procurement services (% enterprises) 9. Enterprises with fixed broadband connection 10.Available e-government services.
5. The Needs of E-Inclusion
Digital gap present fact for inequality usage of ICT. Decreasing of digital gap present e-inclusion. Cre-ating an e-included society is an economic oppor-tunity and social necessity. E-inclusion enables em-ployment opportunities, higher quality of life - to be in touch with family, to deal with public ser-vices, social participation and cohesion, to be part of culture, entertainment, leisure and political dia-logue, improve the quality of life of the disadvan-taged people, people in rural areas, and generate new local-community services [WSIS, 2003]. In an inclusive information society, ICT present the po-tential to ensure non-discriminatory access among all entity (social, economic or others) in one soci-ety.
A common vision of an Inclusive Information Society was initiated about 10 years ago, at the 2003 World Summit on the Information Society (WSIS) in Geneva (WSIS, 2003). At the summit, ICT was viewed as an essential foundation for an inclusive information society. As a follow-up on the above common vision, in 2006, ministers under
the European Union (EU) signed the Riga Ministe-rial Declaration to declare their commitment to several concrete targets aimed at ICT for an Inclu-sive information society. These targets included: improving the Internet usage; digital literacy and skills; the availability and accessibility of ICT; and broadband coverage at least 90% by 2010 (eInclu-sion@EU, 2006). This initiative was called i2010 strategy. The mandate of the Riga declaration was to provide ICT for an inclusive information society to enable everyone to participate despite being so-cietal or economical disadvantaged.
In an inclusive information society, ICT pre-sents the potential to ensure non-discriminatory access, bridge broadband and accessibility gaps, improve the quality of life, enhance the social de-velopment programs, and generate new local-community services [WSIS, 2003].
Digital inclusion or e-inclusion help for: em-ployability – if we have a basic ICT experience, indispensable demand for growing number of jobs; economic reasons - without happen off-liners, and non ICT literate citizens of population to be e-consumers; equally maintain of citizens in informa-tion society - if there are not ICT access or skills will grow default of day-to-day life (online banking, booking tickets; possibilities for efficient public services; efficient government, health, tax, e-education, etc., which ask for digitally literate pub-lic is prerequisite.
For achievement of e-inclusion, EU with Lis-bon agenda tends toward all together inclusion of information society based on wide usage of ICT in public services, SMEs and households. The meas-ure of development of information society belongs to e-inclusion and contains ICT services, public services, e-skills, broadband access and imrove-ment of security in communication networks.
There are authors and studies which think that e-inclusion is term which changes for term digital gap (EU: Riga Ministerial Declaration, 2006, p. 7). But, we do not think that e-inclusion need to be Table 3 Chosen ICT indicators for chosen EU27 countries (for business sectors) at 2010
changed for digital gap. With digital gap we think that is determined inequality in using of ICT among individuals, businesses, areas, regions, coun-tries and continents, and with e-inclusion we do efforts for bridging the digital inequality. There are studies which use term e-readiness, for which we think that the term is suitable for presenting of efforts for achievement of e-inclusion. E-readiness is instrument for measuring different components of social, political, economic and technological de-velopment of the countries.
As presented in this analysis, 100% saturation is achieved only for indicator Available e-government services among countries (Table 3, column 10), and all the rest indicates at view point of its value that there is a space for improvement. EU27 has incor-porated targets (Digital Agenda Scoreboard, 2011, pp. 11-17) for: the entire EU to be covered by broadband by 2013; 50% of the population to buy online by 2015; 20% of the population to buy online cross-border by 2015; 33% of SMEs to conduct online purchases/sales by 2015; to in-crease regular Internet usage from 60 to 75% by 2015 and from 41% to 60% between disadvan-taged people; to have the proportion of population that has never used the Internet from 30% to 15% by 2015; 50% of citizens to use e-government by 2015 with more than half of them returning filled-in forms; all key cross-border public services to be agreed by Member States in 2011, and to be avail-able online by 2015; EU to be covered by broad-band above 30 Mbps by 2020 and 50% of the EU to subscribe to broadband above100 Mbps by 2020.
This means that e-inclusion has not achieved maximum saturation; even majority of them are highly developed countries. But, to achieve high e-inclusion, EU countries are continually making efforts. That is supported with words of high EU officer like Vice-President of the European Com-mission of EU27, Neelie Kroes, responsible for the Digital Agenda, has commented: “We – compa-nies, governments and civil society – must make that investment for the future, and skill up to face new challenges. And we must include everyone; we must get “Every European Digital” so that we can all benefit from “smart”, innovation-based eco-nomic growth”. (Announcing the 2012 e-inclusion awards, 2012).
The common opinion is that ICT has econom-ics, social and knowledge dimension. It has been recognized that 25% of the GDP growth and 40% of productivity growth in the EU is generated by a consistent use of ICT.
The economics dimension from ‘90s in 20th century
was connected with save of expenses (for commu-nication and collaboration), data interchange, business, automation of business processes, e-commerce, e-health, e-government ITC, (Gurbax-ani & Whang, 1991; Brynjolfsson, Malone, Gur-baxani & Kambil, 1994; Brynjolfsson & Hitt, 1996; Brynjolfsson & Yang, 1996; Zhu & Kraemer, 2005a; Zhu & Kraemer, 2005b; Srinivasan & Kekre 1994; Lehr & Lichtenberg, 1998; Menon, 1999). We should add new business possibilities, possibili-ties for e-skills, new business opportunipossibili-ties and jobs.
The social dimension of ICT impacts is also widely
recognized through improvement of quality of life through the convenience of the online services which they can support, increased quality, variety, customer service, speed and responsiveness, twenty-four hour ATMs, education and public in-formation and other wealth for population (Bryn-jolfsson & Yang, 1996; Banker & Kauffman, 1988).
The knowledge dimension is potential associated
with ICTs. It has simplified unforeseen progress in science in the technology domain, the industry domain, the economy domain and the social do-main, as is evidenced in frontier areas such as bio-technology, bioinformatics, space and astronomy, and the nuclear and nano-sciences.
6. The Case of FYR Macedonia
Retrospection of the needs of implementation, de-velopment and usage of ICT for faster economic development, FYRM has targeted Information so-ciety as strategic destination and in this direction builds many projects for higher IT literacy among citizens and implementation of ICT in business sector. It is being done on systematic organized way, preparing many documents, laws, action plans, projects (as the world on hand, site at hand, etc.), programs, support and participation on con-ferences as Initiative for e-South East Europe (eSEE Initiative) in Regional cooperation Council.
Management Information Systems
Vol. 8, 1/2013, pp. 020-028
27
included in labor market as educated IT laborforce, participation in education with IT for unem-ployed persons for administrators and data-base designers for Microsoft, Linux and Oracle pro-grammers. Also takes efforts for improvement of ICT infrastructure (equipped with broadband internet (from 15018 users at 2006 to 262371 at 2011-which is near 20 times increased), projects e-government – for services for citizens and busi-nesses, e-tax, e-customers, e-education, e-cadaster etc.
The efforts of government for e-commerce is important at the same time. Now the offer is unsat-isfied with 80s e-stores. The citizens have about 1.5 million debit and credit cards (Report of NBRM (National Bank of Republic of Macedonia, 2011), all traditional banks have introduced e-banking, for them exist processing payment center in the state – Casys - that means the prconditions exist for e-commerce. For higher practice is missing only IT culture or willingness of citizens to support their own needs using e-stores online. One reason for small market of e-commerce in FYRM is deficient knowledge of possibilities which offer e-stores. Pre-conditions for existing of these e-stores last; we have the Law for e-commerce from 2007 and other regulations. Only the potential owners of e-stores – entrepreneurs have not enough technical pre-knowledge for e-commerce processes, from orders, connection with payment processor, sys-tems to support fulfillment and shipping proce-dures. Therefore, the government of FYRM through Ministry of Information society and ad-ministration and Ministry of Economy in framwork of action plan for development of e-commerce offered 100 firms as start-ups or exist-ing firms to implement develop and host durexist-ing 2012 and 2013. The owners of this e-stores should be educated to manage this type of virtual store including the newest technological and Internet trends. On that way this entrepreneurs should be ready to sale products or services in FYRM and in abroad. The chosen entrepreneurs on competition way will get ready store, start with web design site for e-store, module for calculation the price for shipping, processing the payment, and hosting for one year (as Amazon Elastic Cloud). At the second year, the owners of these e-stores need to be ready to continue to work and host the website by them-selves.
All these above presented efforts tend to have 55% of households with Internet access at 2011, then 58.9% of population with age among 15 and 74 to use computers, broadband Internet
connec-tion to be 77% of households. But, still have a big number of citizens who aren’t using the computer or Internet, 40.4% (Figure 8). It is similar situation with last assumptive member states of EU27 and for example Greece as older member state which has citizens (52.5%) in 2010, who have never used Internet (Table 3). Business community and the companies in it are equipped with 92.7% com-puters, 84.1% Internet, with website 42.5%, with Intranet 19.3%, with Extranet 13.2%, ERP soft-ware, EDI exchange, and web sales are under 10% (Figure 7).
Figure 7 ICT in the enterprises in FYRM in 2010
Figure 8 ICT for population and household in FYRM in 2010
7. Conclusion
con-tinually and the countries with highest level of us-age of ICT are in the position to implement newest innovations with higher performance in ICT. That means no one country can say that has achieved greatest saturation in ICT and the others (with very low level of ICT usage) need to tend toward faster going forward in usage of ICT. That is situation with above considering and analyzing countries in this paper.
References
(2012). Retrieved March 25, 2012 from A Visualisation tool for selected indicators of the Digital Agenda Scoreboard: http://scoreboard.lod2.eu/
Announcing the 2012 e-inclusion awards. (2012, February 6). Retrieved
February 24, 2012 from e-inclusion:
http://www.e- inclusionawards.eu/2012/02/press-release-announcing-2012-e-inclusion-awards/
Banker, R. D., & Kauffman, R. J. (1988). Strategic Contributions of Informa-tion Technology: An Empirical Study of ATM Networks. In J. DeGross, & M. Olson, Proceedings of the Ninth International Conference on International
Systems (pp. 141-150). Minneapolis: Springer.
Brynjolfsson, E., & Hitt, L. (1996). Paradox Lost? Firm-Level Evidence on the Returns to Information Systems Spending. Management Science, 42
(4), 541-559.
Brynjolfsson, E., & Yang, S. (1996). Information Technology and Productiv-ity: A Review of Literature. Advances in Computers, 43, 179-214. Brynjolfsson, E., Malone, T. W., Gurbaxani, V., & Kambil, A. (1994). Does Information Technology Lead to Smaller Firms? Management Science, 40
(12), 1628-1644.
eInclusion@EU. (2006). Strengthening eInclusion and Accessibility across
Europe. Retrieved February 20, 2012 from eInclusion@EU Bulletin:
http://library.esangathan.eu/?p=37
EU: Riga Ministerial Declaration. (2007, November 16). Retrieved
Septem-ber 28, 2012 from epractice.eu: http://www.epractice.eu/en/library/281597 European Commission. (2009, August 4). Europe’s Digital Competitiveness
Report Main Achievements of the i2010 Strategy 2005 -2009. Retrieved
February 24, 2012 from European Commission:
ec.europa.eu/../eeurope/i2010/docs/..report/../com_2009_390_en.pdf Gurbuxani, V., & Whang, S. (1991). The Impact of Information Systems on Organizations and Markets. Communications of the ACM, 34 (1), 59-73. Hargittai, E. (2003). The Digital Divide and What To Do About It. Retrieved February 20, 2012 from Princeton University:
http://www.princeton.edu/~eszter/research/c04-digitaldivide.html Hîncu, D., Frăłilă, L., & Tanłău, A. (2011). Gap Indicator for Measuring Digital Divide. Management Research and Practice, 3 (2), 74-88.
Information and Communication Technology (ICT) Statistics. (2012).
Re-trieved March 24, 2012 from ITU: www.itu.int/ict
Internet Usage Stats and Telecom Reports. (2012). Retrieved March 24,
2012 from Internet World Stats:
http://www.internetworldstats.com/euro/al.htm
Lehr, W., & Lichtenberg, F. R. (1998). Computer Use and Productivity Growth in U.S. Federal Government Agencies. Journal of Industrial
Eco-nomics, 46 (2), 257-279.
Markus, M. L. (1987). Toward a "critical mass" theory of interactive media: Universal access, interdependence and diffusion. Communication
Re-search, 14 (5), 461-511.
Measuring ICT: The global status of ICT indicators-Partnership on
Measur-ing ICT for Development. (2005). Retrieved February 22, 2012 from
http://www.caricomict4d.org/stats/2005/Measuring%20ICT%20- %20The%20Global%20Status %20of%20ICT %20 Indicators%20- %20UN%202005d.pdf
Measuring the Impacts of ICT Using Official Statistics. (2008). Retrieved
February 24, 2012 from
http://www.google.rs/url?sa=t&rct=j&q=&esrc=s&source=web&cd=1&cad=rj a&ved=0CC8QFjAA&url=http%3A%2F%2Fwww.oecd.org%2Fdataoecd%2 F43%2F25%2F39869939.pdf&ei=KkNVUfH4CqHj4QSxq4CYDw&usg=AF QjCNFGnQL6rYuzZ5qIuMIXX-W8nuqzXA&bvm=bv.44442042,d.bGE Menon, N. (1999). The Impact of Information Technology: Evidence from
the Healthcare Industry. New York: Garland Publishing.
OECD. (2001). Understanding the Digital Divide. Retrieved February 24, 2012 from OECD: http://www.oecd.org/internet/ieconomy/1888451.pdf Rogers, Е. М. (1995). Diffusion of Innovations (4th ed.). New York: Free Press.
Srinivasan, K., & Kekre, S. (1994). Impact of Electronic Data Interchange
Technology On Jit Shipments. Management Science. Retrieved February
22, 2012 from www.andrew.cmu.edu: http://www.andrew.cmu.edu/user/tridas/vita.html
Valente, T. (1993). Diffusion of innovations and policy decision-making.
Journal of Communication, 43, 30-45.
World Summit on the Information Society-WSIS. (2003, December 12).
Building the Information Society: a global challenge in the new Millennium.
Declaration of Principles, Document WSIS-03/GENEVA/DOC/4-E.
Re-trieved March 1, 2012 from ICSU:
www.icsu.org/.../49_DD_FILE_Decl_of_Principles_12.12.03.pdf Zhu, K., & Kraemer, K. L. (2005). E-Commerce Metrics for Net-Enhanced Organizations: Assessing the Value of E-Commerce to Firm Performance in the Manufacturing Sector. Information Systems Research, 13 (3), 275-295.
Zhu, K., & Kraemer, K. L. (2005). Post-Adoption Variations in Usage and Value of E-Business by Organizations: Cross-Country Evidence from the Retail Industry. Information Systems Research, 16 (1), 61–84.
Vera Naumovska
University “Ss. Cyril & Methodius” Faculty of Economics
Bul. Goce Delchev 3V 1000 Skopje