T
ITLE
:
E
MERGENCE OF
I
NVARIANT
R
EPRESENTATION OF
1V
OCALIZATIONS IN THE
A
UDITORY
C
ORTEX
2Running title: Invariant coding in the auditory cortex. 3
4
Authors and Affiliations: 5
Isaac M. Carruthers1,2, Diego Laplagne3, Andrew Jaegle1,4, John Briguglio1,2, Laetitia
6
Mwilambwe-Tshilobo1, Ryan G. Natan1,3, Maria N. Geffen1,2,4 *
7
1. Department of Otorhinolaryngology and Head and Neck Surgery, University of
8
Pennsylvania, Philadelphia PA
9
2. Graduate Group in Physics, University of Pennsylvania, Philadelphia PA
10
3. Brain Institute, Federal University of Rio Grande do Norte, Natal, Brazil
11
4. Graduate Group in Neuroscience, University of Pennsylvania, Philadelphia PA
12
* corresponding author 13
14 15
Corresponding author contact information: 16
Dr. Maria Neimark Geffen 17
18
Address:
19
Department of Otorhinolaryngology and Head and Neck Surgery 20
University of Pennsylvania Perelman School of Medicine 21
5 Ravdin 22
3400 Spruce Street 23
Philadelphia, PA 19104 24
Telephone: (215) 898-0782 25
Fax: (215) 898-9994 26
Email: [email protected] 27
28 29 30
ABSTRACT 31
An essential task of the auditory system is to discriminate between different communication 32
signals, such as vocalizations. In everyday acoustic environments, the auditory system needs 33
to be capable of performing the discrimination under different acoustic distortions of 34
vocalizations. To achieve this, the auditory system is thought to build a representation of 35
vocalizations that is invariant to their basic acoustic transformations. The mechanism by 36
which neuronal populations create such an invariant representation within the auditory cortex 37
is only beginning to be understood. We recorded the responses of populations of neurons in 38
the primary and non-primary auditory cortex of rats to original and acoustically distorted 39
vocalizations. We found that populations of neurons in the non-primary auditory cortex 40
exhibited greater invariance in encoding vocalizations over acoustic transformations than 41
neuronal populations in the primary auditory cortex. These findings are consistent with the 42
hypothesis that invariant representations are created gradually through hierarchical 43
transformation within the auditory pathway. 44
INTRODUCTION 46
In everyday acoustic environments, communication signals are subjected to acoustic 47
transformations. For example, a word may be pronounced slowly or quickly, or by different 48
speakers. These transformations can include shifts in spectral content, variations in 49
frequency modulation, and temporal distortions. Yet the auditory system needs to preserve 50
the ability to distinguish between different words or vocalizations under many acoustic 51
transformations, forming an “invariant” or “tolerant” representation (Sharpee et al. 2011). 52
Presently, little is understood about how the auditory system creates a representation of 53
communication signals that is invariant to acoustic distortions. 54
55
It has been proposed that within the auditory processing pathway, invariance emerges in a 56
hierarchical fashion, with higher auditory areas exhibiting progressively more tolerant 57
representations of complex sounds. The auditory cortex (AC) is an essential brain area for 58
encoding behaviorally important acoustic signals (Aizenberg 2013; Engineer et al. 2008; Fritz 59
et al. 2010; Galindo-Leon et al. 2009; Recanzone and Cohen 2010; Schnupp et al. 2006; 60
Wang et al. 1995). Up to and within the primary auditory cortex (A1), the representations of 61
auditory stimuli are hypothesized to support an increase in invariance. Whereas neurons in 62
input layers of A1 preferentially respond to specific features of acoustic stimuli, neurons in the 63
output layers become more selective to combinations of stimulus features (Atencio et al. 64
2009; Sharpee et al. 2011). In the visual pathway, recent studies suggest a similar organizing 65
principle (DiCarlo and Cox 2007), such that populations of neurons in higher visual area 66
exhibit greater tolerance to visual stimulus transformations than neurons in the lower visual 67
area (Rust and DiCarlo 2012; 2010). Here, we tested whether populations of neurons beyond 68
70
We focused on the transformation between A1 and one of its downstream targets in the rat, 71
the supra-rhinal auditory field (SRAF) (Arnault and Roger 1990; Polley et al. 2007; Profant et 72
al. 2013; Romanski and LeDoux 1993b). A1 receives projections directly from the lemniscal 73
thalamus into the granular layers (Kimura et al. 2003; Polley et al. 2007; Roger and Arnault 74
1989; Romanski and LeDoux 1993b; Storace et al. 2010; Winer et al. 1999), and sends 75
extensive convergent projections to SRAF (Covic and Sherman 2011; Winer and Schreiner 76
2010). Neurons in A1 exhibit short-latency, short time-to-peak responses to tones (Polley et 77
al. 2007; Profant et al. 2013; Rutkowski et al. 2003; Sally and Kelly 1988). By contrast, 78
neurons in SRAF exhibit delayed response latencies, longer time to peak in response to 79
tones, spectrally broader receptive fields and lower spike rates in responses to noise than 80
neurons in A1 (Arnault and Roger 1990; LeDoux et al. 1991; Polley et al. 2007; Romanski 81
and LeDoux 1993a), consistent with responses in non-primary AC in other species (Carrasco 82
and Lomber 2011; Kaas and Hackett 1998; Kikuchi et al. 2010; Kusmierek and Rauschecker 83
2009; Lakatos et al. 2005; Petkov et al. 2006; Rauschecker and Tian 2004; Rauschecker et 84
al. 1995). These properties also suggest an increase in tuning specificity from A1 to SRAF, 85
which is consistent with the hierarchical coding hypothesis. 86
87
Rats use ultra-sonic vocalizations (USVs) for communication (Knutson et al. 2002; Portfors 88
2007; Sewell 1970; Takahashi et al. 2010). Like mouse USVs (Galindo-Leon et al. 2009; Liu 89
and Schreiner 2007; Marlin et al. 2015; Portfors 2007), male USVs evoke temporally precise 90
and predictable patterns of activity across A1 (Carruthers et al. 2013), thereby providing us 91
an ideal set of stimuli with which to probe invariance to acoustic transformations in the 92
frequency USVs, which are produced during positive social, sexual and emotional situations 94
(Barfield et al. 1979; Bialy et al. 2000; Brudzynski and Pniak 2002; Burgdorf et al. 2000; 95
Burgdorf et al. 2008; Knutson et al. 1998; 2002; McIntosh et al. 1978; Parrott 1976; Sales 96
1972; Wohr et al. 2008). The specific USVs were recorded during friendly male adolescent 97
play (Carruthers et al. 2013; Sirotin et al. 2014; Wright et al. 2010). Responses of neurons in 98
A1 to USVs can be predicted based on a linear non-linear model that takes as an input two 99
time-varying parameters of the acoustic waveform of USVs: the frequency- and temporal-100
modulation of the dominant spectral component (Carruthers et al. 2013). Therefore, we used 101
these sound parameters as the basic acoustic dimensions along which the stimuli were 102
distorted. 103
104
At the level of neuronal population responses to USVs, response invariance can be 105
characterized by measuring the changes in neurometric discriminability between USVs as a 106
function of the presence of acoustic distortions. Neurometric discriminability is a measure of 107
how well an observer can discriminate between stimuli based on the recorded neuronal 108
signals (Bizley et al. 2009; Gai and Carney 2008; Schneider and Woolley 2010). Because this 109
measure quantifies available information, which is a normalized quantity, it allows us to 110
compare the expected effects across two different neuronal populations in different 111
anatomical areas. If the representation in a brain area is invariant, discriminability between 112
USVs is expected to show little degradation in response to acoustic distortions. On the other 113
hand, if the neuronal representation is based largely on direct encoding of acoustic features, 114
rather than encoding of the vocalization identify, the neurometric discriminability will be 115
Here, we recorded the responses of populations of neurons in A1 and SRAF to original 117
and acoustically distorted USVs, and tested how acoustic distortion of USVs affected the 118
ability of neuronal populations to discriminate between different instances of USVs. We found 119
that neuronal populations in SRAF exhibit greater generalization for acoustic distortions of 120
vocalizations than neuronal populations in A1. 121
122
METHODS 124
Animals. All procedures were approved by the Institutional Animal Care and Use Committee
125
of the University of Pennsylvania. Subjects in all experiments were adult male Long Evans 126
rats, 12-16 weeks of age. Rats were housed in a temperature and humidity-controlled 127
vivarium on a reversed 24 hour light-dark cycle with food and water provided ad libitum. 128
Stimuli. The original vocalizations were extracted from a recording of an adult male Long
129
Evans rat interacting with a conspecific male in a custom built social arena (Figure 1A). As 130
described previously (Sirotin et al. 2014), the arena is split in half and kept in the dark, such 131
that the two rats can hear and smell each other and their vocalizations can be unambiguously 132
assigned to the emitting subject. In these sessions, rats emitted high rates of calls from the 133
“50 kHz” family and none of the “22 kHz” type, suggesting interactions were positive in nature 134
(Brudzynski 2009). Recordings were made using condenser microphones with nearly flat 135
frequency response from 10 to 150 kHz (CM16/CMPA-5V, Avisoft Bioacustics) digitized with 136
a data acquisition board at 300 kHz sampling frequency (PCIe-6259 DAQ with BNC-2110 137
connector, National Instruments). 138
We selected 8 representative USVs with distinct spectro-temporal properties (Figures 139
1, 2) (Carruthers et al. 2013) from the 6865 ones emitted by one of the rats. We contrasted 140
mean frequency and frequency bandwidth of the selected calls with that of the whole 141
repertoire from the same rat (Figure 2B). We calculated vocalization center frequency as the 142
mean of the fundamental frequency and bandwidth as the root mean square of the mean-143
subtracted fundamental frequency of each USV. We denoised and parametrized USVs 144
following methods published previously by our group (Carruthers et al. 2013). Briefly, we 145
constructed a noiseless version of the vocalizations using an automated procedure. We 146
any time, the frequency,
f
(
t
)
, and amplitude,a t
( )
, of that tone were matched to the peak148
amplitude and frequency of the recorded USV at all times, using the relation 149
x t
( )
=a t( )
sin 2π f(τ)dτ0 t
. 150We constructed the acoustic distortions of the 8 selected vocalizations along the 151
dimensions that are essential for their encoding in the auditory pathway (Figure 1B). For each 152
of these 8 original vocalizations we generated 8 different transformed versions, amounting to 153
9 versions (referred to as transformation conditions) of each vocalization. We then generated
154
the stimulus sequences by concatenating the vocalizations, padding them with silence such 155
that they were presented at a rate of 2.5Hz. 156
Stimulus Transformations. The 8 transformations applied to each vocalization were: temporal
157
compression (designated T-, transformed by scaling the length by a factor of 0.75: 158
x t
( )
=a t0.75
sin 2π f
(
0.75τ)
dτ0 t 0.75
), temporal dilation (T+, length x 1.25:
159
x t
( )
=a t1.25
sin 2π f
(
1.25τ)
dτ0 t 1.25
), spectral compression (FM-, bandwidth x 0.75:
160
x t
( )
=a t( )
sin 2π
(
0.75(
f(τ
)−f)
+f)
dτ
0 t
), spectral dilation (FM+, bandwidth x 1.25: 161
x t
( )
=a t( )
sin 2π
(
1.25(
f(τ
)−f)
+ f)
dτ
0 t
), spectro-temporal compression (T-/FM-, length and 162
bandwidth x 0.75: x t
( )
=a t 0.75
sin 2π
(
0.75(
f(0.75τ)− f)
+ f)
dτ0 t 0.75
), spectro-temporal
163
x t
( )
=a t 1.25
sin 2π
(
1.25(
f(1.25τ)−f)
+ f)
dτ0 t 1.25
), center-frequency increase (CF+, frequency
165
+ 7.9 kHz: x t
( )
=a t( )
sin 2π
(
f(τ
)+7.9kHz)
0 t
dτ
), and center-frequency decrease (CF-, 166
frequency – 7.9 kHz: x t
( )
=a t( )
sin 2π
(
f(τ
)−7.9kHz)
0 t
dτ
). Spectrograms of denoised 167
vocalizations are shown in Figure 1A. Spectrograms of transformations of one of the 168
vocalizations are shown in Figure 1B. 169
Microdrive implantation. Rats were anesthetized with an intra-peritoneal injection of a mixture
170
of ketamine (60 mg per kg of body weight) and dexmedetomidine (0.25 mg per kg). 171
Buprenorphine (0.1 mg/kg) was administered as an operative analgesic with Ketoprofen (5 172
mg/kg) as post-operative analgesic. A small craniotomy was performed over A1 or SRAF. 8 173
independently movable tetrodes housed in a microdrive (6 for recordings and 2 used as a 174
reference) were implanted in A1 (targeting layer 2/3), SRAF (targeting layer 2/3) or both as 175
previously described (Carruthers et al. 2013; Otazu et al. 2009). The microdrive was secured 176
to the skull using dental cement and acrylic. The tetrodes’ initial lengths were adjusted to 177
target A1 or SRAF during implantation, and were furthermore advanced by up to 2 mm (in 178
40µm increments, once per recording session) once the tetrode was implanted. A1 and
179
SRAF were reached by tetrodes implanted at the same angle (vertically) through a single 180
craniotomy window (on the top of the skull) by advancing the tetrodes to different depths on 181
the basis of their stereotactic coordinates (Paxinos and Watson 1986; Polley et al. 2007). At 182
the endpoint of the experiment a small lesion was made at the electrode tip by passing a 183
short current (10Amp, 10 s) between electrodes within the same tetrode. The brain areas 184
the electrode tracks. Limits of brain areas were taken from (Paxinos and Watson 1986; Polley 186
et al. 2007). 187
Stimulus presentation. The rat was placed on the floor of a custom-built behavioral chamber,
188
housed inside a large double-walled acoustic isolation booth (Industrial Acoustics). The 189
acoustical stimulus was delivered using an electrostatic speaker (MF-1, Tucker-Davis 190
Technologies) positioned directly above the subject. All stimuli were controlled using custom-191
built software (Mathworks), a high-speed digital-to-analog card (National Instruments) and an 192
amplifier (TDT). The speaker output was calibrated using a 1/4 inch free-field microphone 193
(Bruel and Kjaer, type 4939) at the approximate location of the animal’s head. The input to 194
the speaker was compensated to ensure that pure tones between 0.4 and 80 kHz could be 195
output at a volume of 70 dB to within a margin of at most 3dB. Spectral and temporal 196
distortion products as well as environmental reverberation products were >50 dB below the 197
mean SPL of all stimuli, including USVs (Carruthers et al. 2013). Unless otherwise 198
mentioned, all stimuli were presented at 65 dB (SPL), 32-bit depth and 400 kHz sample rate. 199
Electrophysiological recording. The electrodes were connected to the recording apparatus
200
(Neuralynx digital Lynx) via a thin cable. The position of each tetrode was advanced by at 201
least 40µm between sessions to avoid repeated recoding from the same units. Tetrode
202
position was noted to ±20µm precision. Electo-physiological data from 24 channels were
203
filtered between 600 and 6000 Hz (to obtain spike responses), digitized at 32kHz and stored 204
for offline analysis. Single and multi-unit waveform clusters were isolated using commercial 205
software (Plexon Spike Sorter) using previously described criteria (Carruthers et al. 2013). 206
Unit Selection and Firing-rate Matching. To be included in analysis, a unit had to meet the
207
following conditions: 1) its firing rate averaged at least 0.1 Hz firing rate during stimulus 208
vocalization identity during the presentation of at least one vocalization under one of the 210
transformation conditions. We set this threshold to match the elbow in the histogram of the 211
distribution of information rates for all recorded units that passed the firing rate threshold 212
(Figure 5A, inset). We validated this threshold with visual inspection of vocalization response 213
post-stimulus time histograms for units around the threshold. We estimated the information 214
rate for each neuronby fitting a Poisson distribution to the distribution of spike counts evoked 215
by each vocalization. We then computed the entropy of this set of 8 distributions, and 216
subtracted from this value the prior entropy of 3 bits. Entropy was defined as / = 217
∑ / = = − ∑ , , / . We defined Π = ! , the Poisson 218
likelihood of detecting r spikes in response to stimulus s where is the mean number of
219
spikes detected from a neuron in response to stimulus s. The entropy was computed as
220
/ = − ∑ Π, ∑ . We performed this computation separately for each 221
transformation condition. In order to remove a potential source of bias due to different firing 222
rate statistics in A1 and SRAF, we restricted all analyses to the subset of A1 units whose 223
average firing rates most closely matched the selected SRAF units. We performed this 224
restriction by recursively including the pair of units from the two areas with the most similar 225
firing rates. 226
Response Sparseness. To examine vocalization selectivity of recorded units, sparseness of
227
vocalization was computed as: 228
= − ∑ /
∑ /
where is the firing rate to vocalization after the minimum firing rate in response to 229
value was computed separately for each recorded unit for each vocalization transformation, 231
and then averaged over all transformations for recorded units from either A1 or SRAF. 232
Population Response Vector. The population response on each trial was represented as a
233
vector, such that each element corresponded to responses of a unit to a particular 234
presentation of a particular vocalization. Bin size for the spike count was selected by cross-235
validation (Hung et al. 2005; Rust and Dicarlo 2010); we tested classifiers using data binned 236
at 50, 74, 100, and 150 milliseconds. We found the highest performance in both A1 and 237
SRAF when using a single bin 74 ms wide from vocalization onset, and we used this bin size 238
for the remainder of the analyses. As each transformation of each vocalization was presented 239
100 times in each recording session, the analysis yielded of 100 x N matrix of responses for 240
each of the 72 vocalization/transformations (8 vocalizations and 9 transformation conditions), 241
where N was the number of units under analysis. The response of each unit was represented 242
as an average of spike counts from 10 randomly selected trials. This pooling was performed 243
after the segregation of vectors into training and validation data, such that the spike-counts 244
used to produce the training data did not overlap with those used to produce the validation 245
data. 246
Linear Support Vector Machine (SVM) Classifier. We used the support vector machine
247
package libsvm (Chang and Lin 2011), as distributed by the scikit-learn project, version 0.15
248
(Pedregosa et al. 2011) to classify population response vectors. We used a linear kernel 249
(resulting in decision boundaries defined by convex sets in the vector space of population 250
spiking responses), and a soft-margin parameter of 1 (selected by cross-validation to 251
maximize raw performance scores). 252
Classification Procedure. For each classification task, a set of randomly selected N units
253
vector as described above, dividing the data into training and validation sets. For each 255
vocalization, 80 vectors were used to train and 20 to validate per-transformation and within-256
transformation classification (see Across-transformation performance below). In order to
257
divide the data evenly among the nine transformations, 81 vectors were used to train and 18 258
to validate in all-transformation classification. We used the vectors in the training dataset to fit 259
a classifier, and then tested the ability of the resulting classifier to determine which of the 260
vocalizations evoked each of the vectors in the validation dataset. 261
Bootstrapping. The entire classification procedure was repeated 1000 times for each task,
262
each time on a different randomly selected population of units, and each time using a 263
different randomly selected set of trials for validation. 264
Mode of Classification. Classification was performed in one of two modes: In the pairwise
265
mode, we trained a separate binary classifier for each possible pair of vocalizations, and
266
classified which of the two vocalizations evoked each vector. In one-vs-all mode, we trained
267
an 8-way classifier on responses to all vocalizations at once, and classified which of the eight 268
vocalizations was most likely to evoke each response vector (Chang and Lin 2011) 269
(Pedregosa et al. 2011). This was implemented by computing all pairwise classifications 270
followed by a voting procedure. We recorded the results of each classification, and computed 271
the performance of the classifier as the fraction of response vectors that it classified correctly. 272
As there were 8 vocalizations, performance was compared to the chance value of 0.125 in 273
one-vs-all mode and to 0.5 in pairwise mode. 274
Across-transformation performance. We trained and tested classifiers on vectors drawn from
275
a subset of different transformation conditions. We chose the subset of transformations in two 276
different ways: When testing per-transformation performance, we trained and tested on
277
When testing all-transformation performance, we trained and tested on vectors drawn from all
279
9 transformation conditions. 280
Within-transformation Performance. For each subset of transformations on which we tested
281
across-transformation performance, we also trained and tested classifiers on responses 282
under each individual transformation condition. We refer to performance of these classifiers, 283
averaged over the transformation conditions, as the within-transformation performance.
284
Generalization Penalty. In order to evaluate how tolerant neural codes are to stimulus
285
transformation, we compared the performance on generalization tasks with the performance 286
on the corresponding within-transformation tasks. We define the generalization penalty as the 287
RESULTS 289
In order to measure how invariant neural population responses to vocalizations are to 290
their acoustic transformations, we selected USV exemplars and constructed their 291
transformations along basic acoustic dimensions. Rat USVs consist of frequency modulated 292
pure tones with little or no harmonic structure. The simple structure of these vocalizations 293
makes it possible to extract the vocalization itself from background noise with high fidelity. 294
Their simplicity also allows us to parameterize the vocalizations; they are characterized by 295
the dominant frequency, and the amplitude at that frequency, as these quantities vary with 296
time. In turn, this simple parameterization allows us to easily and efficiently transform aspects 297
of the vocalizations. The details of this parameterization and transformation process are 298
reported in depth in our previously published work (Carruthers et al. 2013). 299
We selected 8 distinct vocalizations from recordings of social interactions between male 300
adolescent rats (Carruthers et al. 2013; Sirotin et al. 2014). We chose these vocalizations to 301
include a variety of temporal and frequency modulation spectra (Figure 2A) and to cover the 302
center frequency and frequency bandwidth distribution of the full set of recorded vocalizations 303
(Figure 2B). We previously demonstrated that the responses of neurons to vocalizations were 304
dominated by modulation in frequency and amplitude (Carruthers et al. 2013). Therefore, we 305
used frequency, frequency modulation and amplitude modulation timecourse as the relevant 306
acoustic dimensions to generate transformed vocalizations. We constructed 8 different 307
transformed versions of these vocalizations by adjusting the center frequency, duration 308
and/or spectral bandwidth of these vocalizations (see methods), for a total of 9 versions of 309
each vocalization. The 8 original vocalizations we selected can be seen in Figure 1a, and 310
Figure 1b shows the different transformed versions of vocalization 3. We recorded neural 311
responses in A1 and SRAF in rats as they passively listened to these original and 312
units respond selectively and with high temporal precision to USVs (Figure 3). SRAF units 314
exhibited similar patterns of responses (Figure 4). For instance, the representative A1 unit 315
shown in Figure 3 responded significantly to all of the original vocalizations except 316
vocalizations 5, 6, and 8 (row 1). Meanwhile, the representative SRAF unit in Figure 4 317
responded significantly to all of the original vocalizations except vocalization 6 (row 1). Note 318
that the A1 unit’s response to vocalization 5 varies significantly in both size and temporal 319
structure when the vocalization is transformed. Meanwhile, the SRAF unit’s response to the 320
same vocalization is consistent regardless of which transformation of the vocalization is 321
played. In this instance, the selected SRAF unit exhibits greater invariance to transformations 322
of vocalization 5 than the selected A1 unit. 323
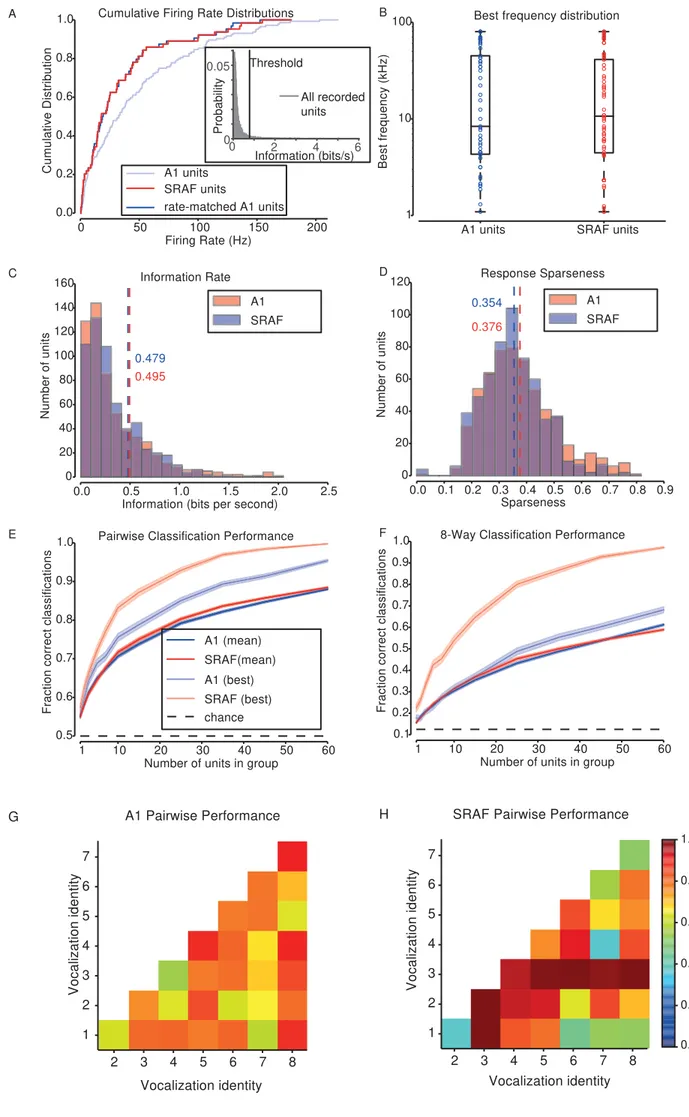
To compare the responses of populations of units in A1 and SRAF and to ensure that 324
the effects that we observe are not due simply to increased information capacity of neurons 325
that fire at higher firing rates, we selected subpopulations of units that were matched for firing 326
rate distribution (Rust and Dicarlo 2010; Ulanovsky et al. 2004) (Figure 5A). We then 327
compared the tuning properties of units from the two brain areas, as measured by the pure-328
tone frequency that evoked the highest firing rate from the units. We found no difference in 329
the distribution of best frequencies between the two populations (Kolmogorov-Smirnov test, p 330
= 0.66) (Figure 5B). We compared the amount of information transmitted about a 331
vocalization’s identity by the spike counts of units in each brain area, and again found no 332
significant difference (Figure 5C, Kolmogorov-Smirnov test, p = 0.42). Furthermore, we 333
computed sparseness of responses of A1 and SRAF units to vocalizations, which is a 334
measure of neuronal selectivity to vocalizations. A sparseness value of 1 indicates that the 335
unit responds differently to a single vocalization than to all others, whereas a sparseness 336
was not significant (Kolmogorov-Smirnov test, p = 0.084). These analyses demonstrate that 339
the selected neuronal populations in A1 and SRAF were similarly selective to vocalizations. 340
Neuronal populations in A1 and SRAF exhibited similar performance in their ability to 341
classify responses to different vocalizations. We trained classifiers to distinguish between 342
original vocalizations on the basis of neuronal responses, and we measured the resulting 343
performances. To ensure that the results were not skewed by a particular vocalization, we 344
computed the classification either for responses to each pair of vocalizations (pairwise 345
performance), or for responses to all 8 vocalizations simultaneously (8-way performance). 346
We found a small but significant difference between the average performance of those 347
classifiers trained and tested on A1 responses and those trained and tested on the SRAF 348
responses (Figure 5E, F), but the results were mixed. Pairwise classifications performed on 349
populations of A1 units were 88.0% correct, and on populations of SRAF units, 88.5% correct 350
(Kolmogorov-Smirnov test, p = 0.0013). On the other hand, 8-way classifications performed 351
on populations of 60 A1 units were 61% correct, and on SRAF units were 59% correct 352
(Kolmogorov-Smirnov test, p = 7.7e-11). Figure 5G, H shows the classification performance 353
broken down by vocalization for pairwise classification for A1 (Figure 5G) and SRAF (Figure 354
4H). There is high variability in performance between vocalization pairs for either brain area. 355
However, the performance levels are similar. Together, these results indicate that neuronal 356
populations in A1 and SRAF are similar in their ability to classify vocalizations. 357
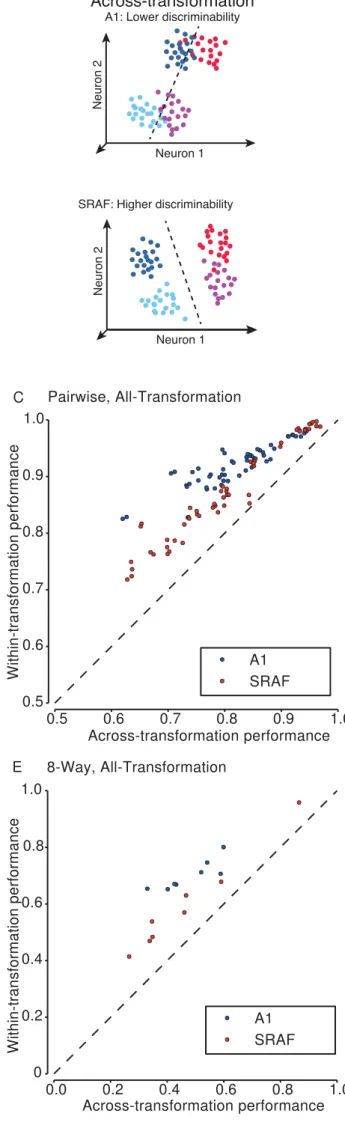
To test whether neuronal populations exhibited invariance to transformations in 358
classifying vocalizations, we measured whether the ability of neuronal populations to classify 359
vocalizations was reduced when vocalizations were distorted acoustically. Therefore, we 360
trained and tested classifiers for vocalizations based on population neuronal responses and 361
compared their performance under within-transformation and across-transformation
362
conditions (Figure 6A). In within-transformation condition, the classifiers were trained and
tested to discriminate responses to vocalizations under a single transformation. In
across-364
transformation condition, the classifier was trained and tested in discriminating responses to
365
vocalizations in original form and one or all transformations. The difference between
within-366
transformation and the across-transformation classifier performance was termed the
367
generalization penalty. If the neuronal population exhibited low invariance, we expected the
368
across-transformation performance to be lower than within-transformation performance and
369
the generalization penalty to be high (Figure 6A top). If neuronal population exhibited high
370
invariance, we expected the across-transformation performance to be equal to
within-371
transformation performance and the generalization penalty to be low (Figure 6A bottom).
372
To ensure that responses to a select transformation were not skewing the results, we 373
computed across-transformation performance both for each of the transformations and for all 374
transformations. In per-transformation condition, the classifier was trained and tested in
375
discriminating responses to vocalizations in original form and under one other transformation. 376
In all-transformation condition, the classifier was trained and tested in discrimination of
377
responses to vocalizations in original form and under all 8 transformations simultaneously. 378
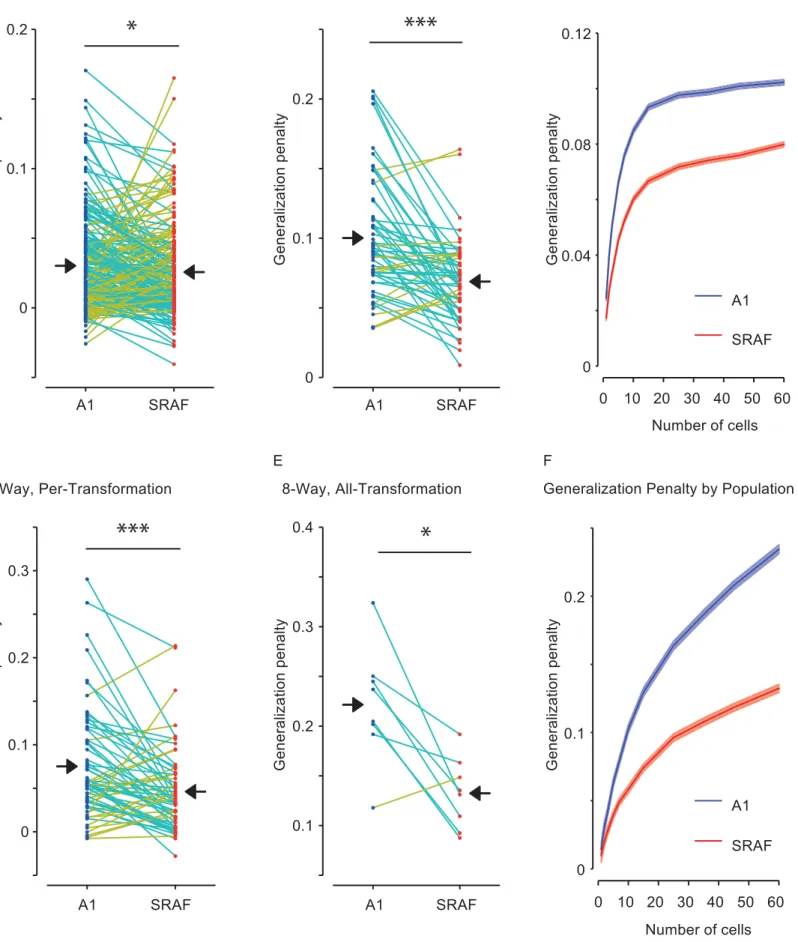
Neuronal populations in A1 exhibited greater reduction in performance on
across-379
transformation condition as compared to within-transformation condition than neuronal
380
population in SRAF. Figures 6 and 7 present the comparison between across-transformation 381
performance and within-transformation performance for each of the different conditions. Note 382
that the different conditions result in very different numbers of data points: the per-383
transformation conditions have 8 times as many data points as the all-transformation 384
conditions, as the former yields a separate data point for each transformation. Similarly, the 385
pairwise conditions yield 28 times as many data points as the 8-way conditions (one for each 386
condition (Figure 6, B-E). However, the difference in performance between within-389
transformation and across-transformation conditions was higher in A1 than in SRAF: SRAF 390
populations suffered a smaller generalization penalty under all conditions tested (Figure 7), 391
indicating that neuronal ensembles in SRAF exhibited greater generalization than in A1. This 392
effect was present under both pairwise (Figures 5B, C, 6A, B) and 8-way classification 393
(Figures 6D, E, 7C, D), and for generalization in per-transformation (Figures 6B, D, 7A, D, 394
pairwise classification, p = 0.028; 8-way classification, p = 1.9e-4; Wilcoxon paired sign-rank 395
test; 60 units in each ensemble tested) and all-transformation mode (Figures 6C, E, 7B, E; 396
pairwise classification, p = 1.4e-5; 8-way classification, p = 0.025; Wilcoxon paired sign-rank 397
test; 60 units in each ensemble tested). The greater generalization penalty for A1 as 398
compared to SRAF was preserved for increasing number of neurons in the ensemble, as the 399
discrimination performance improved and the relative difference between across- and within-
400
performance increased (Figure 7C, F). Taken together, we find that populations of SRAF 401
units are better able to generalize across acoustic transformations of stimuli than populations 402
of A1 units, as characterized by linear encoding of stimulus identity. These results suggest 403
that populations of SRAF neurons are more invariant to transformations of auditory objects 404
than populations of A1 neurons. 405
406
DISCUSSION 407
Our goal was to test whether and how populations of neurons in the auditory cortex 408
represented vocalizations in an invariant fashion. We tested whether neurons in the non-409
primary area SRAF exhibit greater invariance to simple acoustic transformations than do 410
neurons in A1. To estimate invariance in neuronal encoding of vocalizations, we computed 411
the difference in the ability of neuronal population codes to classify vocalizations between 412
neuronal populations in A1 and SRAF exhibited similar selectivity to vocalizations (Figures 3, 414
4, 5), neuronal populations in SRAF exhibited higher invariance to acoustic transformations of 415
vocalizations than in A1, as measured by lower generalization penalty (Figure 6, 7). These 416
results are consistent with the hypothesis that invariance arises gradually within the auditory 417
pathway, with higher auditory areas exhibiting progressively higher invariances toward basic 418
transformations of acoustic signals. An invariant representation at the level of population 419
neuronal ensemble activity supports the ability to discriminate between behaviorally important 420
sounds (such as vocalizations and speech) despite speaker variability and environmental 421
changes. 422
We recently found that rat ultra-sonic vocalizations can be parameterized as amplitude- 423
and frequency-modulated tones, similar to whistles (Carruthers et al. 2013). Units in the 424
auditory cortex exhibited selective responses to subsets of the vocalizations, and a model 425
that relies on the amplitude- and frequency-modulation timecourse of the vocalizations could 426
predict the responses to novel vocalizations. These results point to amplitude- and frequency- 427
modulations as essential acoustic dimensions for encoding of ultra-sonic vocalizations. 428
Therefore, in this study, we tested four types of acoustic distortions based on basic 429
transformations of these dimensions: temporal dilation, frequency shift, frequency modulation 430
scaling and combined temporal dilation and frequency modulation scaling. These 431
transformations likely carry behavioral significance and might be encountered when a 432
speaker’s voice is temporally dilated, or be characteristic of different speakers (Fitch et al. 433
1997). While there is limited evidence that such transformations are typical in vocalizations 434
emitted by rats, preliminary analysis of rat vocalizations revealed a large range of variability in 435
these parameters across vocalizations. 436
midbrain exhibit a mix of selective and non-selective responses in rodents (Pincherli 439
Castellanos, 2007; Holmstrom, 2010). At the level of A1, neurons across species respond 440
strongly to con-specific vocalizations (Gehr et al. 2000; Glass and Wollberg 1983; Huetz et al. 441
2009; Medvedev and Kanwal 2004; Pelleg-Toiba and Wollberg 1991; Wallace et al. 2005; 442
Wang et al. 1995). The specialization of neuronal responses for the natural statistics of 443
vocalization has been under debate (Huetz et al. 2009; Wang et al. 1995). The avian auditory 444
system exhibits strong specialization for natural sounds and con-specific vocalizations 445
(Schneider and Woolley 2010; Woolley et al. 2005), and a similar hierarchical transformation 446
has been observed between primary and secondary cortical analogs (Elie and Theunissen 447
2015). In rodents, specialized responses to USVs in A1 are likely context-dependent 448
(Galindo-Leon et al. 2009; Liu et al. 2006; Liu and Schreiner 2007; Marlin et al. 2015). 449
Therefore, extending our study to be able to manipulate the behavioral "meaning" of the 450
vocalizations through training will greatly enrich our understanding of how the transformation 451
that we observe contributes to auditory behavioral performance. 452
A1 neurons adapt to the statistical structure of the acoustic stimulus (Asari and Zador 453
2009; Blake and Merzenich 2002; Kvale and Schreiner 2004; Rabinowitz et al. 2013; 454
Rabinowitz et al. 2011). The amplitude of frequency shift and frequency modulation scaling 455
coefficient were chosen on the basis of the range of the statistics of ultra-sonic vocalizations 456
that we recorded (Carruthers et al. 2013). These manipulations were designed to keep the 457
statistics of the acoustic stimulus within the range of original vocalizations, in order to best 458
drive responses in A1. Psychophysical studies in humans found that speech comprehension 459
is preserved over temporal dilations up to a factor of 2 (Beasley et al. 1980; Dupoux and 460
Green 1997; Foulke and Sticht 1969). Here, we used a scaling factor of 1.25 or 0.75, similar 461
to previous electrophysiological studies (Gehr et al. 2000; Wang et al. 1995), and also falling 462
in which frequency modulation scaling was combined with temporal dilation. This 464
transformation was designed in order to preserve the velocity of frequency modulation from 465
the original stimulus. The observed results exhibit robustness to the type of transformation 466
that was applied to the stimulus, and are therefore likely generalizable to transformations of 467
other acoustic features. 468
In order to quantify the invariance of population neuronal codes, we used the 469
performance of automated classifiers as a lower bound for the information available in the 470
population responses to original and transformed vocalizations. To assay generalization 471
performance, we computed the difference between classifier performance on within- and 472
across- transformation conditions. We expected this difference to be small for populations of 473
neurons that generalized, and large for populations of neurons that did not exhibit 474
generalization (Figure 6A). Computing this measure was particularly important, as 475
populations of A1 and SRAF neurons exhibited a great degree of variability in classification 476
performance for both within- and across- transformation classification (Figure 6 B-E). This 477
variability is consistent with the known details about heterogeneity in neuronal cell types and 478
connectivity in the mammalian cortex (Kanold et al. 2014). Therefore, measuring the relative 479
improvement in classification performance using the generalization penalty overcomes the 480
limits of heterogeneity in performance. 481
In order to probe the transformation of representations from one brain area to the next, 482
we decided to limit the classifiers to information that could be linearly decoded from 483
population responses. For this reason, we chose to use linear support vector machines 484
(SVMs, see methods) for classifiers. SVMs are designed to find robust linear boundaries 485
between classes of vectors in a high-dimensional space. When trained on two sets of 486
vector on one side to the first set, and everything on the other side to the second. In this case 489
finding the “best separation” means a trade-off between having as many of the training 490
vectors as possible be on the correct side, and giving the separating hyperplane as large of a 491
margin (the distance between the hyperplane and the closest correctly classified vectors) as 492
possible (Dayan and Abbott 2005; Vapnik 2000). The result is generally a robust, accurate 493
decision boundary that can be used to classify a vector into one of the two sets. A linear 494
classification can be viewed as a weighted summation of inputs, followed by a thresholding 495
operation; a combination of actions that is understood to be one of the most fundamental 496
computations performed by neurons in the brain (Abbott 1994; deCharms and Zador 2000). 497
Therefore, examination of information via linear classifiers places a lower bound on the level 498
of classification that could be accomplished during the next stage of neural processing. 499
Several mechanisms could potentially explain the increase in invariance we observe 500
between A1 and SRAF. As previously suggested, cortical microcircuits in A1 can transform 501
incoming responses into a more feature-invariant form (Atencio et al. 2009). By integrating 502
over neurons with different tuning properties, higher level neurons can develop tuning to 503
more specific conjunction of features (becoming more selective), while exhibiting invariance 504
to basic transformations. Alternatively, higher auditory brain areas may be better able to 505
adapt to the basic statistical features of auditory stimuli, such that the neuronal responses 506
would be sensitive to patterns of spectro-temporal modulation regardless of basic acoustic 507
transformations. At the level of the midbrain, adaptation to the stimulus variance allows for 508
invariant encoding of stimulus amplitude fluctuations (Rabinowitz et al. 2013). In the mouse 509
inferior colliculus, neurons exhibit heterogeneous response to ultra-sonic vocalizations and 510
their acoustically distorted versions (Holmstrom et al. 2010). At higher processing stages, as 511
auditory processing becomes progressively multi-dimensional (Sharpee et al. 2011), 512
transformations. More complex population codes may provide a greater amount of 514
information in the brain (Averbeck et al. 2006; Averbeck and Lee 2004; Cohen and Kohn 515
2011). Extensions to the present study could be used to distinguish between invariance due 516
to statistical adaptation, and invariance due to feature independence in neural responses. 517
While our results support a hierarchical coding model for the representation of 518
vocalizations across different stages of the auditory cortex, the observed changes may 519
originate at the sub-cortical level, e.g. inferior colliculus(Holmstrom et al. 2010) or differential 520
thalamo-cortical inputs (Covic and Sherman 2011), and already should be encoded within 521
specific groups of neurons or within different cortical layers within the primary auditory cortex. 522
Further investigation including more selective recording and targeting of specific cell types is 523
required to pinpoint whether the transformation occurs throughout the pathway or within the 524
canonical cortical circuit. 525
526
Acknowledgements. 528
529
We thank Drs. Yale Cohen, Stephen Eliades, Marino Pagan, Nicole Rust and members of the 530
Geffen laboratory for helpful discussions on analysis, and Lisa Liu, Liana Cheung, Andrew 531
Davis, Anh Nguyen, Andrew Chen and Danielle Mohabir for technical assistance with 532
experiments. This work was supported by NIDCD NIH R03DC013660, R01DC014700, 533
Klingenstein Foundation Award in Neurosciences, Burroughs Wellcome Fund Career Award 534
at Scientific Interface, Human Frontiers in Science Foundation Young Investigator Award and 535
Pennsylvania Lions Club Hearing Research Fellowship to MNG. IMC and AJ was supported 536
by the Cognition and Perception IGERT training grant. AJ was also partially supported by the 537
Hearst Foundation Fellowship. John Briguglio was partially supported by NSF PHY1058202 538
and US-Israel BSF 2011058. 539
540
References 542
Abbott LF. Decoding neuronal firing and modelling neural networks. Q Rev Biophys 27: 291-331, 543
1994. 544
Aizenberg M, Geffen, M.N. Bidirectional effects of auditory aversive learning on sensory acuity are 545
mediated by the auditory cortex. Nature neuroscience 16: 994-996, 2013. 546
Arnault P, and Roger M. Ventral temporal cortex in the rat: connections of secondary auditory areas 547
Te2 and Te3. J Comp Neurol 302: 110-123, 1990. 548
Asari H, and Zador A. Long-lasting context dependence constrains neural encoding models in rodent 549
auditory cortex. J Neurophysiol 102: 2638-2656, 2009. 550
Atencio C, Sharpee T, and Schreiner C. Hierarchical computation in the canonical auditory cortical 551
circuit. Proc Natl Acad Sci U S A 106: 21894-21899, 2009. 552
Averbeck BB, Latham PE, and Pouget A. Neural correlations, population coding and computation. 553
Nat Rev Neurosci 7: 358-366, 2006. 554
Averbeck BB, and Lee D. Coding and transmission of information by neural ensembles. Trends 555
Neurosci 27: 225-230, 2004. 556
Barfield RJ, Auerbach P, Geyer LA, and Mcintosh TK. Ultrasonic Vocalizations in Rat Sexual-557
Behavior. American Zoologist 19: 469-480, 1979. 558
Beasley DS, Bratt GW, and Rintelmann WF. Intelligibility of time-compressed sentential stimuli. J 559
Speech Hear Res 23: 722-731, 1980.
560
Bialy M, Rydz M, and Kaczmarek L. Precontact 50-kHz vocalizations in male rats during acquisition 561
of sexual experience. Behavioral neuroscience 114: 983-990, 2000. 562
Bizley JK, Walker KM, Silverman BW, King AJ, and Schnupp JW. Interdependent encoding of 563
pitch, timbre, and spatial location in auditory cortex. J Neurosci 29: 2064-2075, 2009. 564
Blake DT, and Merzenich MM. Changes of AI receptive fields with sound density. J Neurophysiol 88: 565
3409-3420, 2002. 566
Brudzynski SM. Communication of adult rats by ultrasonic vocalization: biological, sociobiological, 567
and neuroscience approaches. ILAR journal / National Research Council, Institute of Laboratory 568
Animal Resources 50: 43-50, 2009. 569
Brudzynski SM, and Pniak A. Social contacts and production of 50-kHz short ultrasonic calls in adult 570
rats. J Comp Psychol 116: 73-82, 2002. 571
Burgdorf J, Knutson B, and Panksepp J. Anticipation of rewarding electrical brain stimulation 572
evokes ultrasonic vocalization in rats. Behavioral neuroscience 114: 320-327, 2000. 573
Burgdorf J, Kroes RA, Moskal JR, Pfaus JG, Brudzynski SM, and Panksepp J. Ultrasonic 574
vocalizations of rats (Rattus norvegicus) during mating, play, and aggression: Behavioral 575
concomitants, relationship to reward, and self-administration of playback. J Comp Psychol 122: 357-576
367, 2008. 577
Carrasco A, and Lomber SG. Neuronal activation times to simple, complex, and natural sounds in 578
cat primary and nonprimary auditory cortex. J Neurophysiol 106: 1166-1178, 2011. 579
Carruthers IM, Natan RG, and Geffen MN. Encoding of ultrasonic vocalizations in the auditory 580
cortex. J Neurophysiol 109: 1912-1927, 2013. 581
Chang CC, and Lin CJ. LIBSVM: A Library for Support Vector Machines. Acm T Intel Syst Tec 2: 582
2011. 583
Cohen MR, and Kohn A. Measuring and interpreting neuronal correlations. Nat Neurosci 14: 811-584
819, 2011. 585
Covic EN, and Sherman SM. Synaptic properties of connections between the primary and secondary 586
auditory cortices in mice. Cereb Cortex 21: 2425-2441, 2011. 587
Dayan P, and Abbott LF. Theoretical Neuroscience Computational and Mathematical Modeling of 588
Neural Systems. . Cambridge, MA: MIT Press, 2005. 589
deCharms RC, and Zador A. Neural representation and the cortical code. Annu Rev Neurosci 23: 590
613-647, 2000. 591
Dupoux E, and Green K. Perceptual adjustment to highly compressed speech: effects of talker and 594
rate changes. J Exp Psychol Hum Percept Perform 23: 914-927, 1997. 595
Elie JE, and Theunissen FE. Meaning in the avian auditory cortex: neural representation of 596
communication calls. Eur J Neurosci 41: 546-567, 2015. 597
Engineer CT, Perez CA, Chen YH, Carraway RS, Reed AC, Shetake JA, Jakkamsetti V, Chang 598
KQ, and Kilgard MP. Cortical activity patterns predict speech discrimination ability. Nat Neurosci 11: 599
603-608, 2008. 600
Fitch RH, Miller S, and Tallal P. Neurobiology of speech perception. Annu Rev Neurosci 20: 331-601
353, 1997. 602
Foulke E, and Sticht TG. Review of research on the intelligibility and comprehension of accelerated 603
speech. Psychol Bull 72: 50-62, 1969. 604
Fritz JB, David SV, Radtke-Schuller S, Yin P, and Shamma SA. Adaptive, behaviorally gated, 605
persistent encoding of task-relevant auditory information in ferret frontal cortex. Nat Neurosci 13: 606
1011-1019, 2010. 607
Gai Y, and Carney LH. Statistical analyses of temporal information in auditory brainstem responses 608
to tones in noise: correlation index and spike-distance metric. J Assoc Res Otolaryngol 9: 373-387, 609
2008. 610
Galindo-Leon EE, Lin FG, and Liu RC. Inhibitory plasticity in a lateral band improves cortical 611
detection of natural vocalizations. Neuron 62: 705-716, 2009. 612
Gehr DD, Komiya H, and Eggermont JJ. Neuronal responses in cat primary auditory cortex to 613
natural and altered species-specific calls. Hear Res 150: 27-42, 2000. 614
Glass I, and Wollberg Z. Responses of cells in the auditory cortex of awake squirrel monkeys to 615
normal and reversed species-specific vocalizations. Hear Res 9: 27-33, 1983. 616
Holmstrom LA, Eeuwes LB, Roberts PD, and Portfors CV. Efficient encoding of vocalizations in 617
the auditory midbrain. J Neurosci 30: 802-819, 2010. 618
Huetz C, Philibert B, and Edeline JM. A spike-timing code for discriminating conspecific 619
vocalizations in the thalamocortical system of anesthetized and awake guinea pigs. J Neurosci 29: 620
334-350, 2009. 621
Hung CP, Kreiman G, Poggio T, and DiCarlo JJ. Fast readout of object identity from macaque 622
inferior temporal cortex. Science 310: 863-866, 2005. 623
Kaas JH, and Hackett TA. Subdivisions of auditory cortex and levels of processing in primates. 624
Audiol Neurootol 3: 73-85, 1998. 625
Kanold PO, Nelken I, and Polley DB. Local versus global scales of organization in auditory cortex. 626
Trends Neurosci 37: 502-510, 2014. 627
Kikuchi Y, Horwitz B, and Mishkin M. Hierarchical auditory processing directed rostrally along the 628
monkey's supratemporal plane. J Neurosci 30: 13021-13030, 2010. 629
Kimura A, Donishi T, Sakoda T, Hazama M, and Tamai Y. Auditory thalamic nuclei projections to 630
the temporal cortex in the rat. Neuroscience 117: 1003-1016, 2003. 631
Knutson B, Burgdorf J, and Panksepp J. Anticipation of play elicits high-frequency ultrasonic 632
vocalizations in young rats. J Comp Psychol 112: 65-73, 1998. 633
Knutson B, Burgdorf J, and Panksepp J. Ultrasonic vocalizations as indices of affective states in 634
rats. Psychol Bull 128: 961-977, 2002. 635
Kusmierek P, and Rauschecker JP. Functional specialization of medial auditory belt cortex in the 636
alert rhesus monkey. J Neurophysiol 102: 1606-1622, 2009. 637
Kvale M, and Schreiner C. Short-term adaptation of auditory receptive fields to dynamic stimuli. J 638
Neurophysiol 91: 604-612, 2004. 639
Lakatos P, Pincze Z, Fu KM, Javitt DC, Karmos G, and Schroeder CE. Timing of pure tone and 640
noise-evoked responses in macaque auditory cortex. Neuroreport 16: 933-937, 2005. 641
LeDoux JE, Farb CR, and Romanski LM. Overlapping projections to the amygdala and striatum 642
from auditory processing areas of the thalamus and cortex. Neurosci Lett 134: 139-144, 1991. 643
Liu RC, Linden JF, and Schreiner CE. Improved cortical entrainment to infant communication calls 644
Liu RC, and Schreiner CE. Auditory cortical detection and discrimination correlates with 646
communicative significance. PLoS Biol 5: e173, 2007. 647
Marlin BJ, Mitre M, D'Amour J A, Chao MV, and Froemke RC. Oxytocin enables maternal 648
behaviour by balancing cortical inhibition. Nature 520: 499-504, 2015. 649
McIntosh TK, Barfield RJ, and Geyer LA. Ultrasonic vocalisations facilitate sexual behaviour of 650
female rats. Nature 272: 163-164, 1978. 651
Medvedev AV, and Kanwal JS. Local field potentials and spiking activity in the primary auditory 652
cortex in response to social calls. J Neurophysiol 92: 52-65, 2004. 653
Otazu GH, Tai LH, Yang Y, and Zador AM. Engaging in an auditory task suppresses responses in 654
auditory cortex. Nat Neurosci 12: 646-654, 2009. 655
Parrott RF. Effect of castration on sexual arousal in the rat, determined from records of post-656
ejaculatory ultrasonic vocalizations. Physiol Behav 16: 689-692, 1976. 657
Paxinos G, and Watson C. The rat brain in stereotactic coordinates. Sydney: Academic, 1986. 658
Pedregosa F, Varoquaux G, Gramfort A, Michel V, Thirion B, Grisel O, Blondel M, Prettenhofer 659
P, Weiss R, Dubourg V, Vanderplas J, Passos A, Cournapeau D, Brucher M, Perrot M, and 660
Duchesnay E. Scikit-learn: Machine Learning in Python. J Mach Learn Res 12: 2825-2830, 2011. 661
Pelleg-Toiba R, and Wollberg Z. Discrimination of communication calls in the squirrel monkey: "call 662
detectors" or "cell ensembles"? J Basic Clin Physiol Pharmacol 2: 257-272, 1991. 663
Petkov CI, Kayser C, Augath M, and Logothetis NK. Functional imaging reveals numerous fields in 664
the monkey auditory cortex. PLoS Biol 4: e215, 2006. 665
Polley DB, Read HL, Storace DA, and Merzenich MM. Multiparametric auditory receptive field 666
organization across five cortical fields in the albino rat. J Neurophysiol 97: 3621-3638, 2007. 667
Portfors CV. Types and functions of ultrasonic vocalizations in laboratory rats and mice. J Am Assoc 668
Lab Anim Sci 46: 28-34, 2007. 669
Profant O, Burianova J, and Syka J. The response properties of neurons in different fields of the 670
auditory cortex in the rat. Hear Res 296: 51-59, 2013. 671
Rabinowitz NC, Willmore BD, King AJ, and Schnupp JW. Constructing noise-invariant 672
representations of sound in the auditory pathway. PLoS Biol 11: e1001710, 2013. 673
Rabinowitz NC, Willmore BD, Schnupp JW, and King AJ. Contrast gain control in auditory cortex. 674
Neuron 70: 1178-1191, 2011. 675
Rauschecker JP, and Tian B. Processing of band-passed noise in the lateral auditory belt cortex of 676
the rhesus monkey. J Neurophysiol 91: 2578-2589, 2004. 677
Rauschecker JP, Tian B, and Hauser M. Processing of complex sounds in the macaque nonprimary 678
auditory cortex. Science 268: 111-114, 1995. 679
Recanzone GH, and Cohen YE. Serial and parallel processing in the primate auditory cortex 680
revisited. Behavioural brain research 206: 1-7, 2010. 681
Roger M, and Arnault P. Anatomical study of the connections of the primary auditory area in the rat. 682
J Comp Neurol 287: 339-356, 1989.
683
Romanski LM, and LeDoux JE. Information cascade from primary auditory cortex to the amygdala: 684
corticocortical and corticoamygdaloid projections of temporal cortex in the rat. Cereb Cortex 3: 515-685
532, 1993a. 686
Romanski LM, and LeDoux JE. Organization of rodent auditory cortex: anterograde transport of 687
PHA-L from MGv to temporal neocortex. Cereb Cortex 3: 499-514, 1993b. 688
Rust NC, and DiCarlo JJ. Balanced increases in selectivity and tolerance produce constant 689
sparseness along the ventral visual stream. J Neurosci 32: 10170-10182, 2012. 690
Rust NC, and Dicarlo JJ. Selectivity and tolerance ("invariance") both increase as visual information 691
propagates from cortical area V4 to IT. J Neurosci 30: 12978-12995, 2010. 692
Rutkowski RG, Miasnikov AA, and Weinberger NM. Characterisation of multiple physiological fields 693
within the anatomical core of rat auditory cortex. Hear Res 181: 116-130, 2003. 694
Sales GD. Ultrasound and Mating Behavior in Rodents with Some Observations on Other Behavioral 695
Situations. Journal of Zoology 68: 149-164, 1972. 696
Schneider DM, and Woolley SM. Discrimination of communication vocalizations by single neurons 699
and groups of neurons in the auditory midbrain. J Neurophysiol 103: 3248-3265, 2010. 700
Schnupp JW, Hall TM, Kokelaar RF, and Ahmed B. Plasticity of temporal pattern codes for 701
vocalization stimuli in primary auditory cortex. J Neurosci 26: 4785-4795, 2006. 702
Sewell GD. Ultrasonic communication in rodents. Nature 227: 410, 1970. 703
Sharpee T, Atencio C, and Schreiner C. Hierarchical representations in the auditory cortex. Curr 704
Opin Neurobiol 2011. 705
Sirotin YB, Costa ME, and Laplagne DA. Rodent ultrasonic vocalizations are bound to active 706
sniffing behavior. Front Behav Neurosci 8: 399, 2014. 707
Storace DA, Higgins NC, and Read HL. Thalamic label patterns suggest primary and ventral 708
auditory fields are distinct core regions. J Comp Neurol 518: 1630-1646, 2010. 709
Takahashi N, Kashino M, and Hironaka N. Structure of rat ultrasonic vocalizations and its relevance 710
to behavior. PLoS One 5: e14115, 2010. 711
Ulanovsky N, Las L, Farkas D, and Nelken I. Multiple time scales of adaptation in auditory cortex 712
neurons. J Neurosci 24: 10440-10453, 2004. 713
Vapnik V. The Nature of Statistical Learning. Springer Verlag, 2000. 714
Wallace MN, Shackleton TM, Anderson LA, and Palmer AR. Representation of the purr call in the 715
guinea pig primary auditory cortex. Hear Res 204: 115-126, 2005. 716
Wang X, Merzenich MM, Beitel R, and Schreiner CE. Representation of a species-specific 717
vocalization in the primary auditory cortex of the common marmoset: temporal and spectral 718
characteristics. J Neurophysiol 74: 2685-2706, 1995. 719
Winer JA, Kelly JB, and Larue DT. Neural architecture of the rat medial geniculate body. Hear Res 720
130: 19-41, 1999. 721
Winer JA, and Schreiner CE. The auditory cortex. New York: Springer, 2010. 722
Wohr M, Houx B, Schwarting RK, and Spruijt B. Effects of experience and context on 50-kHz 723
vocalizations in rats. Physiol Behav 93: 766-776, 2008. 724
Woolley S, Fremouw T, Hsu A, and Theunissen F. Tuning for spectro-temporal modulations as a 725
mechanism for auditory discrimination of natural sounds. Nat Neurosci 8: 1371-1379, 2005. 726
Wright JM, Gourdon JC, and Clarke PB. Identification of multiple call categories within the rich 727
repertoire of adult rat 50-kHz ultrasonic vocalizations: effects of amphetamine and social context. 728
Psychopharmacology 211: 1-13, 2010. 729
730 731
Figure Legends 733
734
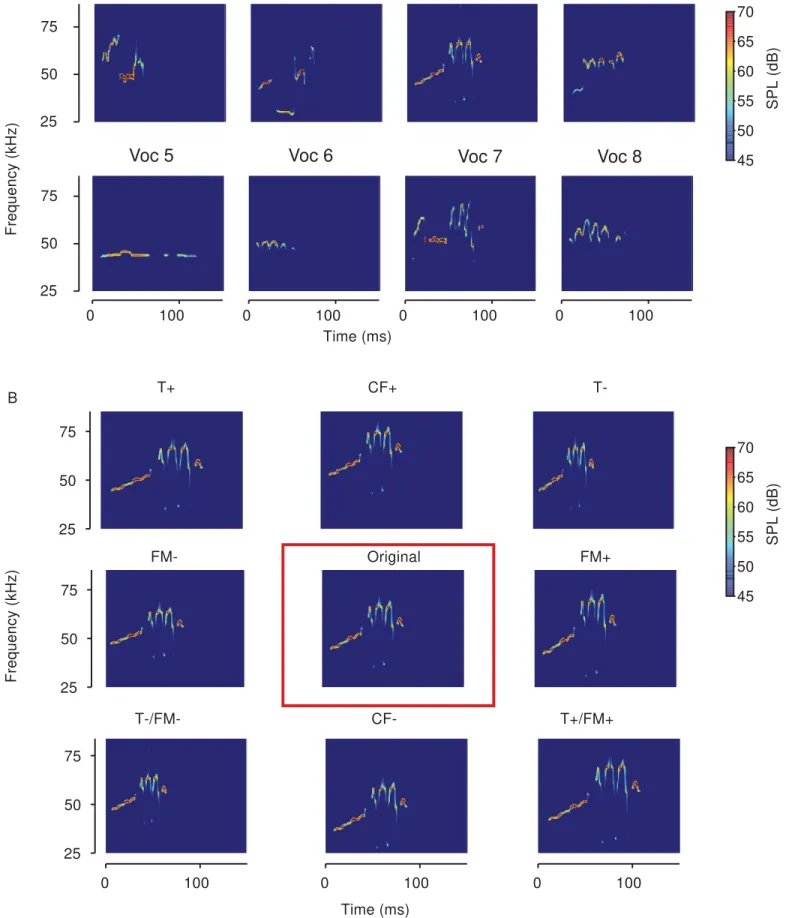
Figure 1: Spectrograms of vocalizations and transformations used as acoustic stimuli in the 735
experiments. A) The eight different original vocalizations selected from recordings, after de-736
noising. B) One original vocalization (center), as well as the 8 different transformations of that 737
vocalization presented in the experiment. From top left to bottom right: T+: temporally 738
stretched by factor of 1.25; CF+: center frequency shifted up to 7.9 kHz; T-: temporally 739
compressed by factor of 0.75; FM-: frequency modulation scaled by a factor of 0.75; Original: 740
denoised original vocalization; FM+: frequency modulation scaled by a factor of 1.25; T-/FM-: 741
temporally compressed and frequency modulation scaled by a factor of 0.75; CF-: center 742
frequency shifted down by 7.9 kHz; T+/FM+: temporally stretched and frequency modulation 743
scaled by a factor of 1.25. 744
745
Figure 2: Statistical characterization of vocalizations. A. Spectro-temporal modulation 746
spectrum for the 8 vocalizations. B. Distribution of center frequency and bandwidth for all 747
recorded vocalizations. 8 vocalizations used in the study are indicated by red dots with 748
corresponding numbers. 749
750
Figure 3: Peri-stimulus-time raster plots (above) and histograms (below) of an exemplar A1 751
unit showing selective responses to vocalization stimuli. Each column corresponds to one 752
original vocalization, and every two rows to one transformation of that vocalization. 753
Histograms were first computed for 1ms time-bins, and then smoothed with 11-ms hanning 754
window. 755
Figure 4: Peri-stimulus-time raster plots (above) and histograms (below) of an exemplar 757
SRAF unit showing selective responses to vocalization stimuli. Each column corresponds to 758
one original vocalization, and every two rows to one transformation of that vocalization. 759
Histograms were first computed for 1ms time-bins, and then smoothed with 11-ms hanning 760
window. 761
762
Figure 5: Ensembles of A1 and SRAF units under study are similar in responses and overall 763
classification performance. A) Cumulative distributions for average firing rate of units during 764
stimulus presentation. Distribution of SRAF units shown in red, A1 units shown in faint blue, 765
and the subset of A1 units matched to the SRAF units shown in blue. Inset: Distribution of 766
information rates for all recorded units that passed the minimum firing rate criterion. The 767
threshold for information rate (0.78 bits/s) in response to vocalizations under at least one 768
transformation is marked by a vertical black line. B) Box-plot showing the distribution of 769
frequency tunings of the units selected from A1 and from SRAF. The boxes show the extent 770
of the central 50% of the data, with the horizontal bar showing the median frequency. C) 771
Histogram of the information contained in the spike counts of units from A1 and SRAF about 772
each vocalization. Dashed lines mark the mean values. D) Histogram of sparseness (with 773
respect to vocalization identity) of responses of units from A1 and SRAF. Dashed lines mark 774
the mean values. E) Classification accuracy of SVM classifier distinguishing between two 775
vocalizations (pairwise mode). Faded colors show performance for the pair of vocalizations 776
with the highest performance for each brain area, and saturated colors show average 777
performance across pairs. F) Classification accuracy of SVM classifier distinguishing between 778
all vocalizations (8-way mode). Faded colors show performance for the vocalization with the 779
highest performance for each brain area, and saturated colors show average performance 780