RESEARCH ARTICLE
In-Silico
Analysis of Inflammatory Bowel
Disease (IBD) GWAS Loci to Novel
Connections
Md. Mesbah-Uddin1*, Ramu Elango2, Babajan Banaganapalli2, Noor Ahmad Shaik2,3, Fahad A. Al-Abbasi1*
1Department of Biochemistry, Faculty of Science, King Abdulaziz University, Jeddah, Saudi Arabia, 2Princess Al-Jawhara Al-Brahim Center of Excellence in Research of Hereditary Disorders, King Abdulaziz University, Jeddah, Saudi Arabia,3Department of Genetic Medicine, Faculty of Medicine, King Abdulaziz University, Jeddah, Saudi Arabia
*[email protected](MMU); [email protected](FAA)
Abstract
Genome-wide association studies (GWASs) for many complex diseases, including inflam-matory bowel disease (IBD), produced hundreds of disease-associated loci—the majority of which are noncoding. The number of GWAS loci is increasing very rapidly, but the pro-cess of translating single nucleotide polymorphisms (SNPs) from these loci to genomic medicine is lagging. In this study, we investigated 4,734 variants from 152 IBD associated GWAS loci (IBD associated 152 lead noncoding SNPs identified from pooled GWAS results + 4,582 variants in strong linkage-disequilibrium (LD) (r20.8) for EUR population of 1K Ge-nomes Project) using four publicly available bioinformatics tools, e.g. dbPSHP, CADD, GWAVA, and RegulomeDB, to annotate and prioritize putative regulatory variants. Of the 152 lead noncoding SNPs, around 11% are under strong negative selection (GERP++ RS 2); and ~30% are under balancing selection (Tajima’s D score>2) in CEU population (1K
Genomes Project)—though these regions are positively selected (GERP++ RS<0) in
mammalian evolution. The analysis of 4,734 variants using three integrative annotation tools produced 929 putative functional SNPs, of which 18 SNPs (from 15 GWAS loci) are in concordance with all three classifiers. These prioritized noncoding SNPs may contribute to IBD pathogenesis by dysregulating the expression of nearby genes. This study showed the usefulness of integrative annotation for prioritizing fewer functional variants from a large number of GWAS markers.
Introduction
Inflammatory bowel disease (IBD), mainly classified as Crohn’s disease (CD) and Ulcerative colitis (UC), is one of the major immune-mediated inflammatory conditions of the alimentary
tract, which affected around 2.5 million European [1], 1.8 million adult Americans [2], with
in-creasing prevalence in Asia and other developing countries where people are embracing
a11111
OPEN ACCESS
Citation:Mesbah-Uddin M, Elango R, Banaganapalli B, Shaik NA, Al-Abbasi FA (2015)In-SilicoAnalysis of Inflammatory Bowel Disease (IBD) GWAS Loci to Novel Connections. PLoS ONE 10(3): e0119420. doi:10.1371/journal.pone.0119420
Academic Editor:Mathias Chamaillard, INSERM, FRANCE
Received:July 21, 2014
Accepted:January 13, 2015
Published:March 18, 2015
Copyright:© 2015 Mesbah-Uddin et al. This is an open access article distributed under the terms of the
Creative Commons Attribution License, which permits unrestricted use, distribution, and reproduction in any medium, provided the original author and source are credited.
Data Availability Statement:All relevant data are within the paper and its Supporting Information files.
Funding:The authors have no support or funding to report.
Westernized lifestyle and food habit [3–5]. The incidence is also increasing in children around
the world due to prenatal and postnatal exposures to various risk factors [6]. The pathogenesis
of IBD is largely attributed to environmental, immunologic and genetic factors [7,8], where
host genome and mucosal immune cells interact with gut microbiota along with other
environ-mental stimuli [9,10]. However, it is difficult to follow a unified regime for treating IBD owing
to the inherent disease heterogeneity [11,12], which demands patient stratification based on
risk factors and development of tailored medicine [12]. Though the treatment of inflammatory
diseases witnessed a rapid advancement in the last decade and immunotherapy showed success
in ameliorating inflammatory conditions, efficacy is still an issue for treating IBD patients [12].
Besides, the cost related to anti-TNFαtherapy [13], polypharmacy (mainly analgesic and
psy-chiatric drugs) among IBD patients [14], and productivity losses due to work disability [15],
are worsening the situation as well as increasing economic burden.
The research of human genetics and personalized medicine has advanced remarkably in the advent of high throughput genomic techniques. Over the last decade, hundreds of trait associ-ated variants were identified through genome-wide association studies (GWASs) in diverse populations, which reinforced our understanding of complex traits including height, weight, diabetes, cancer, and immune-mediated diseases, such as rheumatoid arthritis (RA), and
multi-ple sclerosis (MS) [16–18]. More notably, GWAS proved to be very successful in identifying
IBD susceptibility loci and related pathways. The recent meta-analysis of GWAS findings and subsequent extensive validation of the signals in European population have brought the IBD
associated risk loci to 163—highest for any single disease [1]. However, very few of these
GWASs variants contributed in translational medicine for early diagnosis and treatment [19].
This could be due to the challenge of assigning relevant biological information to associated
noncoding regions (around 90% of GWAS variants) [20] and pinpointing causal variants from
the GWAS loci [21,22]. Though individual risk locus accounts for modest effect in complex
diseases [17], the need for exploring molecular mechanisms through the identification of
func-tional variants from the GWAS signals is immense [23]. However, putative functional variants
could be distinguished from the GWAS loci through integrative annotation and prioritization
of the variants [24,25]. In this study, we analyzed IBD associated lead noncoding
single-nucleotide polymorphisms (SNPs) from a meta-analysis of 15 GWASs on European
popula-tion [1], along with variants in strong linkage-disequilibrium (LD) (r20.8) with the lead
SNPs, using publicly available functional annotation tools, to prioritize regulatory variants from the GWAS loci and deduce probable biological link to IBD pathogenesis.
Methods
Dataset
IBD associated 163 lead single-nucleotide polymorphisms (SNPs) from Jostins et al. [1] report
were considered as the core dataset in this study and relevant information were extracted from
NHGRI GWAS Catalog[16]. Among the 163 lead SNPs, 152 SNPs (~93%) are in noncoding
re-gions and 11 SNPs (~7%) are in coding rere-gions of the genome. Of the eleven coding SNPs, 7 are nonsynonymous SNPs (nsSNPs), 3 synonymous SNPs and one frameshift mutation on
NOD2gene. However, in this study we only focused on the 152 lead noncoding SNPs and
vari-ants in strong linkage disequilibrium (LD) (r20.8) with these SNPs to identify regulatory
var-iants from the studied 152 GWAS loci. Reference SNP cluster IDs (rsIDs) andr2values for LD
variants were extracted from HaploReg v2 [26] web server (http://www.broadinstitute.org/
e.g. single-nucleotide polymorphisms (SNPs), insertions and deletions (indels). To reduce am-biguity, the term SNP and variant was used interchangeably throughout the article.
Selective Constraints
We analyzed 152 lead noncoding SNPs to identify regions under selective constraints, using evolutionary conservation statistic, e.g. position-specific neutral rate (NR) and rejected
substi-tution (RS) scores (RS = Neutral rate (NR)—Observed substitution) from Genomic
Evolution-ary Rate Profiling (GERP++) [27,28], and population specific statistics, e.g. Tajima’s D (TD)
score [29], derived allele frequency (DAF) and difference of derived allele frequency (ΔDAF)
between queried population and all other populations. GERP++ RS and NR, TD, DAF and
ΔDAF scores were retrieved from the webserver of dbPSHP [30] (http://jjwanglab.org/dbpshp,
last accessed February 20, 2014) using default settings. The CEU population (Utah Residents with Northern and Western European ancestry) of 1KGP is the queried population for TD,
DAF andΔDAF.
Annotation Tools
IBD associated lead noncoding SNPs and variants in strong LD with lead SNPs were analyzed using three publicly available annotation tools, e.g. Combined Annotation-Dependent
Deple-tion (CADD) [24], Genome Wide Annotation of Variants (GWAVA) [25] and RegulomeDB
[31].
CADD. Combined Annotation-Dependent Depletion (CADD) is a support vector ma-chine trained online prediction tool for prioritizing functional, deleterious and pathogenic
vari-ants from diverse categories of varivari-ants [24]. For each query variant, CADD provides a
combined annotation score (C-score) from its comprehensive database of pre-computed C-scores for 8.6 billion possible human SNPs. According to CADD classification, top 10%
probable functional variants will have a C-score of 10 or greater (C10), top 1% variants will
have a C-score of 20 or greater (C20) and finally most deleterious top 0.1% human variants
will have a C-score of 30 or greater (C30). For our study we extracted CADD scores for lead
and LD variants from the webserver (http://cadd.gs.washington.edu, last accessed March 12,
2014) using prescribed variant call format (VCF).
GWAVA. Genome Wide Annotation of Variants (GWAVA) is a random forest trained online tool for predicting the functional impact of noncoding variants based on integration of
different genomic and epigenomic annotations [25]. For each SNP, GWAVA provides three
scores by three different versions of the classifier e.g. Region score, TSS score (based on nearest transcription start site) and Unmatched score; and the score ranges from zero to one—where higher scores indicate variants more likely to be functional. However, here we only considered TSS score as our GWAVA score, because it incorporates various regulatory annotations and is less dominated by any single annotation. We retrieved pre-computed GWAVA scores and an-notations for the IBD associated noncoding SNPs and LD variants from the webserver (http://www.sanger.ac.uk/sanger/StatGen_Gwava, last accessed March 12, 2014) for further analysis.
RegulomeDB. RegulomeDB is an online database and prediction tool to annotate and
pri-oritize potential regulatory variants from human genome [31]. The database includes
high-quality datasets from Encyclopedia of DNA Elements (ENCODE) [32] and other sources, as
well as predicted and manually curated annotations to identify putative regulatory variants. RegulomeDB classifies variants into six main categories (from Category 1 to Category 6),
where Category 1 variants are“likely to affect binding and linked to expression of a gene
tar-get”, Category 2 variants are“likely to affect binding”, Category 3 variants are“less likely to
affect binding”, and Category 4, 5 & 6 variants have“minimal binding evidence”[31]. Regulo-meDB also assigns a score of 7 for variants with no annotation data available. However, we downloaded RegulomeDB annotations for lead noncoding SNPs and strong LD variants from
the webserver (http://regulome.stanford.edu, last accessed May 19, 2014).
Data Analysis, Visualization and Inference
For producing scatterplots, histograms, boxplots, bar graph and Venn diagram,Rcore package
(version 3.0.3) [33] along with otherRpackages e.g.ggplot2[34] andVennDiagram[35] were
used. The gene-interaction network is drawn providing all the genes nearby the prioritized
SNPs to the GeneMANIA [36] webserver (http://www.genemania.org), and highly connected
gene clusters were identified and visualized using Cytoscape 2.8.2 [37] and its plugin MCODE
v1.32 [38].Ensembl Variant Effect Predictor (VEP)[39] is used for obtaining the genes nearby
the prioritized SNPs.
Two-sided Wilcoxon rank sum test (usingRfunctionwilcox.test) is conducted to show
whether there is a significant difference in the distribution of annotation scores, from CADD and GWAVA tools, between IBD associated lead noncoding GWAS SNPs and variants in strong LD with the lead SNPs.
We calculated fold-enrichment for genes in a disease of interest as((m/n)/(M/N)), wherem
is the number of prioritized genes (using a tool or a combination of tools) belongs to the disease
of interest,nis the total number of genes prioritized using a tool (or combination of tools),
Mis the total number of genes belong to the disease of interest, andNis the human genome
background (30,000 genes). We applied Fisher’s exact test (usingRfunctionfisher.test) to
esti-mate the statistical significance of each enrichment score. For this analysis, we considered ge-nome-wide association studies (GWASs) of six immune-mediated diseases (IMDs) and
retrieved the reported genes (HGNC [40] approved gene symbols, downloaded fromwww.
genenames.org, on May 8, 2014) from these studies—ankylosing spondylitis (AS) [16,41],
celi-ac disease (CeD) [16], inflammatory bowel disease (IBD) [1], psoriasis (Ps) [16,42,43],
rheu-matoid arthritis (RA) [16], and type 1 diabetes (T1D) [16]. GWASs related data were obtained
from theNHGRI GWAS Catalog(unless otherwise referred) (http://www.genome.gov/
gwastudies) [16] on September 26, 2014; andVEPis used to obtain genes nearby the prioritized SNPs (only HGNC approved gene symbols were counted for the test). We also estimated the
enrichment scores andp-valuescombining all the genes (after removing the duplicates) from
four reference IMDs (IMD4: AS+CeD+Ps+T1D), as well as five reference diseases (IMD5: AS
+CeD+Ps+RA+T1D).
And finally, the strength of correlation between the top 18 prioritized SNPs and lead SNPs
from six IMDs e.g. AS [16,41], CeD [16], IBD [1], Ps [16,42,43], RA [16] and T1D [16] were
checked for European population of the 1K Genomes Project. We retrieved all the lead SNPs
for the six IMDs fromNHGRI GWAS catalog(and literatures), and searched in HaploReg v2
webserver [26] to identify the corresponding (strong) LD variants. We then manually screened
the LD variant lists, for each reference disease, to identify the overlap with the top 18 priori-tized SNPs.
Results
Selective constraints on IBD loci
Of the 152 IBD associated lead noncoding variants, 65 SNPs have positive GERP++ RS scores
(RS0, i.e. substitution deficit) and 16 of these have very high RS scores (RS2). In addition,
87 SNPs have negative RS scores (RS<0, i.e. substitution surplus)—among which 40 SNPs
neutral rate (NR) reveals 19 SNPs with no observed substitution (RS/NR = 1) in mammalian
evolution (S1 Table) which could represent evolutionarily highly conserved positions.
We retrieved TD, DAF andΔDAF scores from dbPSHP webserver for 148 SNPs (after
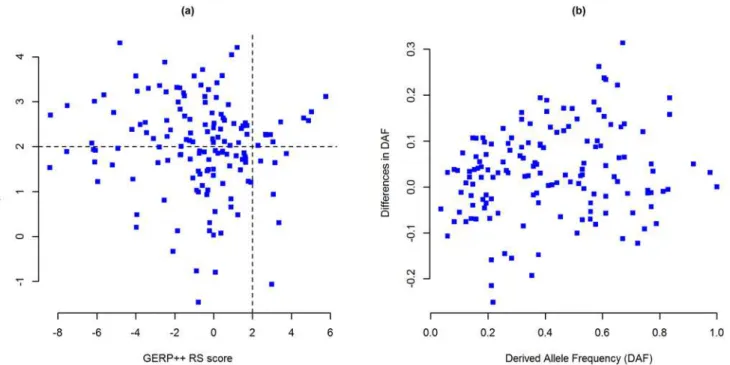
re-moving 4 missing SNPs) and found that—in CEU population (1KGP), 143 IBD associated SNPs have positive TD scores and 5 SNPs have negative scores, where 77 of these SNPs have
TD scores greater than 2 (TD>2) (Fig. 1aandS1 Table). Cross population diversity was
pre-sented in terms of derived allele frequencies (DAF) and differences in DAF (ΔDAF)—which
showed that there are eight SNPs with a derived allele frequency greater than 0.8 (DAF0.8)
and 94 SNPs with higher derived allele frequency (ΔDAF>0) in CEU population than the rest
of the world (Fig. 1bandS1 Table).
Integrative Annotation of Lead and LD variants
We started our analysis with 152 lead noncoding SNPs and then extended to the surrounding
variants in strong linkage-disequilibrium (LD) (r20.8) with the lead SNP. Using these criteria
we found 4,582 strong LD variants for 143 lead SNPs in CEU population of 1KGP, whereas the
remaining 9 lead SNPs are the only variants in the respective locus (S2 Table). The LD variants
are composed of 4,308 single-nucleotide polymorphisms (SNPs), 203 deletions and 71 inser-tion mutainser-tion (total 4,582 LD variants). The inserinser-tions and deleinser-tions (indels) are mostly single nucleotide, though there are variants with 22-nucleotide deletion and 13-nucleotide insertion. However, we had CADD scores for all the variants, and RegulomeDB scores for the majority of the SNPs and few indels, but from GWAVA we only had scores for SNPs (no GWAVA score Fig 1. Selective constraints on IBD associated lead noncoding SNPs.(a) Evolutionary conservation versus human specific selection on lead SNPs. Evolutionary conservation is presented by GERP++ RS scores (x axis) and human specific selection is presented by Tajima’s D scores (y axis). Each point represents a single SNP; n = 148 SNPs. Positive GERP++ and TD scores indicate regions under negative selection and negative scores indicate positive selection. SNPs in the top-right segment are under strong evolutionary constraint as well as human specific selection. (b) Cross-population diversity of lead SNPs between CEU population and rest of the world. DAF is presented in thex axisandΔDAF is presented iny axis. Each point represents a single SNP; n = 148 SNPs.GERP++ RS: Genomic Evolutionary Rate Profiling rejected substitution;TD: Tajima’s D;DAF: Derived allele frequency;ΔDAF: Difference in derived allele frequency;CEU: Utah residents with ancestry from Northern and Western Europe. TD, DAF andΔDAF statistics are for 1K Genomes Project’s CEU population.
doi:10.1371/journal.pone.0119420.g001
for indels). The functional annotation scores for 4,734 variants (152 lead + 4,582 LD variants) from the three classifiers e.g. CADD, GWAVA and RegulomeDB are discussed below.
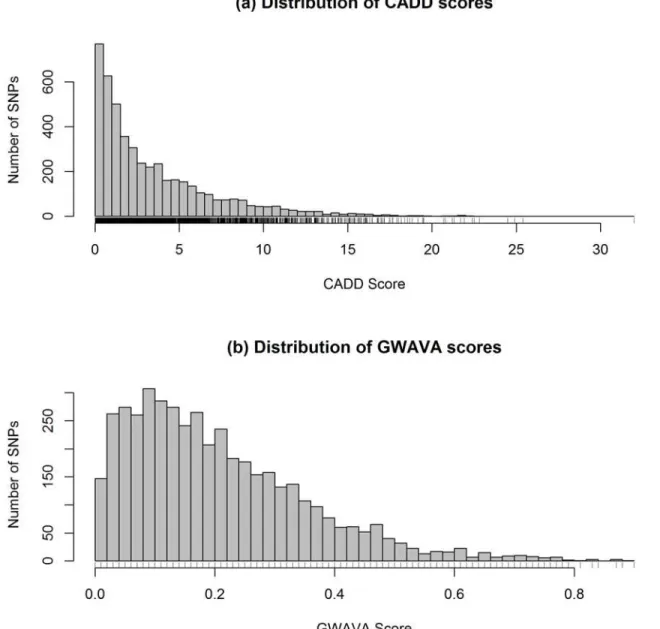
Combined Annotation-Dependent Depletion (CADD). From CADD we have 4,781 C scores for 4,734 variants—few more C-scores than the number of rsIDs, because CADD pro-vides C-score for each substitution and some of the rsID represent more than one substitution (S2 Table). The distribution of CADD scores is presented in the histogram (Fig. 2a). Here CADD score ranges from 0 to 32 with a mean of 3.5 and median of 2.2. From the total of 4,734
variants, 323 have CADD scores greater than 10 (>C10), of which 14 variants have C-score
greater than 20 (>C20), and only one variant scores greater than 30 (>C30). Overall top five
variants, which are also top LD variants, are rs601338, rs74869386, rs34622044, rs2298428 and rs10891692 with a CADD score of 32, 25.4, 24.9, 24.5 and 22.8, respectively. The top ranked
variant rs601338 (C-score of 32) is a stop gained mutant ofFUT2gene which is in strong LD
(r2= 1) with lead SNP rs516246. However, the top five lead GWAS SNPs, e.g. rs4256159,
rs17229285, rs4246905, rs7608910 and rs3851228, had a C-score of 21.7, 19.91, 15.83, 15.62 and 15.49, respectively. Interestingly, 21 SNPs from 152 lead noncoding SNPs (~14%) had a C-score of 10 or higher against 302 SNPs from 4627 LD variants (~7%). Which indicates differ-ences in the distribution of C-scores between lead GWAS SNPs and LD variants—where lead
SNPs had higher annotation scores than variants in strong LD with the lead variants (P-value=
2.3 × 10⁻⁴, two-sided Wilcoxon rank sum test) (Fig. 3a).
Genome Wide Annotation of Variants (GWAVA). Of the 4,734 variants analyzed, GWAVA returned scores for 4,460 variants (i.e. 274 variants missing) in the range of 0.0 to 0.9 —with a mean of 0.21 and median of 0.18. The distribution of GWAVA scores for 4,460
vari-ants (152 lead GWAS SNPs and 4,308 LD varivari-ants) is presented inFig. 2band detailed scores
are presented inS2 Table. Here, 509 SNPs have a GWAVA score of 0.4 or greater (0.4)—
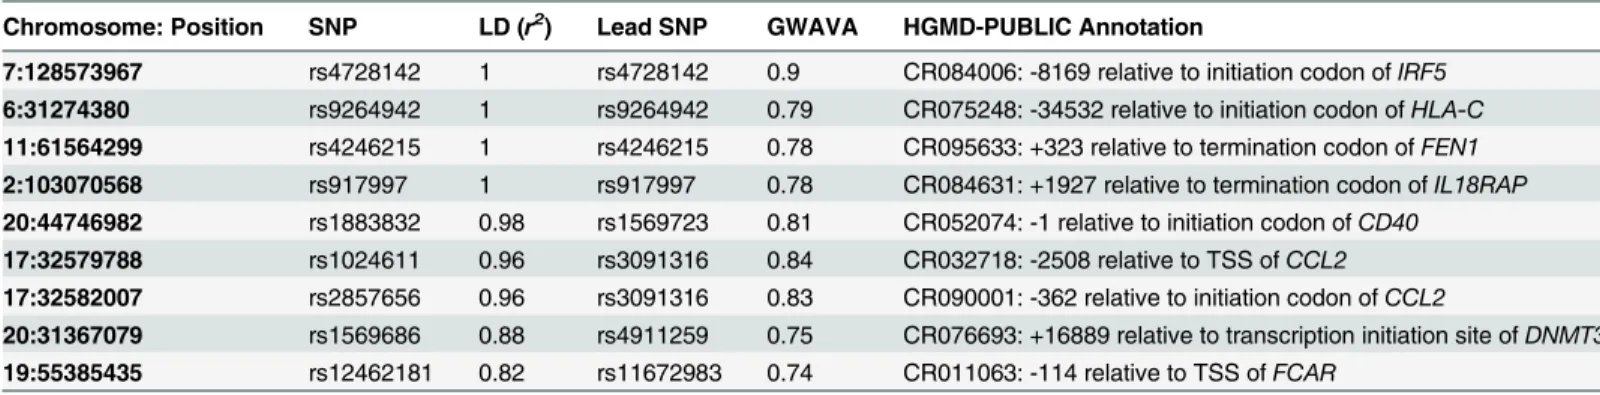
among which 45 SNPs have a score0.7. Overall, the top five SNPs are rs4728142, rs1698374,
rs7559479, rs7603250 and rs1024611, with a GWAVA score of 0.9, 0.88, 0.87, 0.87 and 0.84, re-spectively. On the other hand, top five lead SNPs are rs4728142, rs9264942, rs4246215, rs917997 and rs1126510, with a GWAVA score of 0.9, 0.79, 0.78, 0.78 and 0.75, respectively.
Interestingly, the first four lead GWAS SNPs are also found to have HGMD-Public [44]
regula-tory variant annotations, against only two of the top five LD variants (Table 1). However, we
also observed differences in the distribution of GWAVA scores (as seen in CADD scores)
be-tween lead GWAS SNPs and strong LD variants (Fig. 3b)—on average, lead GWAS SNPs have
higher annotation scores from GWAVA than the LD variants (P-value<2.2 × 10⁻¹⁶, two-sided
Wilcoxon rank sum test).
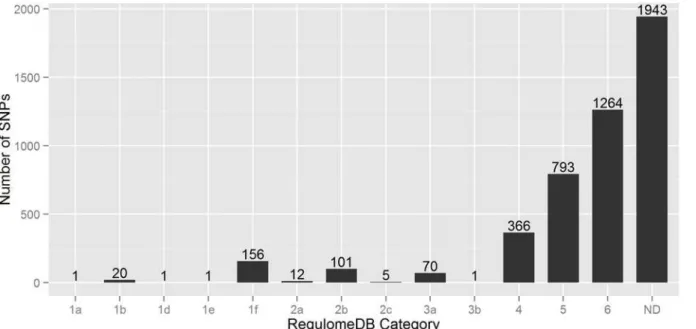
RegulomeDB. In this scoring scheme, 4,734 SNPs are divided into six broad categories (Category 1 to Category 6)—where 2,791 SNPs had annotation scores in between 1 to 6, and
the remaining 1,943 SNPs had no annotation data (Fig. 4). Of the 2,791 SNPs, 2,423 SNPs
(~87%) had minimum functional evidence (Category 4, 5 & 6), 71 SNPs (~3%) are less likely to be functional (Category 3), and 297 SNPs (~10%) are more likely to have regulatory functions (Category 1 & 2). Importantly, around 18% (27 SNPs) of the lead GWAS SNPs had
Regulo-meDB score of less than 3, while only ~6% (270 SNPs) LD variants are in this list (S2 Table).
However, it is surprising that from 297 putative regulatory SNPs only one SNP had
Regulo-meDB score of 1a. This top ranked SNP rs4788084 (in linkage-disequilibrium (r2= 0.82) with
Concordance Analysis
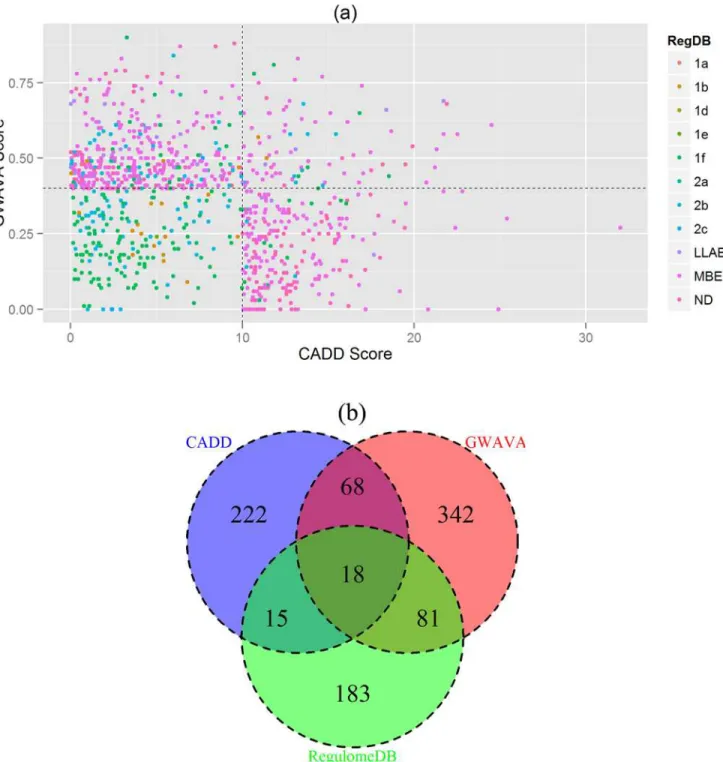
We investigated the consensus between the results from the three classifiers, e.g. CADD,
GWAVA and RegulomeDB. Here, we used a cutoff score for each classifier e.g. CADD10,
GWAVA0.4 and RegulomeDB2, to reduce false positive and to identify variants consistent
in all three annotation schemes. A total of 929 SNPs (after removing the overlap) is found to be
in agreement with any of the three classifiers’cutoff score, and is plotted in the scatterplot
(Fig. 5a), while the number of SNPs in concordance with different classifiers is depicted in the
Venn diagram (Fig. 5b). It shows that eighteen SNPs (18 SNPs) from 15 GWAS loci are in
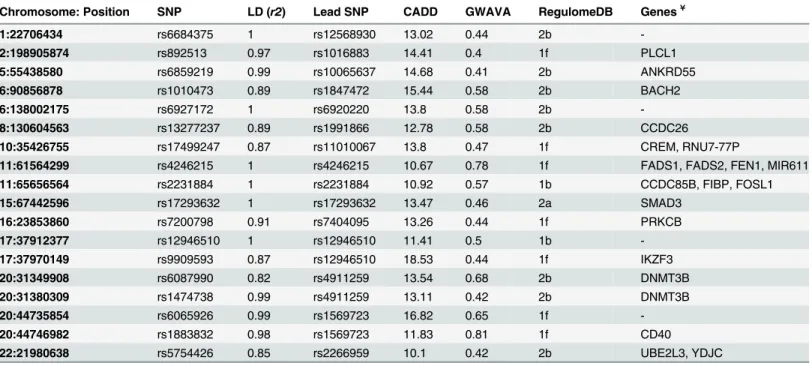
con-cordance with the results of CADD, GWAVA and RegulomeDB (Table 2). However, we
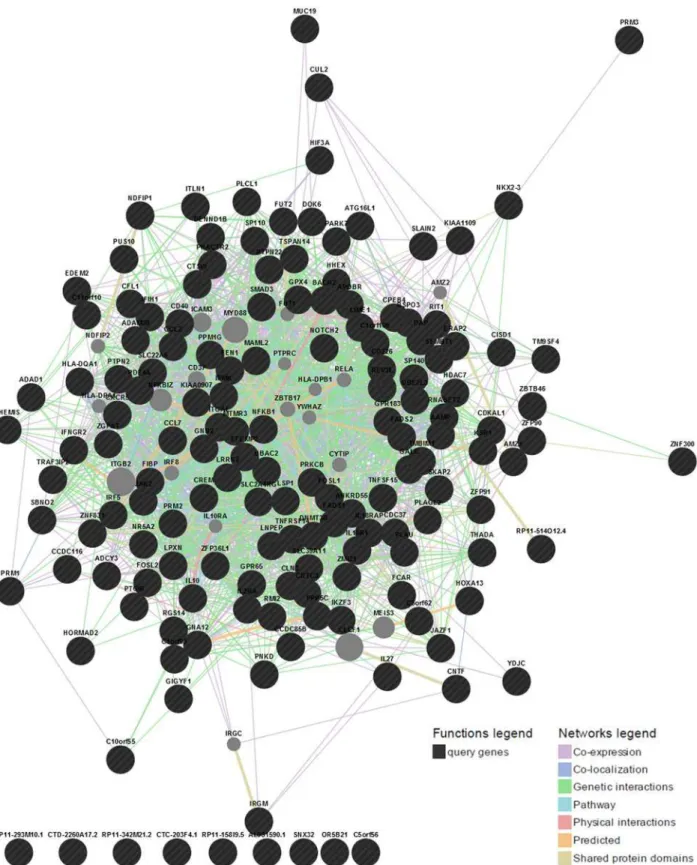
re-trieved gene names for all the top ranked SNPs (total 929) usingEnsembl Variant Effect
Predictor (VEP)and constructed a gene interaction network from GeneMANIA webserver.
Fig 2. Distribution of (a) CADD and (b) GWAVA scores.Histograms are drawn taking CADD and GWAVA scores of all the variants (lead GWAS SNPs and LD variants) after removing the missing values. Here n = 4781 for CADD and n = 4460 variants for GWAVA.
doi:10.1371/journal.pone.0119420.g002
Fig 3. Comparing functional annotation scores of IBD associated lead noncoding GWAS SNPs versus LD variants.(a) CADD scores for GWAS (n = 152) versus LD variants (n = 4627). (b) GWAVA scores for GWAS (n = 152) versus LD variants (n = 4308). In the boxplots, center lines show the medians of the values and box limits indicate the 25th & 75th percentiles (as determined by R software). Whiskers extend to 5th and 95th percentiles and outliers are represented by open circle dots. The notches are defined as±1.58 × IQR (interquartile range) / square root of n and represent the 95% confidence interval
for each median (default in R software).P-valuesare calculated using two-sided Wilcoxon rank sum test.
doi:10.1371/journal.pone.0119420.g003
Table 1. List of SNPs with high GWAVA scores and HGMD-PUBLIC regulatory annotation.
Chromosome: Position SNP LD (r2) Lead SNP GWAVA HGMD-PUBLIC Annotation
7:128573967 rs4728142 1 rs4728142 0.9 CR084006: -8169 relative to initiation codon ofIRF5
6:31274380 rs9264942 1 rs9264942 0.79 CR075248: -34532 relative to initiation codon ofHLA-C
11:61564299 rs4246215 1 rs4246215 0.78 CR095633: +323 relative to termination codon ofFEN1
2:103070568 rs917997 1 rs917997 0.78 CR084631: +1927 relative to termination codon ofIL18RAP
20:44746982 rs1883832 0.98 rs1569723 0.81 CR052074: -1 relative to initiation codon ofCD40
17:32579788 rs1024611 0.96 rs3091316 0.84 CR032718: -2508 relative to TSS ofCCL2
17:32582007 rs2857656 0.96 rs3091316 0.83 CR090001: -362 relative to initiation codon ofCCL2
20:31367079 rs1569686 0.88 rs4911259 0.75 CR076693: +16889 relative to transcription initiation site ofDNMT3B
19:55385435 rs12462181 0.82 rs11672983 0.74 CR011063: -114 relative to TSS ofFCAR
All the lead SNPs, as well as LD variants with GWAVA score0.7 were manually screened for Human Gene Mutation Database (HGMD) [44] regulatory annotation (HGMD release 2013.3) using Ensembl Genome Browser [45].TSS: Transcription start site.
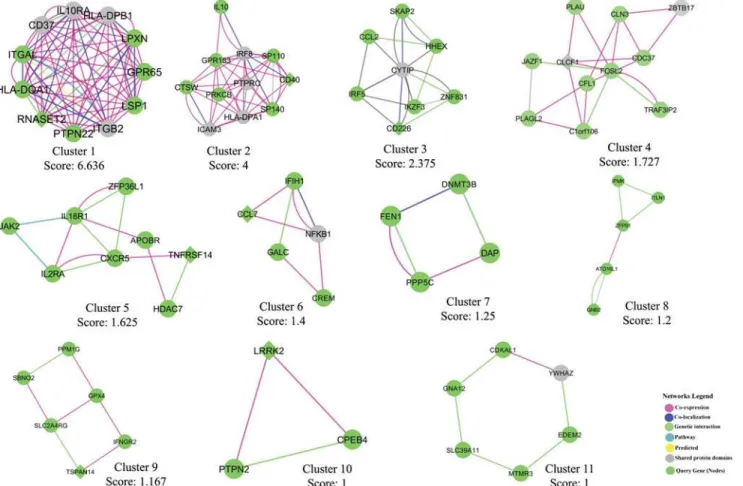
And finally we identified highly connected gene clusters from the network using MCODE
v1.32 (a Cytoscape 2.8.2 plugin). The gene interaction network is presented inFig. 6and top 11
MCODE gene clusters are shown inFig. 7.
Evaluation of the prioritization scheme
We evaluated the above mentioned prioritization scheme in terms of fold-enrichment and
strength of correlation (LD,r20.8) between the top 18 prioritized SNPs and lead GWAS
SNPs from AS, CeD, IBD, Ps, RA and T1D (seeMethods). The summary of the enrichment
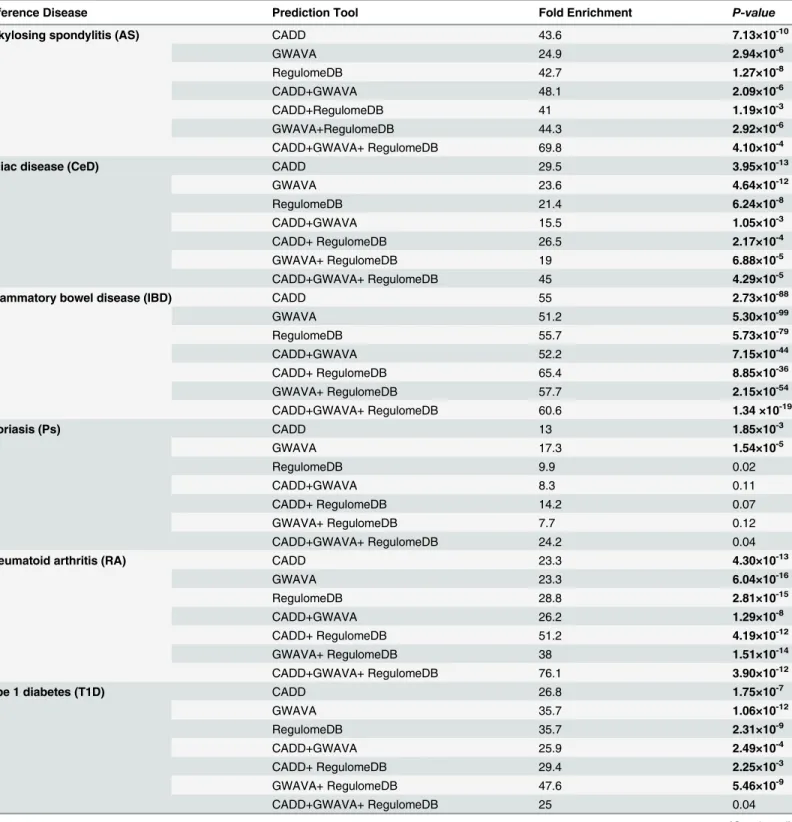
scores for genes of six IMDs along with thep-values(Fisher’s exact test) is provided inTable 3.
We can see that all the enrichment scores for AS, CeD, IBD, IMD5, IMD4and RA are
statisti-cally significant (p-value0.01). Whereas for Ps, enrichment scores for CADD and GWAVA
are statistically significant, and for T1D all enrichment scores but CADD+GWAVA+Regulo-meDB are statistically significant. For IBD related genes, there is a gradual increase in the en-richment scores when more than one prediction tools are used for prioritization, while for
other diseases more abrupt changes are observed (Table 3and Figure A—Figure H inS1 File).
It is clear from the comparison between IMD4and IMD5, RA hugely contributes to the overall
enrichment scores of IMD5; hence, we think it would be fair to compare the enrichment scores
between IBD and IMD4. There is a gradual increase in the enrichment scores for IBD when
more than one prediction tools are combined for SNP prioritization, while for IMD4it
de-creases. However, the full list of genes for gene-enrichment analysis, and the summary of the
gene overlap between the prediction tools and the reference diseases are available inS3andS4
Tables, respectively.
Two SNPs are considered to be in strong LD, if ther2value between the two is greater than
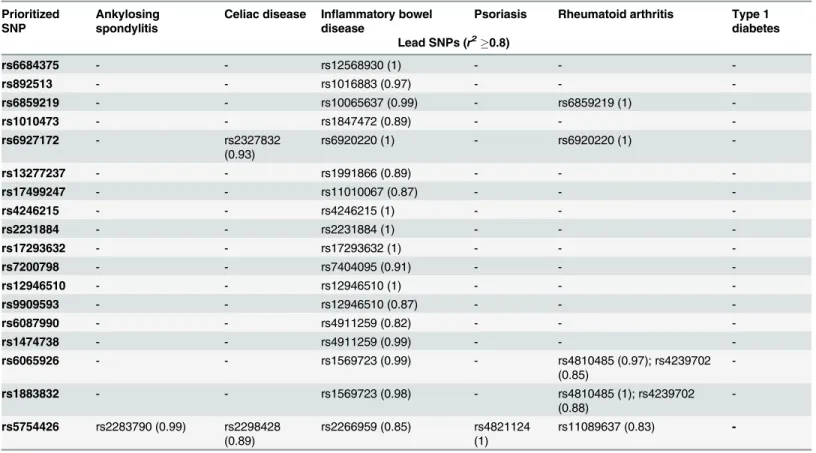
or equal to 0.8 (r20.8). We finally analyzed the strength of linkage-disequilibrium (LD)
be-tween the top 18 prioritized SNPs and lead GWAS SNPs of AS, CeD, IBD, Ps, RA and T1D (Table 4) for EUR population of the 1K Genomes Project. All the top 18 SNPs are in strong LD with the 15 GWAS SNPs of inflammatory bowel disease; while none of T1D associated GWAS SNPs had strong correlation. Rheumatoid arthritis associated seven GWAS SNPs are in strong Fig 4. Bar diagram representing the number of SNPs in each RegulomeDB category.Here n = 4734 variants.ND: No Data.
doi:10.1371/journal.pone.0119420.g004
Fig 5. Concordance Analysis.(a) Scatterplot depicting top annotation scores from CADD, GWAVA and RegulomeDB. Each point represents a single SNP where CADD scores are in thex axis, GWAVA scores in they axisand RegulomeDB annotation scores are shown with colors. The plot is divided into four segments usingyintercept = 0.4 andxintercept = 10. Top right segment contains 18 SNPs with highest annotation scores from the three classifiers. (b) Venn diagram illustrating the number of SNPs in concordance with the three classifiers. Here CADD scores are in blue, GWAVA scores are in red and
RegulomeDB scores are in green. The intersection of three circles represents SNPs in concordance with all three classifiers. Note: Cutoff scores used for concordance analysis are: CADD10, GWAVA0.4 and RegulomeDB2. Based on this cutoff, 929 SNPs are plotted in the scatterplot and Venn diagram (after removing the overlap).RegDB: RegulomeDB annotation score;LLAB: Less likely to affect binding (includes category 3a and 3b);MBE: Minimal binding evidence (includes category 4, 5 and 6);ND: No Data.
LD with five of the prioritized SNPs. There are two celiac disease associated GWAS SNPs and one SNP each for ankylosing spondylitis and psoriasis in strong LD with the top prioritized SNPs.
Discussion
The list of IBD associated GWAS loci is expanding very rapidly, which necessitates further in-vestigation to pinpoint risk variants from associated loci and to elucidate the biological rele-vance of these associations. The task is not straightforward since most of the associated variants are noncoding, and interpreting the role of noncoding variants in disease pathogenesis is more challenging than coding variants—which have a direct effect on protein structure and
function. However, noncoding variants are usually enriched in gene regulatory regions [46],
and therefore annotations characteristic for regulatory sites, such as sequence conservation, chromatin state, expression quantitative trait loci (eQTL), transcription factor (TF) binding sites, etc. could be assigned to overlapping noncoding variants. Thus, variants with various reg-ulatory annotations could be predicted functional for the underlying trait. So far, many studies
being conducted to identify regulatory elements in human, where ENCODE project [32] is the
biggest of its kind. Based on ENCODE data as well as other independent studies, many bioin-formatics tools have been developed for annotating noncoding variants. In this study, we used four of these publicly available annotation tools, e.g. dbPSHP, CADD, GWAVA and Regulo-meDB, for prioritizing IBD associated noncoding variants with potential gene
regulatory functions.
We analyzed selective constraints on the 152 lead noncoding SNPs (representing 152 GWAS loci), since regulatory regions (e.g. transcription start sites (TSSs) and promoters) often Table 2. List of prioritized putative regulatory SNPs.
Chromosome: Position SNP LD (r2) Lead SNP CADD GWAVA RegulomeDB Genes¥
1:22706434 rs6684375 1 rs12568930 13.02 0.44 2b
-2:198905874 rs892513 0.97 rs1016883 14.41 0.4 1f PLCL1
5:55438580 rs6859219 0.99 rs10065637 14.68 0.41 2b ANKRD55
6:90856878 rs1010473 0.89 rs1847472 15.44 0.58 2b BACH2
6:138002175 rs6927172 1 rs6920220 13.8 0.58 2b
-8:130604563 rs13277237 0.89 rs1991866 12.78 0.58 2b CCDC26
10:35426755 rs17499247 0.87 rs11010067 13.8 0.47 1f CREM, RNU7-77P
11:61564299 rs4246215 1 rs4246215 10.67 0.78 1f FADS1, FADS2, FEN1, MIR611
11:65656564 rs2231884 1 rs2231884 10.92 0.57 1b CCDC85B, FIBP, FOSL1
15:67442596 rs17293632 1 rs17293632 13.47 0.46 2a SMAD3
16:23853860 rs7200798 0.91 rs7404095 13.26 0.44 1f PRKCB
17:37912377 rs12946510 1 rs12946510 11.41 0.5 1b
-17:37970149 rs9909593 0.87 rs12946510 18.53 0.44 1f IKZF3
20:31349908 rs6087990 0.82 rs4911259 13.54 0.68 2b DNMT3B
20:31380309 rs1474738 0.99 rs4911259 13.11 0.42 2b DNMT3B
20:44735854 rs6065926 0.99 rs1569723 16.82 0.65 1f
-20:44746982 rs1883832 0.98 rs1569723 11.83 0.81 1f CD40
22:21980638 rs5754426 0.85 rs2266959 10.1 0.42 2b UBE2L3, YDJC
Position (hg19). Ref: Reference allele. Alt: Alternative allele. Cutoff: CADD10, GWAVA0.4 and RegulomeDB2.
¥Nearby genes are obtained usingEnsembl Variant Effect Predictor (VEP)[39] and genes with HGNC [40] approved symbols are shown here.
doi:10.1371/journal.pone.0119420.t002
Fig 6. Gene interaction network using GeneMANIA webserver.Here genes are represented as nodes and edges indicate different types of interaction between genes. Black circles are the query genes and the color coding on edges indicate different types of interaction—which is defined in the
network legend.
overlap evolutionarily conserved sites in mammals [47], and therefore the functional impor-tance of these SNPs can be explored in terms of constrained elements. The intensity of evolu-tionary constraint on each aligned position can be measured in terms of GERP++ rejected
substitution (RS) [28]—where negative RS scores indicate regions under positive selection and
positive RS scores indicate regions under selective constraint, i.e. negatively selected—which
often correlates biological function [27]. It is apparent from GERP++ scores, ~43% (65 SNPs)
IBD associated noncoding lead SNPs lie in evolutionary conserved regions (RS0), and ~11%
(16 SNPs) of these are under strong negative selection (RS2). However, coding sequences are
usually more conserved evolutionarily than noncoding regions of the genome. Therefore, anal-ysis of population specific variations in regulatory regions, where evolutionary remodeling may
extensively operate [47], is of greater importance for understanding human specific selection
in the region [48]. Population specific neutrality estimates, e.g. Tajima’s D (TD) provided new
insight about the selective constraints on IBD loci in European population. We demonstrated that around 30% (45 SNPs) of the noncoding variants are under strong balancing selection in
CEU population (TD score>2) even though these regions are positively selected (GERP++ RS
<0) in mammalian evolution (Fig. 1). We also identified 10 SNPs under strong selective
con-straint based on high GERP++ RS and TD scores (both RS & TD scores>2). These SNPs could
contribute to IBD pathogenesis by disrupting gene expression. From cross population diversity
estimates we can see more than 60% of the SNPs have higher derived allele frequency (ΔDAF
Fig 7. Top MCODE clusters from the gene interaction network.Highly connected gene clusters were identified from the network using MCODE v1.32 (a Cytoscape 2.8.2 plugin) and the top 11 clusters are presented (cutoff score1).
doi:10.1371/journal.pone.0119420.g007
Table 3. Summary of the enrichment scores for genes in six immune-mediated diseases (IMDs) using a combination of CADD, GWAVA and RegulomeDB prediction tool.
Reference Disease Prediction Tool Fold Enrichment P-value
Ankylosing spondylitis (AS) CADD 43.6 7.13×10⁻¹⁰
GWAVA 24.9 2.94×10⁻⁶
RegulomeDB 42.7 1.27×10⁻⁸
CADD+GWAVA 48.1 2.09×10⁻⁶
CADD+RegulomeDB 41 1.19×10⁻³
GWAVA+RegulomeDB 44.3 2.92×10⁻⁶
CADD+GWAVA+ RegulomeDB 69.8 4.10×10⁻⁴
Celiac disease (CeD) CADD 29.5 3.95×10⁻¹³
GWAVA 23.6 4.64×10⁻¹²
RegulomeDB 21.4 6.24×10⁻⁸
CADD+GWAVA 15.5 1.05×10⁻³
CADD+ RegulomeDB 26.5 2.17×10⁻⁴
GWAVA+ RegulomeDB 19 6.88×10⁻⁵
CADD+GWAVA+ RegulomeDB 45 4.29×10⁻⁵
Inflammatory bowel disease (IBD) CADD 55 2.73×10-88
GWAVA 51.2 5.30×10-99
RegulomeDB 55.7 5.73×10-79
CADD+GWAVA 52.2 7.15×10-44
CADD+ RegulomeDB 65.4 8.85×10-36
GWAVA+ RegulomeDB 57.7 2.15×10-54
CADD+GWAVA+ RegulomeDB 60.6 1.34 ×10⁻¹⁹
Psoriasis (Ps) CADD 13 1.85×10⁻³
GWAVA 17.3 1.54×10⁻⁵
RegulomeDB 9.9 0.02
CADD+GWAVA 8.3 0.11
CADD+ RegulomeDB 14.2 0.07
GWAVA+ RegulomeDB 7.7 0.12
CADD+GWAVA+ RegulomeDB 24.2 0.04
Rheumatoid arthritis (RA) CADD 23.3 4.30×10⁻¹³
GWAVA 23.3 6.04×10⁻¹⁶
RegulomeDB 28.8 2.81×10⁻¹⁵
CADD+GWAVA 26.2 1.29×10⁻⁸
CADD+ RegulomeDB 51.2 4.19×10⁻¹²
GWAVA+ RegulomeDB 38 1.51×10⁻¹⁴
CADD+GWAVA+ RegulomeDB 76.1 3.90×10⁻¹²
Type 1 diabetes (T1D) CADD 26.8 1.75×10⁻⁷
GWAVA 35.7 1.06×10⁻¹²
RegulomeDB 35.7 2.31×10⁻⁹
CADD+GWAVA 25.9 2.49×10⁻⁴
CADD+ RegulomeDB 29.4 2.25×10⁻³
GWAVA+ RegulomeDB 47.6 5.46×10⁻⁹
CADD+GWAVA+ RegulomeDB 25 0.04
>0) in CEU population than the rest of the world. This is understandable because the GWAS and meta-analysis data considered in this study was for people of European ancestry—which may also explain the high prevalence of IBD in this population.
However, not all GWAS identified SNPs are functional in disease pathogenesis—some vari-ants may contribute to the disease directly and others through the varivari-ants in strong
linkage-disequilibrium (LD) [49,50]. Therefore, we investigated 152 lead noncoding SNPs along with
4,582 LD variants (total 4,734 variants) using three integrative annotation tools, e.g. CADD, GWAVA, and RegulomeDB, and identified 323 SNPs, 509 SNPs and 297 SNPs, respectively (total 929 SNPs, after removing overlap). Some of these 929 SNPs had very high annotation scores, some variants overlap gene regulatory regions, such as promoter, transcription factor binding sites, DNase I hypersensitive sites, and eQTLs, while few others had regulatory annota-tions from HGMD-PUBLIC. These variants are more likely to be functional in IBD. We pre-sented gene interaction network and showed highly connected gene clusters—which represent different types of interaction between the prioritized genes (genes in the vicinity of the priori-tized variants). In addition, we showed that IBD associated lead noncoding GWAS SNPs had higher CADD and GWAVA scores than the LD variants, which is consistent with previous
findings [24,25]. Similarly, a higher percent of lead GWAS SNPs had RegulomeDB scores<3
compared to the LD variants, which is comparable to a recent study where ~6.8% GWAS SNPs
(3 out of 44 SNPs) had RegulomeDB score<3 against ~ 5.4% LD variants (31 out of 570 SNPs)
[49].
We then analyzed the consensus between the three classifiers’prioritized variants and
found 68 SNPs common between CADD and GWAVA, 15 SNPs between CADD and Regulo-meDB, and 81 SNPs between GWAVA and RegulomeDB. Among which rs2298428 (CADD = Table 3. (Continued)
Reference Disease Prediction Tool Fold Enrichment P-value
IMD5 CADD 21.8 1.03×10⁻²⁷
GWAVA 20.7 1.16×10⁻³¹
RegulomeDB 21.3 1.35×10⁻²³
CADD+GWAVA 17.2 4.98×10⁻¹¹
CADD+RegulomeDB 26.7 3.21×10⁻¹²
GWAVA+RegulomeDB 24.5 5.09×10⁻¹⁹
CADD+GWAVA+RegulomeDB 36.3 2.73×10⁻¹¹
IMD4 CADD 22.3 8.21×10⁻²⁰
GWAVA 22.6 1.22×10⁻²⁴
RegulomeDB 20.1 2.63×10⁻¹⁵
CADD+GWAVA 13.6 6.03×10⁻⁶
CADD+ RegulomeDB 15.5 1.34×10⁻⁴
GWAVA+ RegulomeDB 20.9 7.08×10⁻¹¹
CADD+GWAVA+ RegulomeDB 19.7 4.65×10⁻⁴
Fold-enrichment was calculated as ((m/n)/(M/N)), where m is the number of prioritized genes (using a tool or a combination of tools) belong to the disease of interest, n is the total number of genes prioritized using a tool (or combination of tools), M is the total number of genes belong to the disease of interest, and N is the human genome background (30,000 genes). Thep-valueswere obtained using Fisher’s exact test. Here,p-valuesless than or equal to 0.01 (0.01) are considered to be statistically significant (bold). For the enrichment analysis, reported genes (with HGNC approved gene symbol) were
obtained from genome-wide studies of six immune-mediated diseases (IMDs): AS [16,41], CeD [16], IBD [1], Ps [16,42,43], RA [16] and T1D [16].
Ensembl Variant Effect Predictor (VEP)[39] is used to obtain genes nearby the prioritized SNPs (only HGNC approved gene symbols are counted for the test). Full list of genes and the summary of the gene overlap are available inS3andS4Tables.IMD5: AS+CeD+Ps+RA+T1D;IMD4: AS+CeD+Ps+T1D.
doi:10.1371/journal.pone.0119420.t003
24.5 & GWAVA = 0.61) and rs713875 (GWAVA = 0.47, RegulomeDB = 1f) are worth
men-tioning. SNP rs2298428 is found to be associated with IBD and celiac disease [51], and is also a
cis-eQTL associated with IBD [52,53], while SNP rs713875 is a cis-regulated ASM
(allele-specific DNA methylation) variant associated with IBD [54].
Finally, through concordance analysis we identified 18 SNPs from 15 IBD associated GWAS loci. These noncoding variants are more likely to have regulatory functions and may contribute to IBD pathogenesis by dysregulating the expression of nearby genes. Four of these eighteen prioritized SNPs are lead GWAS SNPs, which indicates that some of the lead GWAS SNPs are true causal variants for the underlying trait, while the effect of the remaining variants could be inferred from the variants in strong LD with the lead GWAS SNPs. Interestingly, some of these 18 SNPs and genes in the vicinity are found to be associated with cancer and other immune-mediated diseases (IMDs). For example, rs5754426 is the top ranked variant among 92 SNPs in the locus—which includes some newly identified SNPs associated with
celi-ac disease (UBE2L3rs2298428) [55], Crohn’s disease (CD) and psoriasis (YDJCrs181359)
[56], as well as chronic hepatitis B virus infection (UBE2L3rs4821116) [57]. Another top
ranked SNP rs1883832 (CD40) is found to be associated with atherosclerosis in Chinese
popu-lation [58]. Moreover, a recent study in Russians showed the association of twoCD40variants
Table 4. Summary of the linkage-disequilibrium (LD) (r2
0.8) between prioritized SNPs and lead SNPs from six immune-mediated diseases (IMDs).
Prioritized SNP
Ankylosing spondylitis
Celiac disease Inflammatory bowel disease
Psoriasis Rheumatoid arthritis Type 1 diabetes Lead SNPs (r2
0.8)
rs6684375 - - rs12568930 (1) - -
-rs892513 - - rs1016883 (0.97) - -
-rs6859219 - - rs10065637 (0.99) - rs6859219 (1)
-rs1010473 - - rs1847472 (0.89) - -
-rs6927172 - rs2327832
(0.93)
rs6920220 (1) - rs6920220 (1)
-rs13277237 - - rs1991866 (0.89) - -
-rs17499247 - - rs11010067 (0.87) - -
-rs4246215 - - rs4246215 (1) - -
-rs2231884 - - rs2231884 (1) - -
-rs17293632 - - rs17293632 (1) - -
-rs7200798 - - rs7404095 (0.91) - -
-rs12946510 - - rs12946510 (1) - -
-rs9909593 - - rs12946510 (0.87) - -
-rs6087990 - - rs4911259 (0.82) - -
-rs1474738 - - rs4911259 (0.99) - -
-rs6065926 - - rs1569723 (0.99) - rs4810485 (0.97); rs4239702
(0.85)
-rs1883832 - - rs1569723 (0.98) - rs4810485 (1); rs4239702
(0.88)
-rs5754426 rs2283790 (0.99) rs2298428 (0.89)
rs2266959 (0.85) rs4821124 (1)
rs11089637 (0.83)
-The strength of correlation between the top 18 prioritized SNPs and lead SNPs from six IMDs e.g. AS [16,41], CeD [16], IBD [1], Ps [16,42,43], RA [16] and T1D [16] were checked for European population of 1K Genomes Project. The lead SNPs for the six IMDs were retrieved from NHGRI GWAS catalog (and literatures), and the variants in strong linkage-disequilibrium (LD) (r20.8) with the lead GWAS SNPs were obtained using the HaploReg v2
webserver [26]. The LD variants’list for each reference disease is manually screened for identifying the overlap with the top 18 prioritized SNPs.
rs6074022 and rs1883832 with multiple sclerosis (MS)—where only rs6074022 reached
ge-nome-wide significance [59]. In contrast, our results suggest that rs1883832 and rs6065926 are
the top two putative regulatory variants from the locus, where the former has known regulatory
function inCD40mRNA translation [60]. Besides, it is found that the loci rs2231884 (FOSL1,
FIBP,CCDC85B) and rs2266959 (UBE2L3,YDJC) overlap active DNA regulatory elements
(DRE) of the intestine and immune cells of IBD patients, while rs17293632 (SMAD3),
rs7404095 (PRKCB) and rs12946510 only overlap DRE of immune cells [61]. However, there
are evidences for other prioritized SNPs as well, such as, rs6859219 (ANKRD55) is found to be
associated with MS risk [62]; rs6927172 (TNFAIP3) is found to be associated with anti-TNF
therapy response among IBD patients [63]; rs4246215 (FEN1) is associated with DNA damage
[64] and increased risk of colorectal cancer [65]; and rs17293632 (SMAD3) is found to be
asso-ciated with the recurrence of surgery in CD patients [66]. These indicate the quality of CADD,
GWAVA, and RegulomeDB findings, and show the functional relevance of the prioritized variants.
Furthermore, our analysis showed that a combination of these three tools could be very ef-fective to annotate and prioritize putative functional noncoding variants from GWAS loci. To evaluate this, we analyzed the enrichment scores for genes of IBD and five other IMDs (e.g. AS, CeD, Ps, RA and T1D), as well as strength of linkage-disequilibrium (LD) between the top pri-oritized SNPs and lead GWAS SNPs from those diseases. We observed rapid changes in the en-richment scores at each level of prioritization, i.e. variants prioritized by any one tool, any two
tools, or a combination of all three (Table 3). And it is apparent from the analysis, for IBD
there is a consistent increase in the enrichment scores when multiple programs are used, while
for IMD4(combined genes from AS, CeD, Ps and T1D) there is a decrease in the enrichment.
It is noticeable, for IBD the enrichment was highest (~65 fold) when CADD+RegulomeDB is used compared to any other combination of tools—which may be due to the relatively higher number of genes containing loci; nonetheless, the final enrichment (CADD+GWAVA+Regu-lomeDB, ~61 fold) is also considerable. Moreover, the top 18 SNPs are in strong
linkage-disequilibrium (LD) (r20.8) with IBD associated 15 lead GWAS SNPs (Table 4). These
re-sults indicate the relatedness of the proposed model to prioritize regulatory variants from the GWAS loci.
An interesting observation was the significant level of enrichment for other IMDs, which could be partly explained in terms of pleiotropy—a phenomenon of shared loci where variants in the same gene could lead to different phenotypic effects. Pleiotropy is very common in
com-plex traits, such as immune-mediated diseases (IMDs) [18]. For example, in IBD 70% (113 out
of 163) of the loci are shared with other diseases or traits, and around 40% (66 out of 163) of
this overlap is with IMDs [1]. However, our studied loci had 29% (44 out of 152) overlap with
IMD5, which eventually reached to 40% (6 out of 15) in the final level of prioritization; this
in-dicates the functional importance of these loci in autoimmune diseases in general. Nonetheless, the direction of this sharing is not same for all the overlapping loci; some are concordant, while others are discordant. For example, the variants of rs10065637, rs6920220, rs12946510, and rs2266959 loci are associated with increased risk of IBD and RA (i.e. same effect), but
rs1569723 variants have opposite effect (discordant) on the phenotypes (for detail analysis ref. [18]).
Although, we were successful in identifying few variants with probable regulatory functions from the studied GWAS loci (which was the main aim of this study), we could not be
conclu-sive for their association with IBD or other IMDs, due to the limitation of ourin-silicomethod
(none of the tools were disease specific; regulatory elements (e.g. TF binding sites, eQTLs) mostly for certain cell types from ENCODE). However, some of the results are well aligned with other literary evidences from IBD patients, where we could suspect their involvement
with the disease. Overall, with a combination of constrained elements and prediction tools we were able to cover around 95% (145 out of 152) of the loci, though we cannot infer the func-tional importance of the remaining loci using our methods.
This study showed a method of post-GWAS data analysis leveraging the publicly available bioinformatics resources. We found integrative annotation a very powerful tool for prioritizing functional variants from the background, which could be adopted in the upstream or down-stream analysis to optimize GWAS findings. However, in spite of the compelling evidences, the findings of this computational prediction should be handled with caution and must be verified experimentally using appropriate systems before considering for genomic medicine.
Supporting Information
S1 Table. Summary of GERP++, TD, DAF andΔDAF scores for the 152 lead noncoding GWAS SNPs.
(DOCX)
S2 Table. Summary of integrative annotation scores of IBD associated lead noncoding SNPs and variants in strong linkage-disequilibrium (LD) with the lead SNPs, using CADD, GWAVA and RegulomeDB tools.
(XLSX)
S3 Table. Full list of genes used in gene-enrichment analysis. (PDF)
S4 Table. Summary of the gene overlap between the reference disease and the prediction tool.
(PDF)
S1 File. Enrichment scores for AS, CeD, IBD, Ps, RA, T1D, IMD4 and IMD5 are presented in line-graphs in Figure A—Figure H in S1 File, respectively.
(PDF)
S2 File. Gene interaction network (Cytoscape Session). (RAR)
Acknowledgments
We are thankful to Department of Biochemistry, King Abdulaziz University and Deanship of Scientific Research (DSR), King Abdulaziz University, Jeddah, Saudi Arabia for providing the opportunity to conduct this study. We also thank Ms Abeda Sultana for her advice during manuscript preparation. We are also thankful to two anonymous reviewers for their insightful comments which significantly improved the article.
Author Contributions
Conceived and designed the experiments: MMU FAA. Performed the experiments: MMU. An-alyzed the data: MMU. Contributed reagents/materials/analysis tools: MMU RE BB NAS FAA. Wrote the paper: MMU RE. Supervised the study: FAA.
References
2. Nguyen GC, Chong CA, Chong RY. National estimates of the burden of inflammatory bowel disease among racial and ethnic groups in the United States. J Crohns Colitis. 2014; 8(4):288–95. doi:10.1016/ j.crohns.2013.09.001PMID:24074875
3. Molodecky NA, Soon IS, Rabi DM, Ghali WA, Ferris M, Chernoff G, et al. Increasing incidence and prevalence of the inflammatory bowel diseases with time, based on systematic review. Gastroenterolo-gy. 2012; 142(1):46–54 e42; quiz e30. doi:10.1053/j.gastro.2011.10.001PMID:22001864
4. Ng SC, Bernstein CN, Vatn MH, Lakatos PL, Loftus EV Jr, Tysk C, et al. Geographical variability and environmental risk factors in inflammatory bowel disease. Gut. 2013; 62(4):630–49. doi: 10.1136/gutjnl-2012-303661PMID:23335431
5. Prideaux L, Kamm MA, De Cruz PP, Chan FK, Ng SC. Inflammatory bowel disease in Asia: a systemat-ic review. Journal of gastroenterology and hepatology. 2012; 27(8):1266–80. doi:10.1111/j.1440-1746. 2012.07150.xPMID:22497584
6. Aujnarain A, Mack DR, Benchimol EI. The role of the environment in the development of pediatric in-flammatory bowel disease. Curr Gastroenterol Rep. 2013; 15(6):326. doi:10.1007/s11894-013-0326-4 PMID:23640032
7. Khor B, Gardet A, Xavier RJ. Genetics and pathogenesis of inflammatory bowel disease. Nature. 2011; 474(7351):307–17. doi:10.1038/nature10209PMID:21677747
8. Kaser A, Zeissig S, Blumberg RS. Inflammatory bowel disease. Annual review of immunology. 2010; 28:573–621. doi:10.1146/annurev-immunol-030409-101225PMID:20192811
9. Cader MZ, Kaser A. Recent advances in inflammatory bowel disease: mucosal immune cells in intesti-nal inflammation. Gut. 2013; 62(11):1653–64. doi:10.1136/gutjnl-2012-303955PMID:24104886 10. Knights D, Lassen KG, Xavier RJ. Advances in inflammatory bowel disease pathogenesis: linking host
genetics and the microbiome. Gut. 2013; 62(10):1505–10. doi:10.1136/gutjnl-2012-303954PMID: 24037875
11. Ananthakrishnan AN, Xavier RJ. How does genotype influence disease phenotype in inflammatory bowel disease? Inflamm Bowel Dis. 2013; 19(9):2021–30. doi:10.1097/MIB.0b013e318281f5c5PMID: 23644824
12. Biancheri P, Powell N, Monteleone G, Lord G, Macdonald TT. The challenges of stratifying patients for trials in inflammatory bowel disease. Trends Immunol. 2013; 34(11):564–71. doi:10.1016/j.it.2013.08. 002PMID:24035478
13. van der Valk ME, Mangen MJ, Leenders M, Dijkstra G, van Bodegraven AA, Fidder HH, et al. Health-care costs of inflammatory bowel disease have shifted from hospitalisation and surgery towards anti-TNFalpha therapy: results from the COIN study. Gut. 2014; 63(1):72–9. doi: 10.1136/gutjnl-2012-303376PMID:23135759
14. Buckley JP, Kappelman MD, Allen JK, Van Meter SA, Cook SF. The burden of comedication among pa-tients with inflammatory bowel disease. Inflamm Bowel Dis. 2013; 19(13):2725–36. doi:10.1097/01. MIB.0000435442.07237.a4PMID:24216689
15. van der Valk ME, Mangen MJ, Leenders M, Dijkstra G, van Bodegraven AA, Fidder HH, et al. Risk fac-tors of work disability in patients with inflammatory bowel disease—a Dutch nationwide web-based sur-vey: work disability in inflammatory bowel disease. J Crohns Colitis. 2014; 8(7):590–7. doi:10.1016/j. crohns.2013.11.019PMID:24351733
16. Welter D, MacArthur J, Morales J, Burdett T, Hall P, Junkins H, et al. The NHGRI GWAS Catalog, a cu-rated resource of SNP-trait associations. Nucleic Acids Res. 2014; 42(Database issue):D1001–6. doi: 10.1093/nar/gkt1229PMID:24316577
17. Robinson MR, Wray NR, Visscher PM. Explaining additional genetic variation in complex traits. Trends Genet. 2014; 30(4):124–32. doi:10.1016/j.tig.2014.02.003PMID:24629526
18. Parkes M, Cortes A, van Heel DA, Brown MA. Genetic insights into common pathways and complex re-lationships among immune-mediated diseases. Nat Rev Genet. 2013; 14(9):661–73. doi:10.1038/ nrg3502PMID:23917628
19. McCarthy JJ, McLeod HL, Ginsburg GS. Genomic medicine: a decade of successes, challenges, and opportunities. Sci Transl Med. 2013; 5(189):189sr4. doi:10.1126/scitranslmed.3005785PMID: 23761042
20. Wright FA, Sullivan PF, Brooks AI, Zou F, Sun W, Xia K, et al. Heritability and genomics of gene expres-sion in peripheral blood. Nat Genet. 2014; 46(5):430–7. doi:10.1038/ng.2951PMID:24728292 21. McCarthy MI, Hirschhorn JN. Genome-wide association studies: potential next steps on a genetic
jour-ney. Hum Mol Genet. 2008; 17(R2):R156–65. doi:10.1093/hmg/ddn289PMID:18852205
22. Cooper GM, Shendure J. Needles in stacks of needles: finding disease-causal variants in a wealth of genomic data. Nat Rev Genet. 2011; 12(9):628–40. doi:10.1038/nrg3046PMID:21850043
23. Paul DS, Soranzo N, Beck S. Functional interpretation of non-coding sequence variation: Concepts and challenges. Bioessays. 2014; 36(2):191–9. doi:10.1002/bies.201300126PMID:24311363 24. Kircher M, Witten DM, Jain P, O'Roak BJ, Cooper GM, Shendure J. A general framework for estimating
the relative pathogenicity of human genetic variants. Nat Genet. 2014; 46(3):310–5. doi:10.1038/ng. 2892PMID:24487276
25. Ritchie GR, Dunham I, Zeggini E, Flicek P. Functional annotation of noncoding sequence variants. Nat Methods. 2014; 11(3):294–6. doi:10.1038/nmeth.2832PMID:24487584
26. Ward LD, Kellis M. HaploReg: a resource for exploring chromatin states, conservation, and regulatory motif alterations within sets of genetically linked variants. Nucleic Acids Res. 2012; 40(Database issue):D930–4. doi:10.1093/nar/gkr917PMID:22064851
27. Davydov EV, Goode DL, Sirota M, Cooper GM, Sidow A, Batzoglou S. Identifying a high fraction of the human genome to be under selective constraint using GERP++. PLoS Comput Biol. 2010; 6(12): e1001025. doi:10.1371/journal.pcbi.1001025PMID:21152010
28. Cooper GM, Stone EA, Asimenos G, Green ED, Batzoglou S, Sidow A. Distribution and intensity of con-straint in mammalian genomic sequence. Genome Res. 2005; 15(7):901–13. PMID:15965027 29. Tajima F. Statistical method for testing the neutral mutation hypothesis by DNA polymorphism.
Genet-ics. 1989; 123(3):585–95. PMID:2513255
30. Li MJ, Wang LY, Xia Z, Wong MP, Sham PC, Wang J. dbPSHP: a database of recent positive selection across human populations. Nucleic Acids Res. 2014; 42(Database issue):D910–6. doi:10.1093/nar/ gkt1052PMID:24194603
31. Boyle AP, Hong EL, Hariharan M, Cheng Y, Schaub MA, Kasowski M, et al. Annotation of functional variation in personal genomes using RegulomeDB. Genome Res. 2012; 22(9):1790–7. doi:10.1101/gr. 137323.112PMID:22955989
32. Bernstein BE, Birney E, Dunham I, Green ED, Gunter C, Snyder M. An integrated encyclopedia of DNA elements in the human genome. Nature. 2012; 489(7414):57–74. doi:10.1038/nature11247PMID: 22955616
33. R Core Team. R: A language and environment for statistical computing. Vienna, Austria: R Foundation for Statistical Computing; 2014.
34. Wickham H. Ggplot2: elegant graphics for data analysis: Springer New York; 2009.
35. Chen H. VennDiagram: Generate high-resolution Venn and Euler plots. 2013;R package version 1.6.5. 36. Zuberi K, Franz M, Rodriguez H, Montojo J, Lopes CT, Bader GD, et al. GeneMANIA prediction server
2013 update. Nucleic Acids Res. 2013; 41(Web Server issue):W115–22. doi:10.1093/nar/gkt533 PMID:23794635
37. Saito R, Smoot ME, Ono K, Ruscheinski J, Wang PL, Lotia S, et al. A travel guide to Cytoscape plugins. Nat Methods. 2012; 9(11):1069–76. doi:10.1038/nmeth.2212PMID:23132118
38. Bader GD, Hogue CW. An automated method for finding molecular complexes in large protein interac-tion networks. BMC Bioinformatics. 2003; 4:2. PMID:12525261
39. McLaren W, Pritchard B, Rios D, Chen Y, Flicek P, Cunningham F. Deriving the consequences of geno-mic variants with the Ensembl API and SNP Effect Predictor. Bioinformatics. 2010; 26(16):2069–70. doi:10.1093/bioinformatics/btq330PMID:20562413
40. Seal RL, Gordon SM, Lush MJ, Wright MW, Bruford EA. genenames.org: the HGNC resources in 2011. Nucleic Acids Res. 2011; 39(Database issue):D514–9. doi:10.1093/nar/gkq892PMID:20929869 41. Cortes A, Hadler J, Pointon JP, Robinson PC, Karaderi T, Leo P, et al. Identification of multiple risk
vari-ants for ankylosing spondylitis through high-density genotyping of immune-related loci. Nat Genet. 2013; 45(7):730–8. doi:10.1038/ng.2667PMID:23749187
42. Tsoi LC, Spain SL, Knight J, Ellinghaus E, Stuart PE, Capon F, et al. Identification of 15 new psoriasis susceptibility loci highlights the role of innate immunity. Nat Genet. 2012; 44(12):1341–8. doi:10.1038/ ng.2467PMID:23143594
43. Tang H, Jin X, Li Y, Jiang H, Tang X, Yang X, et al. A large-scale screen for coding variants predispos-ing to psoriasis. Nat Genet. 2014; 46(1):45–50. doi:10.1038/ng.2827PMID:24212883
44. Stenson PD, Mort M, Ball EV, Shaw K, Phillips A, Cooper DN. The Human Gene Mutation Database: building a comprehensive mutation repository for clinical and molecular genetics, diagnostic testing and personalized genomic medicine. Human genetics. 2014; 133(1):1–9. PMID:24077912
45. Flicek P, Amode MR, Barrell D, Beal K, Billis K, Brent S, et al. Ensembl 2014. Nucleic Acids Res. 2014; 42(Database issue):D749–55. doi:10.1093/nar/gkt1196PMID:24316576
47. FANTOM Consortium, RIKEN PMI, CLST (DGT). A promoter-level mammalian expression atlas. Na-ture. 2014; 507(7493):462–70. doi:10.1038/nature13182PMID:24670764
48. Ward LD, Kellis M. Evidence of abundant purifying selection in humans for recently acquired regulatory functions. Science. 2012; 337(6102):1675–8. PMID:22956687
49. Rosenthal SL, Barmada MM, Wang X, Demirci FY, Kamboh MI. Connecting the Dots: Potential of Data Integration to Identify Regulatory SNPs in Late-Onset Alzheimer's Disease GWAS Findings. PLoS One. 2014; 9(4):e95152. doi:10.1371/journal.pone.0095152PMID:24743338
50. Schaub MA, Boyle AP, Kundaje A, Batzoglou S, Snyder M. Linking disease associations with regulato-ry information in the human genome. Genome Res. 2012; 22(9):1748–59. doi:10.1101/gr.136127.111 PMID:22955986
51. Parmar AS, Lappalainen M, Paavola-Sakki P, Halme L, Farkkila M, Turunen U, et al. Association of ce-liac disease genes with inflammatory bowel disease in Finnish and Swedish patients. Genes Immun. 2012; 13(6):474–80. doi:10.1038/gene.2012.21PMID:22592522
52. Fransen K, Visschedijk MC, van Sommeren S, Fu JY, Franke L, Festen EA, et al. Analysis of SNPs with an effect on gene expression identifies UBE2L3 and BCL3 as potential new risk genes for Crohn's disease. Hum Mol Genet. 2010; 19(17):3482–8. doi:10.1093/hmg/ddq264PMID:20601676
53. Kabakchiev B, Silverberg MS. Expression quantitative trait loci analysis identifies associations between genotype and gene expression in human intestine. Gastroenterology. 2013; 144(7):1488–96, 96 e1–3. doi:10.1053/j.gastro.2013.03.001PMID:23474282
54. Hutchinson JN, Raj T, Fagerness J, Stahl E, Viloria FT, Gimelbrant A, et al. Allele-specific methylation occurs at genetic variants associated with complex disease. PLoS One. 2014; 9(6):e98464. doi:10. 1371/journal.pone.0098464PMID:24911414
55. Amundsen SS, Viken MK, Sollid LM, Lie BA. Coeliac disease-associated polymorphisms influence thy-mic gene expression. Genes Immun. 2014; 15(6):355–60. doi:10.1038/gene.2014.26PMID:
24871462
56. Ellinghaus D, Ellinghaus E, Nair RP, Stuart PE, Esko T, Metspalu A, et al. Combined analysis of ge-nome-wide association studies for Crohn disease and psoriasis identifies seven shared susceptibility loci. Am J Hum Genet. 2012; 90(4):636–47. doi:10.1016/j.ajhg.2012.02.020PMID:22482804 57. Hu Z, Liu Y, Zhai X, Dai J, Jin G, Wang L, et al. New loci associated with chronic hepatitis B virus
infec-tion in Han Chinese. Nat Genet. 2013; 45(12):1499–503. doi:10.1038/ng.2809PMID:24162738 58. Yun Y, Ma C, Ma X. The SNP rs1883832 in CD40 gene and risk of atherosclerosis in Chinese
popula-tion: a meta-analysis. PLoS One. 2014; 9(5):e97289. doi:10.1371/journal.pone.0097289PMID: 24828072
59. Sokolova EA, Malkova NA, Korobko DS, Rozhdestvenskii AS, Kakulya AV, Khanokh EV, et al. Associ-ation of SNPs of CD40 gene with multiple sclerosis in Russians. PLoS One. 2013; 8(4):e61032. doi:10. 1371/journal.pone.0061032PMID:23613777
60. Jacobson EM, Concepcion E, Oashi T, Tomer Y. A Graves' disease-associated Kozak sequence sin-gle-nucleotide polymorphism enhances the efficiency of CD40 gene translation: a case for translational pathophysiology. Endocrinology. 2005; 146(6):2684–91. PMID:15731360
61. Mokry M, Middendorp S, Wiegerinck CL, Witte M, Teunissen H, Meddens CA, et al. Many inflammatory bowel disease risk loci include regions that regulate gene expression in immune cells and the intestinal epithelium. Gastroenterology. 2014; 146(4):1040–7. doi:10.1053/j.gastro.2013.12.003PMID: 24333384
62. Lill CM, Schjeide BM, Graetz C, Liu T, Damotte V, Akkad DA, et al. Genome-wide significant associa-tion of ANKRD55 rs6859219 and multiple sclerosis risk. J Med Genet. 2013; 50(3):140–3. doi:10.1136/ jmedgenet-2012-101411PMID:23315543
63. Bank S, Andersen PS, Burisch J, Pedersen N, Roug S, Galsgaard J, et al. Associations between func-tional polymorphisms in the NFkappaB signaling pathway and response to anti-TNF treatment in Dan-ish patients with inflammatory bowel disease. Pharmacogenomics J. 2014; 14(6):526–34. doi:10.1038/ tpj.2014.19PMID:24776844
64. Yang M, Guo H, Wu C, He Y, Yu D, Zhou L, et al. Functional FEN1 polymorphisms are associated with DNA damage levels and lung cancer risk. Hum Mutat. 2009; 30(9):1320–8. doi:10.1002/humu.21060 PMID:19618370
65. Zhang B, Jia WH, Matsuda K, Kweon SS, Matsuo K, Xiang YB, et al. Large-scale genetic study in East Asians identifies six new loci associated with colorectal cancer risk. Nat Genet. 2014; 46(6):533–42. doi:10.1038/ng.2985PMID:24836286
66. Fowler SA, Ananthakrishnan AN, Gardet A, Stevens CR, Korzenik JR, Sands BE, et al. SMAD3 gene variant is a risk factor for recurrent surgery in patients with Crohn's disease. J Crohns Colitis. 2014; 8 (8):845–51. doi:10.1016/j.crohns.2014.01.003PMID:24461721