in Complementing Genome-Wide Association Studies
Wenhua Wei1*, Attila Gyenesei2, Colin A. M. Semple1, Chris S. Haley1
1MRC Human Genetics Unit, MRC Institute of Genetics and Molecular Medicine at the University of Edinburgh, Edinburgh, United Kingdom,2Finnish Microarray and Sequencing Centre, Turku Centre for Biotechnology, University of Turku and A˚bo Akademi University, Turku, Finland
Abstract
Local interactions between neighbouring SNPs are hypothesized to be able to capture variants missing from genome-wide association studies (GWAS) via haplotype effects but have not been thoroughly explored. We have used a new high-throughput analysis tool to probe this underexplored area through full pair-wise genome scans and conventional GWAS in diastolic and systolic blood pressure and six metabolic traits in the Northern Finland Birth Cohort 1966 (NFBC1966) and the Atherosclerosis Risk in Communities study cohort (ARIC). Genome-wide significant interactions were detected in ARIC for systolic blood pressure betweenPLEKHA7(a known GWAS locus for blood pressure) andGPR180 (which plays a role in vascular remodelling), and also for triglycerides as local interactions within the 11q23.3 region (replicated significantly in NFBC1966), which notably harbours several loci (BUD13,ZNF259andAPOA5) contributing to triglyceride levels. Tests of the local interactions within the 11q23.3 region conditional on the top GWAS signal suggested the presence of two independent functional variants, each with supportive evidence for their roles in gene regulation. Local interactions captured 9 additional GWAS loci identified in this study (3 significantly replicated) and 73 from previous GWAS (24 in the eight traits and 49 in related traits). We conclude that the detection of local interactions requires adequate SNP coverage of the genome and that such interactions are only likely to be detectable between SNPs in low linkage disequilibrium. Analysing local interactions is a potentially valuable complement to GWAS and can provide new insights into the biology underlying variation in complex traits.
Citation:Wei W, Gyenesei A, Semple CAM, Haley CS (2013) Properties of Local Interactions and Their Potential Value in Complementing Genome-Wide Association Studies. PLoS ONE 8(8): e71203. doi:10.1371/journal.pone.0071203
Editor:Kai Wang, University of Southern California, United States of America
ReceivedMay 13, 2013;AcceptedJuly 3, 2013;PublishedAugust 5, 2013
Copyright:ß2013 Wei et al. This is an open-access article distributed under the terms of the Creative Commons Attribution License, which permits unrestricted use, distribution, and reproduction in any medium, provided the original author and source are credited.
Funding:This work was supported by the UK Medical Research Council Core Fund to the Human Genetic Unit and the Biotechnology and Biological Sciences Research Council (BB/H024484/2 to WHW, CAS and CSH, BB/K004964/1 to WHW). Funding for open access charge: the UK Medical Research Council Core Fund. Data access to the Northern Finland Birth Cohort 1966 (NFBC1966) study (phs000276.v1.p1) and the Atherosclerosis Risk in Communities (ARIC) study (phs000090.v1.p1) granted by the National Heart, Lung, and Blood Institute (NHLBI) Data Access Committee via Database of Genotypes and Phenotypes (http:// www.ncbi.nlm.nih.gov/gap). ARIC is carried out as a collaborative study supported by NHLBI contracts 55015, 55016, 55018, N01-HC-55019, N01-HC-55020, N01-HC-55021, N01-HC-55022, R01HL087641, R01HL59367 and R01HL086694; National Human Genome Research Institute contract U01HG004402; and National Institutes of Health contract HHSN268200625226C. Infrastructure was partly supported by Grant Number UL1RR025005, a component of the National Institutes of Health and NIH Roadmap for Medical Research. The NFBC1966 Study is conducted and supported by NHLBI in collaboration with the Broad Institute, UCLA, University of Oulu, and the National Institute for Health and Welfare in Finland. This manuscript was not prepared in collaboration with investigators of the NFBC1966 Study and does not necessarily reflect the opinions or views of the NFBC1966 Study Investigators, Broad Institute, UCLA, University of Oulu, National Institute for Health and Welfare in Finland and the NHLBI. The funders had no role in study design, data collection and analysis, decision to publish, or preparation of the manuscript.
Competing Interests:The authors have declared that no competing interests exist.
* E-mail: [email protected]
Introduction
The study of gene-gene interactions (epistasis) in complex traits has seen rapid advances in recent years. The potential importance of epistasis in explaining the extent and basis of heritability has been emphasized in both model organisms [1,2] and humans [3]. Previously searching for epistasis in genome-wide association studies (GWAS) was limited by the substantial demands it placed upon computational resources. The devel-opment of new methods and tools has greatly reduced the computational barrier and made the routine analysis of epistasis in GWAS data achievable [4,5,6,7,8]. Furthermore, progress has been made in dissecting the molecular mechanisms underlying epistasis [9,10]. With these advances it is hoped that future studies will accumulate more evidence of epistasis and improve our understanding of the role of epistasis in the genetic regulation of complex traits [11].
density SNP chips (e.g.,400 000 SNPs). Third, a big proportion of epistatic SNPs (e.g..40%) may not be near a gene [15,16] so bioinformatics methods considering non-coding variants are needed to assess their functional roles [18,19].
Various approaches may be considered to increase detection power for epistasis. One reason for the low power issue is the use of stringent genome-wide significance thresholds derived from Bonferroni adjustment for often several billions of pair-wise tests of all SNP combinations. Several knowledge-driven methods select a subset of SNPs based on prior biological knowledge (e.g. genes and proteins in particular pathways) and only test pair-wise interactions between the selected SNPs so that a more relaxed threshold could be used to claim significance [6,20,21]. Knowl-edge-driven methods that are restricted to SNPs with functional annotation will miss interaction signals involving other SNPs, such as those in pathways not currently implicated, or those lacking functional annotation altogether (e.g. SNPs in non-coding regions). Interactions between neighbouring SNPs (local interactions) are hypothesized to be able to capture variants missing from GWAS via haplotype effects [22]. Local interactions have been previously reported (without testing for replication) in several human diseases and metabolic traits [12], including C-reactive protein (CRP), diastolic blood pressure (DBP), glucose (GLU), high-density lipoprotein (HDL), insulin (INS), low-density lipoprotein (LDL), systolic blood protein (SBP), triglycerides (TRI), but they are not thoroughly explored. Concentrating only on local interactions between SNPs on the same chromosome and within a certain distance such as one million base pairs (Mb) would also mean a much reduced number of pair-wise tests and consequently a relaxed significance threshold. On the other hand, it has been shown that analysing multiple metabolic traits together could identify pleiotropic effects and common pathways from the shared single SNP signals (not necessarily genome-wide significant) from GWAS [23,24]. It is an open question whether sub-significant epistatic signals shared in multiple metabolic traits could also lead to new insights into the functional organization of the complex metabolomes [25].
Here we used the Atherosclerosis Risk in Communities study cohort (ARIC) and the Northern Finland Birth Cohort (NFBC1966) to explore the potential values of high throughput analyses of epistasis in the eight metabolic traits above. ARIC is one of the largest GWAS populations available and both its sample size and density of SNPs genotyped nearly double the counterparts in NFBC1966. After data scrutiny and quality control checks (Table S1), we performed full pair-wise genome scans using BiForce and conventional GWAS in all eight metabolic traits in both cohorts, identified and tested replication of genome-wide significant epistatic signals. It has been shown that a combined search algorithm implemented in BiForce can increase the power of detection of epistasis by applying appropriate thresholds to test interactions involving SNPs with genome-wide significant mar-ginal effects (marmar-ginal SNPs) while keeping false-positive rates under control [12]. We then assessed the impact of sample size and SNP density on power of detection by comparing the computed interaction profiles in each trait between the two cohorts. Further we characterised local interactions between SNPs located within 1 Mb and with an interaction P value (Pint) less than a threshold of
1.0E-05 derived from region based permutations (Material and Methods section). We used the r2measure of LD throughout this study which is considered to be the best LD measure in studying epistasis and robust to the Hardy-Weinberg Equilibrium assump-tion [26]. Our results suggest that analysing local interacassump-tions is an effective and valuable complement to GWAS and can provide new insights into the biology underlying variation in complex traits.
Results
Pair-wise genome scans detect significant epistasis
We analyzed 514 662 and 323 697 SNPs in the ARIC and NFBC1966 cohorts respectively (Table S1). For single SNP based genome scans (i.e. conventional GWAS) the consensus threshold (P = 5.0E-08) [27] was applied to identify marginal SNP. For full pair-wise genome scans Bonferroni adjusted thresholds for the total number of tests, i.e. 3.8E-13 and 9.5E-13 when no marginal SNPs were involved and 9.7E-08 and 1.5E-07 when at least one marginal SNP was involved, were used to identify genome-wide significant epistatic SNP pairs in ARIC and NFBC1966 respec-tively (Materials and Methods section). Conventional GWAS identified numerous genome-wide significant SNPs in five traits (i.e. CRP, GLU, HDL, LDL and TRI) in both cohorts (Table S2). These results are in line with the original GWAS of the two cohorts [28,29,30].
Pair-wise genome scans identified six epistatic pairs of SNPs carrying strong interaction signals in ARIC only (Table 1). The first two pairs, i.e. rs409354 rs1417733 for SBP and rs10892020 -rs17119975 for TRI, had mainly interactions with negligible marginal effects and were considered genome-wide significant based on the Bonferroni adjusted threshold of 3.8E-13 (note the Pintof the SBP pair did not exceed but was close enough to the
stringent threshold). The remaining four epistatic pairs each included one marginal SNP (Table S2), of which the two SNP pairs with Pint,1.9E-09 for TRI were genome-wide significant
and the remaining two (for TRI and HDL respectively) were suggestive. Interestingly, the four epistatic SNP pairs identified for TRI were all local interactions between SNPs closely located (distance ,45 kilobases) in the 11q23.3 region, which contains multiple genes associated with lipid traits (Table 1). The SNP pair rs409354 - rs1417733 for SBP was also found in DBP but with Pint
of 3.9E-06. Replication of the six epistatic pairs was tested in the NFBC1966 cohort but only at the region level (Materials and Methods section) because none of the listed epistatic SNPs were genotyped in NFBC1966. All six pairs had some evidence for replication (Pint,0.05) but only the replication of the 11q23.3 local
interaction pairs for TRI exceeded the significance threshold of 5.6E-04 derived from permutation.
SNP coverage is critical in the detection of local interactions
The power advantage in ARIC over NFBC1966 was clearly observed in every trait studied when sub-significant SNP pairs were considered together (Figure 1, Table S3). For example, the numbers of SNP pairs with Pint,5.0E-08 (i.e. the GWAS
consensus threshold) in each trait in NFBC1966 were approxi-mately 40% of the counterparts in ARIC, which is coincident with the difference of the SNP coverage in the two cohorts, i.e. (323 697 in NFBC1966)2/(514 662 in ARIC)2= 0.4. The most striking differences were the numbers of local interaction pairs detected in each trait between NFBC1966 (,50) and ARIC (800 to 1000), suggesting that SNP coverage might be particularly important to detect local interactions.
Using the TRI trait in ARIC as an example, we examined the impact of sample size and SNP coverage separately. A reduction of the ARIC sample size by random sampling (with no changes to SNP coverage) to 4873 – the sample size of NFBC1966 (Table S1) - did not substantially alter the number of SNP pairs with Pint,5.0E-08 (from 5684 to 5446) or the number of local
respectively, none remaining significant). However, a reduction by random sampling of the number of ARIC SNPs (with no changes to sample size) to 323 697 – the total number of SNPs in NFBC1966 – dramatically reduced the numbers of SNP pairs with Pint,5.0E-08 (to 2376) and local interaction pairs (to 332),
including all the four SNP pairs for TRI (Table 1). Clearly, SNP coverage is disproportionately important for the power of epistasis detection.
Local interactions capture both known and novel loci via haplotype effects
Exploring the pairwise interactions with Pint,1.0E-05 but
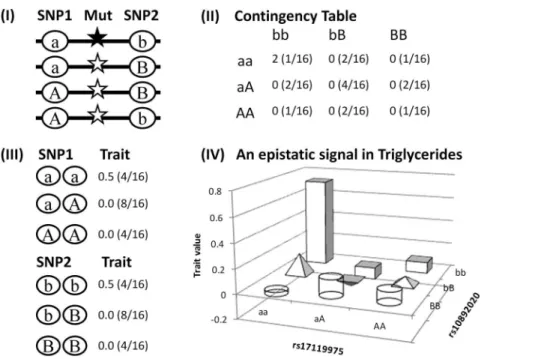
which do not reach genome-wide significance it is clear that local interactions comprised only a small proportion (,0.1%) of the total number of SNP pairs retained per trait in both cohorts (Table S3). However local interactions covered various regions across the genome and could be useful in identifying important loci including those missing from GWAS. To illustrate this point, we created a cartoon model describing a haplotype tagging a recessive causal variant can generate an apparent statistical interaction between two unlinked SNPs each with limited marginal effects under the assumption of Hardy-Weinberg Equilibrium (i.e. equal allele frequency of 0.5 for each SNP and equal haplotype frequency of 0.25 for the four possible haplotypes) (Figure 2). Under this model,
only individuals with theaabbgenotype (i.e. homozygous for the ab haplotype carrying the causal variant) show differentiated
phenotypes which leads to an apparent statistical interaction signal in a contingency table based test whereas conventional GWAS can not detect the causal variant from the associations with either SNP. The model resembled the interaction between rs17119975 and rs10892020 in TRI (Table 1) where both SNPs had limited marginal effects and their interaction signal mainly came from the double homozygous genotype (Figure 2). Several GWAS signifi-cant SNPs were identified between the epistatic pairs of SNPs (Table S2), indicating that local interactions can capture important marginal effects.
We computed LD for all the local interaction pairs in the two cohorts and plotted a histogram of the proportions of local interaction pairs in different LD bins (Figure 3). Clearly, the vast majority of local interactions had a low LD (r2,0.2) and only a few had r2.0.5 each with a generally moderate interaction signal (i.e. Pint,1.0E-06). Local interactions were distributed rather
evenly across the ranges of distances between two epistatic SNPs and most Pint values in ARIC were less than 1.0E-06 with only
0.2% with Pint,1.0E-08 (Figure S1).
The LD (r2) values of the four local interaction pairs for TRI in ARIC (Table 1) were also in the low range: rs17119975 – rs10892020 (0.44), rs3741298 – rs7396835 (0.05), rs3741298 –
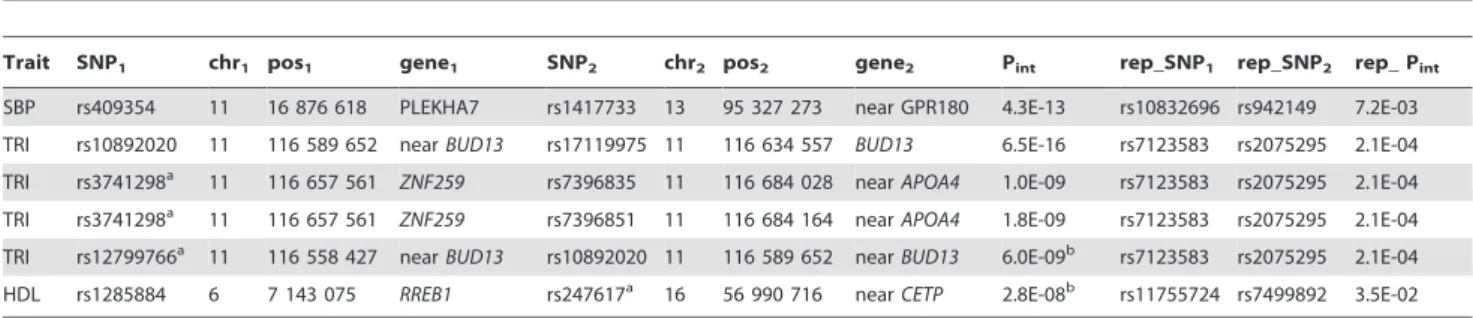
Table 1.Genome-wide significant epistatic pairs identified in the ARIC cohort and their replication in the NFBC199 cohort.*
Trait SNP1 chr1 pos1 gene1 SNP2 chr2 pos2 gene2 Pint rep_SNP1 rep_SNP2 rep_ Pint
SBP rs409354 11 16 876 618 PLEKHA7 rs1417733 13 95 327 273 near GPR180 4.3E-13 rs10832696 rs942149 7.2E-03
TRI rs10892020 11 116 589 652 nearBUD13 rs17119975 11 116 634 557 BUD13 6.5E-16 rs7123583 rs2075295 2.1E-04
TRI rs3741298a 11 116 657 561 ZNF259 rs7396835 11 116 684 028 nearAPOA4 1.0E-09 rs7123583 rs2075295 2.1E-04
TRI rs3741298a 11 116 657 561 ZNF259 rs7396851 11 116 684 164 nearAPOA4 1.8E-09 rs7123583 rs2075295 2.1E-04
TRI rs12799766a 11 116 558 427 nearBUD13 rs10892020 11 116 589 652 nearBUD13 6.0E-09b rs7123583 rs2075295 2.1E-04
HDL rs1285884 6 7 143 075 RREB1 rs247617a 16 56 990 716 nearCETP 2.8E-08b rs11755724 rs7499892 3.5E-02
*: genome-wide significant thresholds for interactions involving marginal SNPs were 2.1E-09 for TRI and 3.5E-09 for HDL; SNP1(SNP2), chr1(chr2), pos1(pos2), gene1 (gene2) – name, chromosome, position and mapped gene of the first (second) SNP; Pint– P value of the interaction test; rep_SNP1(rep_SNP2, rep_Pint) – the first (second, interaction P value) SNP of the best replicated pair;
a: the genome-wide significant single SNP with marginal effects; b: genome-wide suggestive.
doi:10.1371/journal.pone.0071203.t001
Figure 1. Differences in the numbers of SNP pairs with Pint,5.0E-08 and local interaction pairs (Pint,1.0E-05) detected in each trait between ARIC and NFBC1966.
rs7396851 (0.05) and rs12799766 – rs10892020 (0.40). We then aligned all local interactions within the 11q23.3 region associated with TRI in ARIC (including the four Table 1 pairs) and found they did not always overlap with each other (Figure 4A). Conditional tests of each of these local interactions by fitting the top marginal SNP rs964184 in the region (P = 2.5E-38, Table S2) as the background found the interactions in rs17119975 – rs10892020 and rs12799766 – rs10892020 disappeared
(Pint.0.05, thus the interactions were explained by the marginal
SNP) but the interactions in four SNP pairs remained significant (Pint,1.0E-02, thus the interactions were statistically
indepen-dent to the marginal SNP): rs3741298 – rs7396835 (or rs7396851) covering ZNF259 and APOA5, rs17092638 – rs3741298 and rs12799766 – rs4417316 covering BUD13and
ZNF259(Figure 4A). The same conditional tests of each of the remaining 13 marginal SNPs within the region for TRI (Table S2) found only rs6589567 with a P value (2.9E-02) less than 0.05, which located nearAPOA5and between the epistatic SNPs of the first two independent pairs (Figure 4A). Further conditional tests of each of the first two independent pairs by fitting rs6589567 as the background showed their interactions were also independent (Pintof 1.5E-07 and 2.4E-07 respectively)
to that SNP. In addition, we found two clusters of ENCODE regulatory elements [31] aligning to the 59 ends ofBUD13and
ZNF259 (Figure 4B) and captured by the independent pairs respectively. These results are consistent with the possibility that local interactions might tag at least two independent functional variants in the region.
The ANNOVAR [19] region-based annotation found that 63% of the local interaction SNP pairs in ARIC (61% in NFBC1966) mapped loci reported in previously published GWAS. These included nine loci that were genome-wide significant in the GWAS analyses in this study (Table 2, Table S2), of which onlyCETPfor HDL andBUD13–ZNF259–APOA5for TRI (Table 1) were the top GWAS loci in the individual traits studied, suggesting not all top GWAS loci (i.e. with the strongest marginal effects) were involved in local interactions. Interestingly, CETP was captured by local interactions in both cohorts; LPL and BUD13–ZNF259–APOA5 Figure 2. A cartoon model illustrating a haplotype tagging a recessive causal variant can generate an apparent statistical interaction between two unlinked SNPs each with limited marginal effects.(I) A recessive causative variant (black star) is associated with only theabSNP haplotype, assuming Hardy-Weinberg Equilibrium, i.e. an equal allele frequency of 0.5 for each SNP so there is no LD between the two SNPs and an equal frequency of 0.25 for each of the four possible haplotypes, and the causal variant with an effect size of 1. (II) Only individuals homozygous for this haplotype (ab/ab) are genetically differentiated generating apparent epistasis (averaged trait value and joint genotype frequency in the bracket in each cell). (III) Marginal effects associated with the individual SNPs are limited with only one in four individuals of theaaor
bbSNP genotype being affected with a trait value of 2 so the averaged trait value of the genotype is 0.5 (SNP genotype frequency in brackets), thus the individual SNPs may not be detected by a conventional GWAS. (IV) This resembles the interaction between rs17119975 and rs10892020 in TRI (Table 1) where neither SNP had important marginal effects and their interaction signal was mainly because of the differentiated phenotype associated with the double homozygousaabbgenotype.
doi:10.1371/journal.pone.0071203.g002
Figure 3. Proportions of local interactions in different LD ranges.
were captured in both HDL and TRI (Table 1) in ARIC. Most of these local interactions in Table 2 had some evidence of replication in the counterpart cohort (Pint,0.05) of which the
three pairs tagging LDLR and TOMM40 – APOE for LDL in ARIC and CETP for HDL in NFBC1966 respectively were significantly replicated.
Local interactions also pointed to GWAS loci that were missed in our GWAS analyses, including 24 each associated with one of the eight traits studied here and 49 each associated with a related trait (Table S4). These 73 loci, particularly the 49 could be considered as novel loci for our GWAS analyses of the eight traits. For example, in the 2q31.1-q24.3 region marked by local Figure 4. Local interactions (Pint,1.0E-05) within the 11q23.3 region associated with TRI in ARIC and supporting ENCODE regulatory evidence.(A) black oval: the top marginal SNP rs964184 within the region; each line representing an interaction between two SNPs at the start and end locations where red and blue lines represent interactions prior to and post conditional tests respectively; red and blue ovals: the marginal SNP rs6589567 prior to and post conditional test respectively; y axis: association P values in the2log10scale; x axis: genomic location in
base pair; arrow bar showing transcription direction and location of the gene (italic) below the bar. (B) a snapshot from UCSC genome browser showing clustered ENCODE regulatory elements aligning to the 59ends ofBUD13andZNF259respectively.
interactions in TRI, previous GWAS identified G6PC2, ABCB11
and LRP2 associated with various metabolic traits and other biochemical traits [32,33,34,35]; ERAP1 and a haplotype of
ERAP1 and ERAP2(5q15) marked by local interactions in CRP were reported to be associated with Ankylosing Spondylitis where CRP levels are considered as one of the clinical indicators of inflammatory activities of patients [36,37,38]; the CPS1 gene (2q34) marked by local interactions in DBP was previously found responsible for susceptibility to persistent pulmonary hypertension function [39,40]. Again, we found a number of local interaction regions showing pleiotropic effects in correlated traits, e.g.KLKB1
(4q35.2) andARL15(5q11.2) in HDL and TRI;CD34(1q32.2) and
MYO16(13q33.3) in DBP and SBP;VPS13C–C2CD4B(15q22.2),
ZFAND6(15q25.1) andWWOX(16q23.2-q23.1) in GLU and INS;
SYCP2L–ELOVL2 (6p24.2-p24.1) in LDL and CRP;CCDC92–
ZNF664(12q24.31) in LDL, CRP and DBP. In addition, we found the PCSK9 - USP24(1p32.3-p32.2) region was marked by local interactions in LDL in both the ARIC and NFBC1966 cohorts.
Discussion
Compared to the great success in GWAS, high throughput analysis of epistasis is both in its infancy and substantially more challenging in detection as well as interpretation. Indeed, as shown in this study, conventional GWAS identified genome-wide significant SNPs in multiple loci in five out of the eight traits studied in both cohorts that were relatively easy to replicate (Table S2), whereas significant epistasis signals were detected only in TRI and SBP in ARIC – one of the biggest GWAS cohorts and moderately replicated (significantly for the TRI signals) in NFBC1966. However, high throughput pair-wise genome scans enabled us to investigate the value of local interactions in identifying potentially important loci from sub-significant epistatic results. We showed that local interactions could capture loci with important marginal effects (e.g. via haplotypes) and were useful to better understand the genetic structures underlying such loci (i.e. the 11q23.3 region) as well as to identify 73 loci missing from the accompanying GWAS. Furthermore, it was possible to generate promising hypotheses about the regulatory mechanisms
underly-ing independent statistical signals of epistasis, via interrogation of ENCODE and other genomic sequence annotations. Our results suggest that studying epistasis is a potentially valuable complement to GWAS and can provide new insights into the biology of complex traits, particularly those (i.e. DBP, SBP and INS) where no significant signals were detected in the accompanying GWAS.
Low power of detection is the key issue in studying epistasis in single GWAS populations. We showed that in addition to sample size, SNP coverage was critical to power as it generates the detectable levels of LD required for epistasis detection and replication. The NFBC1966 cohort used a smaller sample size and a lower SNP coverage and this likely contributed to the many fewer epistatic SNP pairs than in ARIC based on the same criteria. Furthermore, in testing replication of the significant signals (Table 1) in NFBC1966 SNP proxies of the epistatic SNPs had to be used because the epistatic SNPs were not genotyped in that cohort, which likely reduced the chance of replication. Imputation could help improve statistical replication but in this case it would be recommended to accommodate population specific LD patterns owing to for example isolation in NFBC1966. Other factors (e.g. population structure, allele frequency variation and environmental factors) are also known to influence power [15]. For example, individuals in the NFBC1966 cohort were much younger (31 years old) than those in the ARIC cohort (45 to 64 years old) and thus had quite different metabolic profiles for the traits studied, which might have posed additional difficulty in detection and replication. Therefore, it would be worthwhile to further test replication of at least the significant signals in other cohorts with a good SNP coverage because they are pleiotropic and biologically meaningful. For example, the interaction betweenPLEKHA7and
GPR180for SBP (and DBP) may suggest an interesting model of blood pressure regulation, where PLEKHA7 is a GWAS locus associated with blood pressure [41] andGPR180 is a G protein-coupled receptor produced predominantly in vascular smooth muscle cells and may play an important role in the regulation of vascular remodelling [42] (Table 1). It has been shown that
PLEKHA7codes adherens junction proteins binding paracingulin
Table 2.Local interactions captured additional genome-wide significant loci identified in GWAS of the eight traits in ARIC and/or NFBC1966.*
Region gene Trait SNP1 pos1 SNP2 pos2 Pint LD (r2) rep_SNP1 rep_SNP2 rep_ Pint
2p24.1 APOB LDL rs427021 21451458 rs386397 21451827 9.5E-10 0.26 rs10206521 rs312046 1.9E-03
5q13.3 HMGCR LDL rs2006760 74562029 rs1559203 75449814 7.0E-06 0 rs6866661 rs10072459 1.1E-02
8p21.3 LPL HDL rs1441766 19862788 rs7461115 19871540 9.7E-07 0.22 rs894210 rs2410630 1.1E-02
8p21.3 LPL TRIb rs1441766 19862788 rs7013777 19878356 1.2E-06 0.23 rs10099160 rs10103634 1.0E-03
11q21-q14.3 MTNR1B GLU rs10765558 92493781 rs56247942 92999977 5.7E-06 0 rs505423 rs1374475 3.3E-03
11q23.3 ZNF259,APOA5 HDL rs3741298 116657561 rs7396835 116684028 1.8E-07 0.05 Nil Nil Nil
12q24.31 nearHNF1Aa CRP rs2708104 121483949 rs1718161 121627458 1.5E-06 0.00 rs11065408 rs2230912 3.4E-02
16q13 CETP HDL rs9989419c 56985139 rs12708980 57012379 5.6E-06 0.00 rs7499892 rs4784744 1.2E-02
16q13-q21 CETPa HDL rs9989419c 56985139 rs4783999 57651985 6.7E-06 0.03 rs2518054 rs12708990 4.5E-04
19p13.2 LDLR LDL rs12052058c 11159525 rs1799898 11227554 1.8E-06 0.10 rs11668477 rs2228671 2.6E-04
19q13.32 TOMM40, APOE LDL rs4803750c 45247627 rs4803759 45327459 4.4E-06 0.02 rs4803750 rs4803760 3.4E-04
*: SNP1(SNP2), pos1(pos2) – name and position the first (second) SNP; Pint– P value of the interaction test; rep_SNP1(rep_SNP2, rep_Pint) – the first (second, interaction P value) SNP of the best replicated pair; LD: r2linkage disequilibrium between two epistatic SNPs.
a: detected in NFBC1966 and test replication in ARIC; b: region shared in multiple traits;
regulating RhoA and Rac1 activities [43] which may involve various G protein-coupled receptors includingGPR180.
Using a high density SNP chip for GWAS genotyping would mean even more stringent genome-wide significance thresholds based on Bonferroni adjustment and thus a further reduction of the power of detection of epistasis. Such Bonferroni adjusted thresholds can hardly remain practical as many more SNPs derived from the increasingly popular sequencing studies are used as input to future GWAS. There is a clear need for the community to define consensus genome-wide significance thresholds for future epistasis studies. A recent effort based on Illumina’s HumanHap 550 bead SNP chip and Monte Carlo simulations has made a good progress towards this goal and suggests that an adjustment of 44% of the total number of pair-wise tests is appropriate to avoid using an overly stringent threshold [44]. To fully achieve the goal further work is needed to examine the impact of SNP density and other factors (e.g. sample size) on the correlation structure underlying billions pair-wise tests in studying epistasis in GWAS.
Our local interaction results provide fresh evidence supporting the hypothesis that some genetic variations in complex traits may be captured by epistasis between neighbouring SNPs [22] and shed light on a new search path for variants missing from GWAS based on a more relaxed threshold than the genome-wide thresholds derived by Bonferroni adjustment. We showed clearly that local interactions were not driven by high LD between a pair of SNPs (Figure 3) but more likely by haplotypes of SNPs in low LD or unlinked as we previously predicted [12]. Local interaction pairs reserve the usual interpretation of haplotypes, i.e. physical coupling of alleles on the DNA strand inherited from a single parent [26], but the alleles are unlinked or weakly linked and thus may be more powerful than single SNPs particularly when the genotyped SNPs are not in high LD with a causal variant tagged by haplotypes (Figure 2).
Previously we argued that it was unlikely to be able to distinguish a marginal signal captured by a haplotype from a genuine local interaction using statistical approaches alone [12], i.e. fitting the marginal signal could largely diminish the local interaction signal. In the 11q23.3 region example (Figure 4), fitting the top marginal SNP did remove the signal of the top local interaction pair but not the signals of the four independent pairs coinciding with ENCODE evidence of regulatory elements aligning to the 59ends ofBUD13andZNF259respectively. From a statistical viewpoint one may conclude that the top local interaction pair probably captured a marginal signal without interaction but the independent pairs could be real interactions. However, the mechanisms underlying these local interactions could be complicated. For example, the marginal signal captured by the top pair, if true, may also remove the interaction signals of two independent pairs overlapped the region marked by the top pair (Figure 4). Follow-up functional studies are needed to find out whether these local interactions are real or simply capture functional variants without interactions. In addition, our results indicating pleiotropic epistatic signals suggest that analysing multiple related traits together may be a useful approach to uncover functionally important loci, which also requires further investigation in the future.
Materials and Methods
Study cohorts and ethics statement
This study was approved by the institutional review board of the West of Scotland Research Ethics Service of NHS in the UK. The GWAS data of both the NFBC1966 and ARIC studies were provided by the NIH Database of Genotype and Phenotype via
specific Data Use Certifications issued by the Data Access Committee of the National Heart, Lung and Blood Institute. Both studies have been described in detail elsewhere [29,30]. Briefly, the NFBC1966 study cohort recruited subjects born in two Northern Finland provinces (i.e. Oulu and Lapland) in 1966 and was approved by the Ethical Committee of the Northern Ostrobothnia Hospital District and all participants gave written informed consent. At the age of 31 each subject provided fasting blood samples for evaluation of the metabolic measures and was genotyped with Illumina Infinium 370cnvDuo array and assessed for blood pressure and other traits [30]. The ARIC study cohort recruited adults aged 45 to 64 years from four US communities in 1987–89 each was genotyped with Genome-Wide Human SNP Array 6.0 and underwent baseline exami-nation and fasting blood sample tests and follow-up examina-tions and tests in approximately every three years in four field centres. The ARIC study was approved by the institutional review board of each field centre institute and all participants gave written informed consent in accordance with the Decla-ration of Helsinki [29], where only subjects of European descent were considered in this study.
In both cohorts, a standard procedure was used to measure height, weight, sitting SBP and DBP for each participant; lipid traits (i.e. HDL, LDL and TRI) were measured using standard enzymatic methods [29,30]. In NFBC1966, CRP, GLU and INS were analyzed using immunoenzymometric assay (Medix Bio-chemica), a glucose dehydrogenase method (Granutest 250, Diagnostica Merck) and radioimmunoassay (Pharmacia Diagnos-tics) respectively [30]. In ARIC, serum CRP, GLU and INS were assessed using the immunoturbidimetric CRP-Latex (II) high-sensitivity assay from Denka Seiken (Tokyo, Japan) [28], a hexokinase/glucose-6-phosphate dehydrogenase method on a Coulter DACOS device (Beckman Coulter, Fullerton, CA) and radioimmunoassay (125Insulin kit; Cambridge Medical Diagnosis, Bilerica, MA) [45], respectively.
Subjects were excluded from the analysis of each individual trait if matching the phenotypic exclusion criteria defined in the original GWAS of NFBC1966 [30]: had missing values of phenotypes or covariates detailed below (all traits); used diabetic medication or gave blood samples without fasting (GLU, HDL, INS, LDL, TRI); were diabetic or pregnant or phenotypic values were in excess of three standard deviations from the mean (GLU, INS). Most of the traits in ARIC used in this study were measured at the first visit except that CRP was measured at the fourth visit because the sample sizes in previous visits were fairly small. Relevant covariates for CRP were all based on the fourth visit.
Statistical analysis
In NFBC1966 each trait was adjusted for gender, oral contraception and pregnancy. In ARIC, each trait was adjusted for gender, age, oral contraception and field centre; the three lipid traits (i.e. HDL, LDL and TRI) were also adjusted for two additional effects: taking of cholesterol-lowering medication within two weeks of the visit and taking of medications that secondarily affect cholesterol. After adjustment for covariates, each trait was normalised using the GenABEL rntransform
function and then adjusted for relatedness and the first ten principal components using the GenABEL polygenic function, and the resultant environmental residuals (i.e.pgresidualY) were used as the actual trait values to test for association [47]. The polygenic heritability was also calculated for each trait at this stage and these are shown in Table S1.
Conventional GWAS analyses (i.e. assuming additive effects only) of each trait in each cohort were conducted using the GenABELmmscorefunction and the consensus threshold (P = 5.0E-08) [27] was applied to declare a SNP with genome-wide significant marginal effects. The inflation factors (computed by regression of observed association P values against the expected) in each genome scan were all between 1 and 1.03, suggesting relatedness among individuals and potential population stratifica-tion in each cohort were well accounted for. BiForce was used to perform full pair-wise genome scans for each trait in each cohort and retained SNP pairs with an interaction P value (Pint) less than
1.0E-05. Bonferroni adjusted thresholds as previously defined [12] were used to identify genome-wide significant epistatic SNP pairs. GivenNto be the total number of SNPs with K(K.0) marginal SNPs detected in the conventional GWAS, the 5% genome-wide thresholds were derived as P = 0.05/(N6(N–1)/2-(N–1)6K)) for a full pair-wise genome scan (i.e. 9.5E-13 and 3.8E-13 in NFBC1966 and ARIC respectively) and P = 0.05/((N–1)6K) for interactions
involving at least one marginal SNP (i.e. 1.5E-07 and 9.7E-08 ifK
is 1 in NFBC1966 and ARIC respectively).
Identified epistatic SNP pairs were tested for replication in independent samples at the SNP and/or region levels following our previous protocol [15] to accommodate the issues of different SNP coverage and LD patterns across study cohorts. The SNP level replication is possible only if both SNPs of an epistatic pair were genotyped in the independent samples and considered significant if the P value of the interaction between the two SNPs exceeded the 5% nominal threshold in independent samples. The region level replication tested interactions between each of ten adjacent SNPs (i.e., five upstream and five downstream) of the two SNPs involved in the epistatic interaction and used the 5% thresholds derived from permutation (i.e. permute the phenotypes and test all pair-wise interactions within the region 1000 times) to declare significance of the best replicate SNP pair, i.e. the pair of SNPs with the lowest Pintvalue. If either SNP of an epistatic pair
was not genotyped in the independent samples, the nearest SNP was chosen as its proxy to perform the region level replication tests for the pair.
The detection of local interactions may be substantially affected by LD patterns varying across the genome and thus require a different threshold to declare significance. We used permutation of the TRI trait in the ARIC cohort as an example to investigate such a threshold based on a window of 41 SNPs on the same chromosome (i.e. 20 upstream and 20 downstream of a SNP randomly sampled from the genome), which may not necessarily mark a region in exactly one million base pairs but capture the LD pattern within the region and with a fixed number of tests. For each randomly sampled SNP, we iteratively permuted the
phenotypes and tested interactions of every pair-wise combination of SNPs within the window 100 times and recorded the lowest Pint
value in each iteration to derive the 5% Pintvalue. We randomly
sampled 200 SNPs from the genome and calculated the average of the derived 5% Pintvalues as the threshold as 1.3E-04, which was
indeed less stringent than 6.1E-05 based on the Bonferroni adjustment (i.e. 0.05/(41*40/2)) or 1.0E-05 used to retain epistatic SNP pairs during the BiForce scans. The permutation derived threshold was based on one region at a time that was not adjusted for the total number of local interaction regions in the genome which is unknown in advance. For simplicity, we used 1.0E-05 as the threshold to declare local interactions in this study.
All SNP positions were based on the current human genome build (UCSC hg19/NCBI 37.3). Local interactions were extracted from the retained epistatic pairs if both SNPs located on the same chromosome and within a distance less than 1 Mb (i.e. Pint,
1.0E-05) and their LD values were calculated. The functional annotation tool ANNOVAR [19] was used to map local interactions to loci reported in GWAS Catalog [48], where we identified each GWAS locus located within a genomic region bounded by the two SNPs of a local interaction SNP pair. ANNOVAR was also used to map SNPs to genes using a window of 20 kilobases upstream and 20 kilobases downstream of the SNP. The RegulomeDB [18,49] and UCSC Genome Browser (http:// genome.ucsc.edu/) were used to search for regulatory elements published by the ENCODE project [31].
Supporting Information
Figure S1 Distributions of local interactions in different ranges of interaction P values or distances between a pair of SNPs. (TIF)
Table S1 Summary of the eight metabolic traits in ARIC and NFBC1966.
(XLSX)
Table S2 Genome-wide significant single SNPs in ARIC and NFBC1966.
(XLSX)
Table S3 Profiling epistatic SNP pairs detected in eight metabolic traits in ARIC and NFBC1966.
(XLSX)
Table S4 Local interactions tag GWAS loci identified from external studies of the same or highly related traits.
(XLSX)
Acknowledgments
We thank the editor and anonymous reviewers for their valuable suggestions and comments. We are grateful for assistance from Dr. Kai Wang at the Zilkha Neurogenetic Institute, USA. We acknowledge data access to the Northern Finland Birth Cohort 1966 (NFBC1966) study (phs000276.v1.p1) and the Atherosclerosis Risk in Communities (ARIC) study (phs000090.v1.p1) granted by the National Heart, Lung, and Blood Institute (NHLBI) Data Access Committee via Database of Genotypes and Phenotypes (http://www.ncbi.nlm.nih.gov/gap). The authors thank the staff and participants of the NFBC1966 and ARIC studies for their important contributions.
Author Contributions
References
1. Breen MS, Kemena C, Vlasov PK, Notredame C, Kondrashov FA (2012) Epistasis as the primary factor in molecular evolution. Nature 490: 535–538. 2. Huang W, Richards S, Carbone MA, Zhu D, Anholt RR, et al. (2012) Epistasis
dominates the genetic architecture of Drosophila quantitative traits. Proc Natl Acad Sci U S A 109: 15553–15559.
3. Zuk O, Hechter E, Sunyaev SR, Lander ES (2012) The mystery of missing heritability: Genetic interactions create phantom heritability. Proceedings of the National Academy of Sciences 109: 1193–1198.
4. Gyenesei A, Moody J, Laiho A, Semple CAM, Haley CS, et al. (2012) BiForce Toolbox: powerful high-throughput computational analysis of gene-gene interactions in genome-wide association studies. Nucleic Acids Research 40: W628–W632.
5. Liu Y, Xu H, Chen S, Chen X, Zhang Z, et al. (2011) Genome-Wide Interaction-Based Association Analysis Identified Multiple New Susceptibility Loci for Common Diseases. PLoS Genet 7: e1001338.
6. Ma L, Brautbar A, Boerwinkle E, Sing CF, Clark AG, et al. (2012) Knowledge-Driven Analysis Identifies a Gene-Gene Interaction Affecting High-Density Lipoprotein Cholesterol Levels in Multi-Ethnic Populations. PLoS Genet 8: e1002714.
7. Schupbach T, Xenarios I, Bergmann S, Kapur K (2010) FastEpistasis: a high performance computing solution for quantitative trait epistasis. Bioinformatics 26: 1468–1469.
8. Yung LS, Yang C, Wan X, Yu W (2011) GBOOST: a GPU-based tool for detecting gene-gene interactions in genome-wide case control studies. Bioinfor-matics 27: 1309–1310.
9. Becker J, Wendland JR, Haenisch B, Nothen MM, Schumacher J (2012) A systematic eQTL study of cis-trans epistasis in 210 HapMap individuals. Eur J Hum Genet 20: 97–101.
10. Lappalainen T, Montgomery SB, Nica Alexandra C, Dermitzakis Emmanouil T (2011) Epistatic Selection between Coding and Regulatory Variation in Human Evolution and Disease. The American Journal of Human Genetics 89: 459–463. 11. Turnbull C, Seal S, Renwick A, Warren-Perry M, Hughes D, et al. (2012) Gene-gene interactions in breast cancer susceptibility. Hum Mol Genet 21: 958–962. 12. Gyenesei A, Moody J, Semple CA, Haley CS, Wei WH (2012) High throughput analysis of epistasis in genome-wide association studies with BiForce. Bioinfor-matics 28: 1957–1964.
13. Cordell HJ (2009) Detecting gene-gene interactions that underlie human diseases. Nat Rev Genet 10: 392–404.
14. Gauderman WJ (2002) Sample size requirements for association studies of gene-gene interaction. Am J Epidemiol 155: 478–484.
15. Wei W, Hemani G, Gyenesei A, Vitart V, Navarro P, et al. (2012) Genome-wide analysis of epistasis in body mass index using multiple human populations. Eur J Hum Genet 20: 857–862.
16. Wei W, Hemani G, Hicks AA, Vitart V, Cabrera-Cardenas C, et al. (2011) Characterisation of Genome-Wide Association Epistasis Signals for Serum Uric Acid in Human Population Isolates. PLoS One 6: e23836.
17. Hemani G, Knott S, Haley C (2013) An Evolutionary Perspective on Epistasis and the Missing Heritability. PLoS Genet 9: e1003295.
18. Schaub MA, Boyle AP, Kundaje A, Batzoglou S, Snyder M (2012) Linking disease associations with regulatory information in the human genome. Genome Res 22: 1748–1759.
19. Wang K, Li M, Hakonarson H (2010) ANNOVAR: functional annotation of genetic variants from high-throughput sequencing data. Nucleic Acids Research 38: e164–e164.
20. Emily M, Mailund T, Hein J, Schauser L, Schierup MH (2009) Using biological networks to search for interacting loci in genome-wide association studies. Eur J Hum Genet 17: 1231–1240.
21. Turner SD, Berg RL, Linneman JG, Peissig PL, Crawford DC, et al. (2011) Knowledge-Driven Multi-Locus Analysis Reveals Gene-Gene Interactions Influencing HDL Cholesterol Level in Two Independent EMR-Linked Biobanks. PLoS ONE 6: e19586.
22. Haig D (2011) Does heritability hide in epistasis between linked SNPs? Eur J Hum Genet 19: 123–123.
23. Kettunen J, Tukiainen T, Sarin A-P, Ortega-Alonso A, Tikkanen E, et al. (2012) Genome-wide association study identifies multiple loci influencing human serum metabolite levels. Nat Genet 44: 269–276.
24. Middelberg RP, Ferreira MA, Henders AK, Heath AC, Madden PA, et al. (2011) Genetic variants in LPL, OASL and TOMM40/APOE-C1-C2-C4 genes are associated with multiple cardiovascular-related traits. BMC Med Genet 12: 123.
25. Snitkin ES, Segre` D (2011) Epistatic Interaction Maps Relative to Multiple Metabolic Phenotypes. PLoS Genet 7: e1001294.
26. Ueki M, Cordell HJ (2012) Improved Statistics for Genome-Wide Interaction Analysis. PLoS Genet 8: e1002625.
27. McCarthy MI, Abecasis GR, Cardon LR, Goldstein DB, Little J, et al. (2008) Genome-wide association studies for complex traits: consensus, uncertainty and challenges. Nat Rev Genet 9: 356–369.
28. Dehghan A, Dupuis Je, Barbalic M, Bis JC, Eiriksdottir G, et al. (2011) Meta-Analysis of Genome-Wide Association Studies in.80 000 Subjects Identifies Multiple Loci for C-Reactive Protein Levels/Clinical Perspective. Circulation 123: 731–738.
29. Dumitrescu L, Carty CL, Taylor K, Schumacher FR, Hindorff LA, et al. (2011) Genetic Determinants of Lipid Traits in Diverse Populations from the Population Architecture using Genomics and Epidemiology (PAGE) Study. PLoS Genet 7: e1002138.
30. Sabatti C, Service SK, Hartikainen AL, Pouta A, Ripatti S, et al. (2009) Genome-wide association analysis of metabolic traits in a birth cohort from a founder population. Nat Genet 41: 35–46.
31. Gerstein MB, Kundaje A, Hariharan M, Landt SG, Yan K-K, et al. (2012) Architecture of the human regulatory network derived from ENCODE data. Nature 489: 91–100.
32. Chambers JC, Zhang W, Sehmi J, Li X, Wass MN, et al. (2011) Genome-wide association study identifies loci influencing concentrations of liver enzymes in plasma. Nat Genet 43: 1131–1138.
33. Kamatani Y, Matsuda K, Okada Y, Kubo M, Hosono N, et al. (2010) Genome-wide association study of hematological and biochemical traits in a Japanese population. Nat Genet 42: 210–215.
34. Kraja AT, Vaidya D, Pankow JS, Goodarzi MO, Assimes TL, et al. (2011) A bivariate genome-wide approach to metabolic syndrome: STAMPEED consortium. Diabetes 60: 1329–1339.
35. Soranzo N, Sanna S, Wheeler E, Gieger C, Radke D, et al. (2010) Common variants at 10 genomic loci influence hemoglobin A(1)(C) levels via glycemic and nonglycemic pathways. Diabetes 59: 3229–3239.
36. Haroon N, Tsui FW, Chiu B, Tsui HW, Inman RD (2010) Serum cytokine receptors in ankylosing spondylitis: relationship to inflammatory markers and endoplasmic reticulum aminopeptidase polymorphisms. J Rheumatol 37: 1907– 1910.
37. Tsui FW, Haroon N, Reveille JD, Rahman P, Chiu B, et al. (2010) Association of an ERAP1 ERAP2 haplotype with familial ankylosing spondylitis. Ann Rheum Dis 69: 733–736.
38. Wang CM, Ho HH, Chang SW, Wu YJ, Lin JC, et al. (2012) ERAP1 genetic variations associated with HLA-B27 interaction and disease severity of syndesmophytes formation in Taiwanese ankylosing spondylitis. Arthritis Res Ther 14: R125.
39. Pearson DL, Dawling S, Walsh WF, Haines JL, Christman BW, et al. (2001) Neonatal pulmonary hypertension–urea-cycle intermediates, nitric oxide production, and carbamoyl-phosphate synthetase function. N Engl J Med 344: 1832–1838.
40. Summar ML, Gainer JV, Pretorius M, Malave H, Harris S, et al. (2004) Relationship between carbamoyl-phosphate synthetase genotype and systemic vascular function. Hypertension 43: 186–191.
41. Levy D, Ehret GB, Rice K, Verwoert GC, Launer LJ, et al. (2009) Genome-wide association study of blood pressure and hypertension. Nat Genet 41: 677– 687.
42. Iida A, Tanaka T, Nakamura Y (2003) High-density SNP map of human ITR, a gene associated with vascular remodeling. J Hum Genet 48: 170–172. 43. Pulimeno P, Paschoud S, Citi S (2011) A role for ZO-1 and PLEKHA7 in
recruiting paracingulin to tight and adherens junctions of epithelial cells. J Biol Chem 286: 16743–16750.
44. Becker T, Herold C, Meesters C, Mattheisen M, Baur MP (2011) Significance levels in genome-wide interaction analysis (GWIA). Ann Hum Genet 75: 29–35. 45. Schroeder EB, Chambless LE, Liao D, Prineas RJ, Evans GW, et al. (2005) Diabetes, Glucose, Insulin, and Heart Rate Variability: The Atherosclerosis Risk in Communities (ARIC) study. Diabetes Care 28: 668–674.
46. Aulchenko YS, Ripke S, Isaacs A, van Duijn CM (2007) GenABEL: an R library for genome-wide association analysis. Bioinformatics 23: 1294–1296. 47. Aulchenko YS, de Koning DJ, Haley C (2007) Genomewide rapid association
using mixed model and regression: a fast and simple method for genomewide pedigree-based quantitative trait loci association analysis. Genetics 177: 577– 585.
48. Hindorff LA, Sethupathy P, Junkins HA, Ramos EM, Mehta JP, et al. (2009) Potential etiologic and functional implications of genome-wide association loci for human diseases and traits. Proc Natl Acad Sci U S A 106: 9362–9367. 49. Boyle AP, Hong EL, Hariharan M, Cheng Y, Schaub MA, et al. (2012)