www.atmos-chem-phys.org/acp/3/315/
Chemistry
and Physics
The isotopic fingerprint of the pre-industrial and the anthropogenic
N
2
O source
T. R¨ockmann1, J. Kaiser1, 3, and C. A. M. Brenninkmeijer2
1Max Planck Institute for Nuclear Physics, Atmospheric Physics Division, Heidelberg, Germany 2Max Planck Institute for Chemistry, Air Chemistry Division, Mainz, Germany
3now at: Department of Geosciences, Princeton University, Princeton, USA
Received: 21 August 2002 – Published in Atmos. Chem. Phys. Discuss.: 13 November 2002 Revised: 8 February 2003 – Accepted: 26 February 2003 – Published: 21 March 2003
Abstract.We have performed high-precision measurements of the 18O and position dependent 15N isotopic composi-tion of N2O from Antarctic firn air samples. By comparing these data to simulations carried out with a firn air diffusion model, we have reconstructed the temporal evolution of the N2O isotope signatures since pre-industrial times. The heavy isotope content of atmospheric N2O is presently decreasing for all signatures at rates of about−0.038‰ yr−1for1δ15N,
−0.046‰ yr−1for2δ15N and−0.025‰ yr−1forδ18O. The total decrease since pre-industrial times is estimated to be about −1.8‰ for 1δ15N, −2.2‰ for 2δ15N and −1.2‰ for δ18O. Isotope budget calculations using these trends and recent stratospheric measurements allow to isotopically characterize the present and the pre-industrial global aver-age N2O source, as well as the additional N2O emissions that have caused the global N2O increase since pre-industrial times. The increased fluxes from the depleted surface sources alone are insufficient to explain the inferred temporal isotope changes. In addition, the global average N2O source signa-ture is calculated to be significantly depleted today relative to the pre-industrial value, in agreement with recent indications from soil emission measurements.
1 Introduction
Nitrous oxide (N2O) belongs to the group of greenhouse gases targeted by the Kyoto protocol for emission reduc-tion. A prerequisite for effective control measures is a thor-ough understanding of the global atmospheric budget. In the case of N2O, it is known that the predominant sources are microbial nitrification and denitrification reactions in soils and waters. Minor contributions come from biomass burn-ing and industry, in particular nitric acid and nylon
produc-Correspondence to:T. R¨ockmann ([email protected])
tion, and combustion in vehicles and power plants. However, the knowledge about individual source strengths is poor and lacks experimental verification. Measurements of the stable isotopic composition of atmospheric N2O are increasingly considered to be an important method for better quantifica-tion of its global budget, and accordingly a wealth of exper-imental and modeling studies have investigated various as-pects of the isotopic composition of N2O in the past years (Cliff and Thiemens, 1997; Dore et al., 1998; Griffith et al., 2000; Johnson et al., 2001; Kaiser et al., 2002a, b, c; Naqvi et al., 1998; Rahn and Wahlen, 2000; Rahn et al., 1998; R¨ockmann et al., 2000, 2001a, b; Toyoda et al., 2001; Turatti et al., 2000; Yoshida and Toyoda, 2000; Yung and Miller, 1997). Underlying this effort is the notion that the increase of N2O from pre-industrial to present levels should have left a signal in the isotopic composition. The tempo-ral isotope trends predicted by model simulations, however, are only a few hundredths of a per mill per year (Rahn and Wahlen, 2000). Therefore, the experimental determination of a recent isotope trend from direct atmospheric measurements has not been accomplished so far, and the models themselves can only use assumptions about the temporal evolution of the N2O isotope signatures.
scenarios as input data and then calculates the firn profile at the time of the sampling. The most reliable input scenario can be chosen based on the agreement of the measured and modeled profiles.
In this paper, we reconstruct the isotopic evolution of at-mospheric N2O since pre-industrial times, assuming that the general shape of the time series is similar to results from a recent model study (Rahn and Wahlen, 2000). In addition to the difference between present and pre-industrial atmo-spheric isotope values, we could also precisely quantify the small present isotope trends that have not been measurable directly in the atmosphere. Global budget calculations are then used to derive the global average isotope signatures of the present and pre-industrial N2O emissions and, by mass balance, also the source signatures of the additional emis-sions since pre-industrial times. In the following, we term this contribution “anthropogenic” although also changes in natural emissions, e.g. due to climatic changes, may have contributed. In this respect, we establish five important cor-nerstones for future isotope research on atmospheric N2O, namely the difference between present and pre-industrial atmospheric N2O isotope values, the present atmospheric trends, and the present, pre-industrial and anthropogenic av-erage source signatures.
2 Experimental procedures
Within the framework of the European Project FIRETRACC (Firn Record of Trace Gases Relevant to Atmospheric Chem-ical Change), 16 large volume air samples were obtained in Dronning Maud Land (DML) in January 1998, and 13 sam-ples were obtained at Dome Concordia (Dome C) in January 1999. In the laboratory, N2O mixing ratios were determined gas chromatographically using an electron capture detector (GC-ECD). Two laboratory reference gases were used with N2O mixing ratios of nominally 315.71 nmol/mol and 309.85 nmol/mol, respectively, on the NOAA/CMDL scale. The non-linearity of the detector was accounted for by fitting the response function to a dilution series. The DML samples were analyzed three times, two times in 1998 after arrival in the laboratory, shortly after the GC-ECD had been set up, and again in 1999 together with the Dome C samples after improvement of the system. Whereas the internal (i.e. in-strumental) precision is similar for the individual analyses, the reduced scatter of the 1999 data (Fig. 1) indicates that these data are more reliable, although the air had been stored in the cylinders for more than one year. This may be due to improvements in sample handling and admission procedures. The minor differences do not affect any of the conclusions drawn below.
The18O and position dependent15N analyses were carried out using recently developed continuous-flow isotope mass spectrometric techniques (Brenninkmeijer and R¨ockmann, 1999; R¨ockmann et al., 2001a). The Dome C samples were
analyzed in the same manner that was used previously for stratospheric samples (R¨ockmann et al., 2001a) and only a brief summary is given here. 170 to 420 cm3of firn air were introduced into a modified ThermoFinnigan PreCon system, where the majority of the CO2is chemically removed over Ascarite (NaOH coated silica) and the N2O is preconcen-trated cryogenically. Final separation from the remaining traces of CO2occurs on a capillary GC column (PoraPlot, 0.32 mm i.d., 25 m) after focusing the sample on the col-umn head. In our new setup the colcol-umn is divided into a precolumn and an analytical column, which considerably re-duces interferences from other atmospheric compounds, in particular on mass 31 for the NO+fragment (R¨ockmann et
al., 2003). Two consecutive runs are performed, the conven-tional N2O measurement collecting the ion masses 44, 45 and 46, and the NO+ fragment measurement at masses 30
and 31 (Brenninkmeijer and R¨ockmann, 1999; R¨ockmann et al., 2001a). As sample size was no restriction for the large firn air samples, many measurements were performed on each sample (up to 10), resulting in very precise and robust results. As laboratory reference gas we use an at-mospheric air sample with an N2O mixing ratio of 315.1 nmol/mol and isotope ratios of δ15N = 6.7‰ vs. atmo-spheric N2andδ18O = 44.6‰ vs. VSMOW (Vienna Stan-dard Mean Ocean Water). The mass spectrometer running gas (N2O, purity 99.9999%) has an isotopic composition of δ15N = 0.4‰ vs. atmospheric N2 andδ18O = 39.1‰ vs. VSMOW.
For the DML samples, the original air samples were ex-hausted, but the condensable components (primarily CO2, N2O and hydrocarbons) had been recovered during previ-ous large volume (∼400 dm3) extractions on an offline lab-oratory extraction line used for CO isotope measurements (Brenninkmeijer et al., 2001). Aliquots of these condens-able trace gas cocktails were introduced into the extraction system on a modified ThermoFinnigan Gasbench setup. The concentrate was purged by a helium carrier gas into a sam-ple loop using a double-hole needle, and the contents of the loop was then injected into the extraction unit, which again consisted of a chemical CO2trap and cryogenic preconcen-tration of the N2O, followed by GC separation as described above. Sample sizes injected were similar to those from the whole air extractions. Details of this method will be pub-lished elsewhere (R¨ockmann et al., 2003).
3 Results and discussion of firn air analyses
The firn air profiles from Dronning Maud Land (DML) and Dome Concordia (Dome C), for all signatures are shown in Fig. 1. DML has a mean annual temperature of−38◦
C and a relatively high snow accumulation rate of 60 kg m−2yr−1 (6 cm water equivalent yr−1) whereas Dome C is an ex-tremely cold site (−53◦C) with a low snow accumulation rate
lo-290 300 310 320 100
80 60 40 20 0
280 290 300 310 320
80 60 40 20 0
0.0 0.5 1.0 1.5 2.0 2.5
0.0 0.5 1.0 1.5 2.0 2.5
0.0 0.5 1.0 1.5 2.0 2.5
0.0 0.5 1.0 1.5 2.0 2.5 80 60 40 20 0
DOME C
dep
th
(m)
N2O (nmol/mol)
0.0 0.5 1.0 1.5 2.0 2.5
δ15 N (‰)
0.0 0.5 1.0 1.5 2.0 2.5
δ18 O (‰)
0.0 0.5 1.0 1.5 2.0 2.5 1
δ15 N (‰)
0.0 0.5 1.0 1.5 2.0 2.5 100 80 60 40 20 0
2δ15
N (‰) DML
dep
th
(m)
N2O (nmol/mol)
δ15 N (‰)
δ18 O (‰)
1
δ15 N (‰)
2δ15
N (‰)
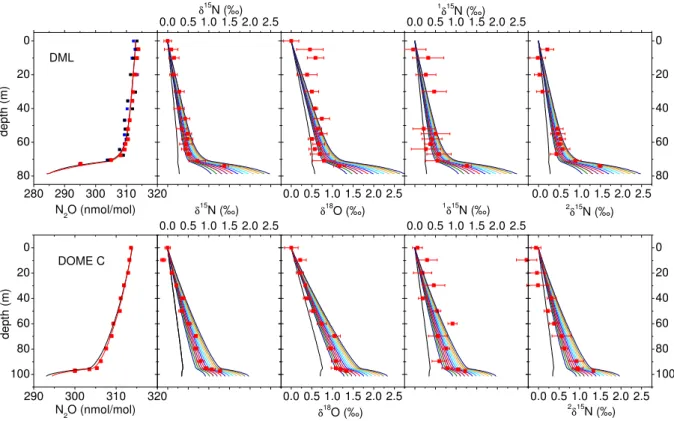
Fig. 1. Depth profiles of N2O mixing ratio and isotopic composition at two Antarctic sites, Dronning Maud Land (top) and Dome C, together with the results from the firn air diffusion model. In the top left panel, the results of all three measurement series are presented, the black and blue squares designate the 1998 measurements, and the red squares the 1999 measurements that were carried out together with the Dome C samples. For N2O mixing ratios, the black line is the model result using the scenario based on ice, South pole firn and atmospheric measurements, the red line is the result using the exponential model scenario (see text). The isotope ratios are reported relative to the contemporary isotopic composition at the sampling sites.1δ15N and2δ15N are the15Nδ-values at the terminal and central position in the molecule, respectively (Brenninkmeijer and R¨ockmann, 1999). The trends are in good agreement to those reported recently from South Pole firn air (Sowers et al., 2001). The lines are results from the firn model using the scenarios shown in Fig. 2 as input (the colors for the scenarios match those from Fig. 2). For the isotope ratios, the black lines are profiles for a scenario without any change in isotopic composition since pre-industrial times.
cated at about 73.5 m, compared to about 99.5 m at Dome C. Although the firn-ice transition is located at shallower depth at DML, the mean age for the sample from greatest depth is actually larger than at Dome C. Furthermore, the age distri-butions for a certain depth level (not shown) at Dome C are broader than those at DML.
It is evident that N2O mixing ratios decrease with depth, in accordance with the atmospheric evolution, whereas the iso-tope ratios increase with depth, already indicating that N2O has become isotopically more depleted since pre-industrial times. However, as mentioned above, the raw data from the firn air measurements do not represent the actual history of the atmospheric composition due to the complicating effects of gravitational separation and diffusion. A forward firn air diffusion model has been used to calculate firn air profiles of N2O mixing and isotope ratios based on model scenarios for the atmospheric evolution. The diffusivity profile used is the one calculated for CO2for this site, which is reason-able because both gases exhibit a similar quasi-exponential
increase in mixing ratio and have similar molecular prop-erties. The slightly different diffusion coefficient for N2O relative to CO2(D(N2O)=1.004D(CO2) Trudinger et al., 1997) has been taken into account.
1700 1800 1900 2000 0.0 0.5 1.0 1.5 2.0 2.5 3.0
10
1 5
δ
val
u
e
(‰
)
year 270
280 290 300 310 320
N
2
O
mix
in
g
ra
ti
o
(n
mo
l/mo
l)
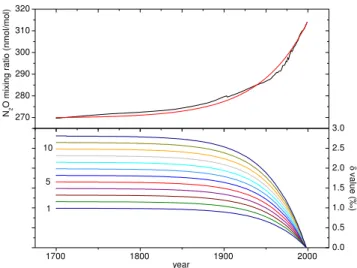
Fig. 2.Scenarios for the past evolution of atmospheric N2O mixing and isotope ratios as used in the model. The black N2O time series is an interpolation of a Monte-Carlo simulation based reconstruc-tion from ice core and firn data as well as direct observareconstruc-tions (see text). The red line is an exponential model matching the observed present rate of change and the pre-industrial and present mixing ratios. The isotope scenarios are based on the “depleted ocean” scenario (red line, number 5) from Rahn and Wahlen (2000). The whole range of scenarios is created by scaling the time series for the “depleted ocean” scenario up and down in steps of 10% of the total difference between the present and pre-industrial values. For reference, the isotope scenarios are numbered from bottom to top as number 1 through 12.
arise from adopting the same diffusivity profile for N2O and CO2if, for example, interactions between the trace gas and the firn play a role. We note that CO2 is more soluble in water than N2O, but such an effect should be more impor-tant at the warmer DML site. Hence, the origin of the small deviation is not yet understood, but the obtained agreement between model and observations is satisfactory. The expo-nential model actually matches the data better than the one based on the ice core measurements, which could also mean that the South pole firn air profile (Battle et al., 1996) used for the construction of the atmospheric scenarios in the relevant time span disagrees with the Dome C profile.
For the isotope ratios, atmospheric scenarios were con-structed based on recent model results by Rahn and Wahlen (2000). Whilst the general shape of their isotope scenario was maintained, it was scaled to match the firn air data as closely as possible (Fig. 2). This is equivalent to adjusting the difference between the pre-industrial and the present iso-topic composition of atmospheric N2O and yields the pre-industrial atmospheric N2O isotope signature as a straight-forward result.
As is evident from the profile of the N2O mixing ratios, the most stringent constraints on the temporal evolution of the isotope signatures in the past come from the deepest samples.
Even down to 70 m for Dome C and 67 m for DML, the mean age of the air is still less than 10 years (age spectra not shown). The top part is additionally affected by thermal diffusion, which can introduce larger variations on a seasonal time scale which are not accounted for in the model.
The scenarios without any change in the isotopic compo-sition (black lines in Fig. 1) show the effects of fractionation due to gravitational separation and diffusion alone on the N2O isotopic composition in the firn. Clearly, these model runs are not in agreement with the observations. The scenar-ios presented in Fig. 2b result in firn profiles that are much closer to the measurements, and the oldest samples are used to select the scenarios that fit the data best. Note that the firn air data provide constraints only for the last∼50 years of the scenarios presented in Fig. 2 (the mean age of the oldest sam-ple from DML is roughly 35 years). This is the period where about 2/3 of the total isotope shift occurred. Prior to this the scenarios are constrained by maintaining the general shape of the isotope evolution from (Rahn and Wahlen, 2000). The best match between the firn air model and the observed pro-files is obtained for an overall decrease from 1700 to 2000 of about−2.0‰ forδ15N and about−1.2‰ forδ18O. The 15N depletion is distributed quite evenly between the two po-sitions; the decrease is about−1.8‰ for1δ15N and−2.2‰
for 2δ15N. Consistent results are found for both locations. Uncertainty ranges can be estimated from the range of sce-narios that agree with the data within the experimental error bars and are shown in Table 1. These isotope changes rep-resent the isotopic fingerprint of the global average source responsible for the increase of the N2O mixing ratio since pre-industrial times. From the scenarios used as input for the firn model we infer that in 1998 the isotope signatures have been changing at a rate of approximately−0.038‰ yr−1for 1δ15N,−0.046‰ yr−1for2δ15N,−0.041‰ yr−1for the av-erage δ15N and −0.025‰ yr−1 for δ18O (see Table 1 for ranges). These trends are well-constrained by our measure-ments. Despite their small magnitude, the present isotope trends derived from the firn data are important parameters for the construction of global N2O isotope budgets, because they affect the entire atmospheric N2O reservoir (see below).
4 Global isotope budget calculations
Mass balance requires that the N2O production from all sourcesP = 6Pi = 16.4 Tg N yr−1is equal to the
strato-spheric loss LS = 12.6 Tg N yr−1 plus the observed trend
in the troposphere 1T. 1T is the tropospheric fraction (∼85%, Warneck, 1999) of the total atmospheric annual increase of 3.8 Tg N yr−1 (annual fluxes are for 1998 from the Third IPCC Assessment Report; Houghton et al., 2001). The stratospheric loss term is the difference between the troposphere-stratosphere flux FT−S and the
stratosphere-troposphere fluxFS−T, leading to:
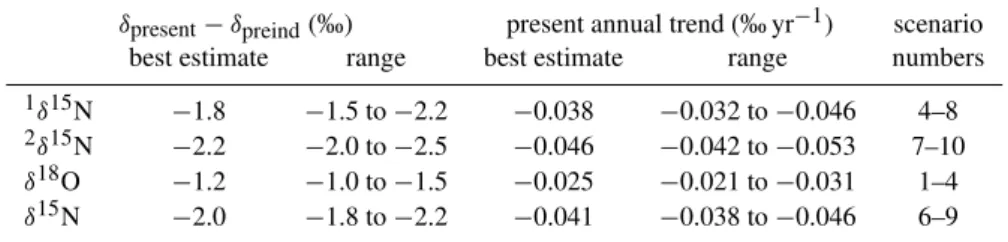
Table 1.Best estimates and possible ranges for the differences between present and pre-industrial atmospheric N2O isotope values and for present annual isotope trends, derived from the scenarios used in the firn air model. The ranges reported here represent the range of model scenarios from Fig. 2 for which the firn profile results bracket the experimental error bars of the bottom samples (Fig. 1); model errors are not included. The scenario numbers in the last column correspond to Fig. 2
δpresent−δpreind(‰) present annual trend (‰ yr−1) scenario best estimate range best estimate range numbers
1δ15N −1.8 −1.5 to−2.2 −0.038 −0.032 to−0.046 4–8 2δ15N −2.2 −2.0 to−2.5 −0.046 −0.042 to−0.053 7–10
δ18O −1.2 −1.0 to−1.5 −0.025 −0.021 to−0.031 1–4
δ15N −2.0 −1.8 to−2.2 −0.041 −0.038 to−0.046 6–9
For the individual isotopologues, the fluxes are multiplied by theδvalues to obtain flux-weighted isotope budgets. FT−S
has a typical tropospheric isotope valueδT and theFS−T has
a representative stratospheric isotopic compositionδS. The
tropospheric isotope signatures are changing with time as ev-ident from the firn air measurements, and this change has to be considered. The rate of change in the tropospheric isotope content is d(T·δT)
dt =δT
dT
dt +T
d(δT)
dt . Here,T is the
tropo-spheric share (85%, Warneck, 1999) of the atmotropo-spheric N2O inventory of 1510 Tg N in 1998 (Houghton et al., 2001), i.e. T =1284 Tg N, andδT is the isotopic composition of
tropo-spheric N2O. Thus, the globally averaged source signature δ, which is the flux-weighted average of all individual source signaturesδi, can be calculated from:
P δ=6Piδi =δT
dT dt +T
d(δT)
dt +(FT−SδT −FS−TδS)(2) The calculations can be further simplified and are more il-lustrative ifδ is expressed relative to the tropospheric aver-age rather than to an international reference material. The rescaled valuesδ′
x(x =i, T , S)are derived from theδx
val-ues versus a reference material asδ′
x =(δx−δT)/(1+δT).
Thus,δ′
T =0 by definition, and Eq. (2) reads
P δ′= T
1+δT
d(δT)
dt −FS−Tδ
′
S (3)
The most critical point in the budget calculations is the estimation of FS−T. Assuming that the average exchange
flux of total air between stratosphere and troposphereF is equal in both directions, FT−S = F · µT and FS−T =
F ·µS, where µT andµS are the tropospheric N2O
mix-ing ratio and a stratospheric mixmix-ing ratio representative for the air returning from the stratosphere, respectively. Thus, LS = F (µT −µS). In a simple two-box model of the
atmosphere, the second necessary relation between F and µS can be derived from basic atmospheric quantities as
µS =µT ·(F τ−N χT)/(F τ+N χS)(Kaiser, 2002). Here,
N = 1.77·1020mol is the total number of molecules in
the atmosphere (Trenberth and Guillemot, 1994), τ is the global atmospheric lifetime of N2O of about 120 yr,µT =
314 nmol/mol is the tropospheric N2O mixing ratio in 1998 andχS =0.15 andχT =0.85 are the fraction of air in the
stratosphere and troposphere, respectively (Warneck, 1999). Using LS = 0.45 Tmol yr−1 for the stratospheric annual
loss (Houghton et al., 2001), these simple calculations yield F = 0.22 Tmol s−1for the total flux between stratosphere and troposphere andµS =248 nmol/mol for the N2O
mix-ing ratio of the air returnmix-ing from the stratosphere. Holton (1990) calculated the flux across the 100 mb isobar (corre-sponding toχS ≈0.1) and foundF =0.20 Tmol s−1, which
corresponds toµS = 243 nmol/mol for his value of µT =
330 nmol/mol. Our value of µS = 248 nmol/mol value is
also consistent withµS =250 nmol/mol that was used in
re-cent studies of air mass exchange between stratosphere and troposphere (Luz et al., 1999). AdoptingF =0.22 Tmol s−1 andµS =250 nmol/mol from the above calculations yields
values ofFT−S =61.1 Tg N yr−1(in good agreement with
60 Tg N yr−1from Holton, 1990) andF
S−T = 48.5 Tg N
yr−1.
The values ofδ′
S, i.e. the stratospheric isotope ratios
cor-responding to a mixing ratio of 250 nmol/mol, can be calcu-lated from recent stratospheric N2O isotope measurements (R¨ockmann et al., 2001a), and are given in Table 2. We note that although there is still considerable discussion about the true value ofF, the isotope budget calculations below are not very sensitive to the choice of its precise value. If a smaller value forF is chosen, then the N2O in the stratosphere is exposed to the stratospheric sink for a longer time and will get more enriched, i.e. less N2O is returned from the strato-sphere, but with a higher isotope enrichment. Conversely, if Fis larger, the stratospheric N2O has less time to be fraction-ated in the stratosphere and will therefore be less enriched. The isotope flux (FS−T ·δS′) is thus not as sensitive toF as
the fluxFS−T itself.
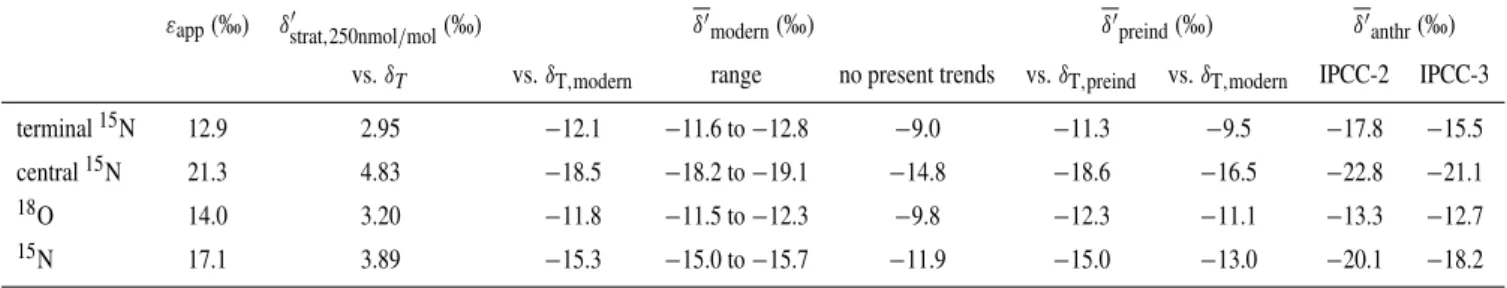
Table 2. Fractionation constantsεappfor the lower stratosphere and representative stratospheric isotope enrichments for a mixing ratio of 250 nmol/mol (δ′
strat,250nmol/mol) are based on the stratospheric measurements from (R¨ockmann et al., 2001a). Using these stratospheric enrichments and the trends from the firn data, we calculateδvalues of the modern global average N2O source,δ′modern. The ranges are based on the ranges derived for the atmospheric trends (Table 1). Results without incorporation of these trends are also shown. Similar calculations for the pre-industrial atmosphere yield the global average source signature in pre-industrial times versusδT ,preind. Using the difference between the present and pre-industrial value ofδT from the firn air measurements (Table 1), we calculate the pre-industrial source signature
versus the modern atmospheric signature (column 8), which allows a direct comparison between the present and the pre-industrial global average N2O source. To calculate the isotopic fingerprint of the anthropogenic contribution, two values are adopted for its source strength: The difference between the present source and the calculated pre-industrial one, 5.6 Tg N yr−1(see text), which is in good agreement with the IPCC-2 assessment (5.7 Tg N yr−1), and the revised value from the IPCC-3 assessment (Houghton et al., 2001) of 6.9 Tg N yr−1, which requires a reduction of the natural source to 9.5 Tg N yr−1for a closed budget. The isotope results for the two different values of the anthropogenic source strength differ only slightly
εapp(‰) δ′strat,250nmol/mol(‰) δ′modern(‰) δ′preind(‰) δ′anthr(‰) vs.δT vs.δT,modern range no present trends vs.δT,preind vs.δT,modern IPCC-2 IPCC-3
terminal15N 12.9 2.95 −12.1 −11.6 to−12.8 −9.0 −11.3 −9.5 −17.8 −15.5
central15N 21.3 4.83 −18.5 −18.2 to−19.1 −14.8 −18.6 −16.5 −22.8 −21.1
18O 14.0 3.20 −11.8 −11.5 to−12.3 −9.8 −12.3 −11.1 −13.3 −12.7
15N 17.1 3.89 −15.3 −15.0 to−15.7 −11.9 −15.0 −13.0 −20.1 −18.2
stratospheric enrichments. The consideration of the small an-nual trends derived from the firn air measurements above is important. Table 2 also shows results of budget calculations ignoring these trends, as done in some previous global N2O isotope budget calculations (Kim and Craig, 1993; Yoshida and Toyoda, 2000). Clearly, the resulting source signatures are much heavier then.
Similar isotope budget calculations can also be performed for the pre-industrial atmosphere. Here, Eq. (3) simplifies further if we assume that the global N2O budget as well as the N2O isotopic composition were then in equilibrium, i.e. P = Land d(δT)
dt = 0. We furthermore make the
assump-tions that the N2O lifetime, the stratospheric fractionation constantsεand the total exchange of air between troposphere and stratosphereF have remained invariable since 1700, so that the sink strength can be scaled down from its present value of 12.6 Tg N yr−1 at 315 nmol/mol N2O to a pre-industrial value of 10.8 Tg N yr−1at 270 nmol/mol. Like-wise, FT−S can be scaled down to 52.4 Tg yr−1 and thus
FS−T = 41.6 Tg yr−1. In these calculations, the resulting
values ofδ′
are relative to the pre-industrial, not the present tropospheric N2O isotopic composition. For direct compar-ison to the present day results, the differences between the present and the pre-industrial atmosphere as derived above from the firn air measurements have to be taken into account (Table 2).
A comparison of the pre-industrial and the present source signatures in Table 2 shows that the isotopic composition of the global average N2O source has significantly de-creased between the pre-industrial and present atmospheres. The decrease is smallest for δ18O, which has the smallest
stratospheric fractionation constants and the smallest present trend, and largest for2δ15N, for which the stratospheric frac-tionation and the trend are strongest. It is not clear a priori that the signatures have to get isotopically depleted, since the atmosphere at present is no longer in a source – sink equi-librium. Even without a change in the global average iso-tope signature, the strong increase in the flux of the depleted source emissions would lead to a decrease in the atmospheric δvalues, because the stratospheric return fluxFS−T has not
increased proportionally, i.e. the source and sink terms in Eq. (3) do not match. The budget calculations clearly show, however, that an additional decrease in the global average source signature is required to explain the differences be-tween the present and pre-industrial N2O isotope values in the atmosphere. These important constraints on the temporal evolution of the global average source signature come in par-ticular from the incorporation of the present isotope trends that are derived from the firn air measurements. If the trends are not included, the present global average isotope signa-ture would actually be heavier than the pre-industrial one (Table 2). This is also easy to understand from Eq. (3): If
d(δT)
dt =0 is prescribed, the absolute magnitude ofδ
′has to
be reduced when the total source fluxP increases andFS−T
does not increase proportionally.
We note that in particular the trend to isotopically depleted values between pre-industrial and present source signatures is not very sensitive to small changes in individual parame-ters of the calculations (e.g. the stratospheric enrichments or the stratosphere-troposphere fluxes). In addition to the above discussion on the evaluation ofFS−T (following Eq.
inventories are affected. However, the budget calculations show that if strongly different values for the stratospheric en-richments are used (Griffith et al., 2000), the global average source signature ends up close to the lowest ever measured source data, providing additional evidence that those strato-spheric fractionation factors are too large.
Having derived the isotope signatures of the present and pre-industrial N2O sources, a simple mass balance equation can be used to calculate the isotope signature of the anthro-pogenic source, assuming that the natural contribution has not changed. The results in Table 2 show that the total anthro-pogenic source, which accounts for the difference between the pre-industrial and present emissions, is considerably de-pleted relative to the pre-industrial source. The results differ only slightly for two different values of the anthropogenic source strength.
Thus, global N2O isotope budget calculations using mea-sured stratospheric fractionation constants and the tempo-ral atmospheric isotope trends allow to identify the isotopic fingerprint of the present, the pre-industrial and the anthro-pogenic global average N2O sources. Together with the de-rived temporal trends in the troposphere, these are impor-tant foundations for budgetary isotope research on N2O, and we present some first conclusions: The fact that anthro-pogenic emissions are significantly depleted relative to the pre-industrial N2O source is likely a result of several fac-tors. First, the pre-industrial sources include the isotopically enriched oceanic emissions. On the other hand, also an-thropogenic sources include rather enriched industrial emis-sions from fossil fuel combustion, nylon production and ni-tric acid production. The isotope signatures of these indus-trial emissions are only poorly known, but apparently their combined effect on the anthropogenic source is less than that of oceanic emissions on the pre-industrial source. Further-more, recent soil measurements indicate that N2O from agri-cultural soils is even more depleted than natural soil emis-sions (P´erez et al., 2001). This is supported by the present budget calculations: If we subtract the contribution of the oceanic source from both the pre-industrial and the present average source signatures, the isotope values for the remain-ing sources are similar. For the pre-industrial source, these remaining sources are mainly soil emissions, whereas for the anthropogenic source the relatively enriched industrial emis-sions contribute. Therefore, soil derived N2O emisemis-sions must be even more depleted today than in the pre-industrial era.
5 Conclusions
Isotope measurements on N2O from Antarctic firn air sam-ples show that the observed N2O increase in the atmosphere since pre-industrial times is accompanied by a significant iso-topic depletion in15N at both positions in the molecule and in18O. Using the data in combination with a firn air diffu-sion model, the small present rates of change of the isotope
signatures have been precisely quantified, which is important for global isotope budget calculations. Such budget calcula-tions, performed for the present and the pre-industrial atmo-spheres, reveal that the observed isotopic depletions are not simply due to an increase in the source strength of the iso-topically depleted surface sources. In addition, the global average isotopic source signature itself has also decreased since pre-industrial times.
It is interesting to note that15N has changed similarly at both positions in the molecule due to the strong increase of the global N2O source since pre-industrial times. This is in sharp contrast to the stratospheric N2O sinks where the over-all fractionations are much stronger at the central position than at the terminal position. Potentially, these different iso-tope signatures may be used to discriminate between source and sink (e.g. changes in solar irradiation or stratosphere-troposphere exchange) effects as origin of variations in the N2O mixing ratio on longer time scales, as observed in ice cores. First N2O isotope data on air extracted from ice cores are now becoming available (Sowers, 2001), although they have not yet reached the necessary precision.
Global average isotopic source signatures could not be obtained from direct isotope ratio measurements on N2O sources so far due to the heterogeneity of the sources them-selves and the large range of isotope signatures encountered (Gros et al., 2002). The top-down approach presented here provides independent information and should therefore be useful for future research on the global N2O isotope bud-get. Temporal isotope trends and fractionation constants for stratospheric photolysis and reaction of N2O with O(1D)are well established now. Therefore, future modeling efforts should aim for a more comprehensive and more accurate cal-culation of the actual back-flux and corresponding isotopic enrichment of stratospheric N2O. Nevertheless, the simple box model approach used here already gives a good repre-sentation of the expected global average source signature. The detailed investigation of the stratosphere-troposphere ex-change is presently an active field of atmospheric research, and advances in this area in the future will further reduce the uncertainties of top-down budget calculations.
CO2data. Bernd Knape helped a lot with the development of the continuous-flow system and the isotope measurements.
References
Battle, M., Bender, M., Sowers, T., Tans, P. P., Butler, J. H., Elkins, J. W., Ellis, J. T., Conway, T., Zhang, N., Lang, P., and Clarke, A. D.: Atmospheric gas concentrations over the past century mea-sured in air from firn at the South Pole, Nature, 383, 231–235, 1996.
Brenninkmeijer, C. A. M., Koeppel, K., R¨ockmann, T., Scharffe, D. S., Br¨aunlich, M., and Gros, V.: Absolute measurement of the abundance of atmospheric carbon monoxide, J. Geophys. Res., 106, 10 003–10 010, 2001.
Brenninkmeijer, C. A. M. and R¨ockmann, T.: Mass spectrometry of the intramolecular nitrogen isotope distribution of environmen-tal nitrous oxide using fragment-ion analysis, Rap. Comm. Mass Spectrom., 13, 2028–2033, 1999.
Cliff, S. S. and Thiemens, M. H.: The18O/16O and17O/16O ra-tios in atmospheric nitrous oxide: a mass-independent anomaly, Science, 278, 1774–1776, 1997.
Dore, J. E., Popp, B. N., Karl, D. M., and Sansone, F. J.: A large source of atmospheric nitrous oxide from subtropical North Pa-cific waters, Nature, 396, 33–66, 1998.
Fabre, A., Barnola, J. M., Arnaud, L., and Chappellaz, J.: Determi-nation of gas diffusivity in polar firn: Comparison between ex-perimental measurements and inverse modeling, Geophys. Res. Lett., 27, 557–560, 2000.
Fl¨uckiger, J., D¨allenbach, A., Blunier, T., Stauffer, B., Stocker, T. F., Raynaud, D., and Barnola, J.-M.: Variations in atmospheric N2O concentration during abrupt climatic changes, Science, 285, 227–230, 1999.
Griffith, D. W. T., Toon, G. C., Sen, B., Blavier, J.-F., and Toth, R. A.: Vertical profiles of nitrous oxide isotopomer fractiona-tion measured in the stratosphere, Geophys. Res. Lett., 27, 2485– 2488, 2000.
Gros, V., Brenninkmeijer, C. A. M., J¨ockel, P., Kaiser, J., Lowry, D., Nisbet, E. G., O’Brian, P., R¨ockmann, T., and Warwick, N.: Use of isotopes, in: Emissions of chemical species and aerosols in the atmosphere, (Ed) Granier, C., in press , Kluwer, Paris, 2002. Holton, J. R.: On the Global Exchange of Mass between the
Strato-sphere and TropoStrato-sphere, J. Atmos Sci., 47, 392–395, 1990. Houghton, J. T., Ding, Y., Griggs, D. J., Nogueur, M., van der
Lin-den, P. J., Dai, X., Maskell, K., and Johnson, C. A.: Climate Change 2001: The Scientific Basis, Cambridge University Press, 2001.
Johnson, M. S., Billing, G. D., Gruodis, A., and Janssen, M. H. M.: Photolysis of nitrous oxide isotopomers studied by time-dependent hermite propagation, J. Phys. Chem. A, 105, 8672– 8680, 2001.
Kaiser, J.: Stable isotope investigations of atmospheric ni-trous oxide, Ph.D. thesis, University of Mainz, available at http://archimed.uni-mainz.de/pub/2003/0004/, or Verlag Dr. Hut, Mnchen, ISBN 3-934767-90-7, 2002.
Kaiser, J., Brenninkmeijer, C. A. M., and R¨ockmann, T.: In-tramolecular15N and18O fractionation in the reaction of N2O with O(1D)and its implications for the stratospheric N2O iso-tope signature, J. Geophys. Res., 107, 10.1029/2001JD001506, 2002a.
Kaiser, J., Brenninkmeijer, C. A. M., and R¨ockmann, T.: Tem-perature dependence of isotope fractionation in N2O photolysis, Phys. Chem. Chem. Phys., 4, 10.1039/b204837j, 2002b. Kaiser, J., Brenninkmeijer, C. A. M., R¨ockmann, T., and Crutzen,
P.: Wavelength dependence of isotope fractionation in N2O pho-tolysis, Atmos. Chem. Phys., 3, 303–313, 2003.
Kim, K.-R. and Craig, H.: Nitrogen- 15 and oxygen- 18 charac-teristics of nitrous oxide: A global perspective, Science, 262, 1855–1857, 1993.
Luz, B., Barkan, E., Bender, M. L., Thiemens, M. H., and Boering, K. A.: Triple-isotope composition of atmospheric oxygen as a tracer of biosphere productivity, Nature, 400, 547–550, 1999. Naqvi, S. W. A., Yoshinari, T., Jayakumar, D. A., Altabet, M. A.,
Narvekar, P. V., Devol, A. H., Brandes, J. A., and Codispoti, L. A.: Budgetary and biogeochemical implications of N2O isotope signatures in the Arabian Sea, Nature, 394, 462–464, 1998. P´erez, T., Trumbore, S. E., Tyler, S. C., Matson, P. A.,
Ortiz-Monasterio, I., Rahn, T., and Griffith, D. W. T.: Identifying the agricultural imprint on the global N2O budget using stable iso-topes, J. Geophys. Res., 106, 9869–9878, 2001.
Rahn, T. and Wahlen, M.: A reassessment of the global isotopic budget of atmospheric nitrous oxide, Glob. Biogeochem. Cycl., 14, 537–543, 2000.
Rahn, T., Zhang, H., Wahlen, M., and Blake, G. A.: Stable iso-tope fractionation during ultraviolet photolysis of N2O, Geo-phys. Res. Lett., 25, 4489–4492, 1998.
R¨ockmann, T., Brenninkmeijer, C. A. M., Wollenhaupt, M., Crow-ley, J. N., and Crutzen, P. J.: Measurement of the isotopic frac-tionation of15N14N16O,14N15N16O and14N14N18O in the UV photolysis of nitrous oxide, Geophys. Res. Lett., 27, 1399–1402, 2000.
R¨ockmann, T., Kaiser, J., Brenninkmeijer, C. A. M., Crowley, J. N., Borchers, R., Brand, W. A., and Crutzen, P. J.: Isotopic enrich-ment of nitrous oxide (15N14NO,14N15NO,14N14N18O) in the stratosphere and in the laboratory, J. Geophys. Res., 106, 10 403– 10 410, 2001a.
R¨ockmann, T., Kaiser, J., Crowley, J. N., Brenninkmeijer, C. A. M., and Crutzen, P. J.: The origin of the anomalous or “mass-independent” oxygen isotope fractionation in tropospheric N2O, Geophys. Res. Lett., 28, 503–506, 2001b.
R¨ockmann, T., Kaiser, J., Brenninkmeijer, C. A. M., and Brand, W. A.: Gas-chromatography, isotope-ratio mass spectrometry method for high-precision position-dependent15N and18O mea-surements of atmospheric nitrous oxide, Anal. Chem., submitted, 2003.
Rommelaere, V., Arnaud, L., and Barnola, J.-M.: Reconstructing recent atmospheric trace gas concentrations from polar firn and bubbly sea ice data by inverse methods, J. Geophys. Res., 102, 30 069–30 083, 1997.
Schwander, J., Stauffer, B., and Sigg, A.: Air mixing in firn and the age of the air at pore close-off, Ann. Glaciol., 10, 141–145, 1988. Sowers, T.: N2O record spanning the penultimate deglaciation from the Vostok ice core, J. Geophys. Res., 106, 31 903–31 914, 2001. Sowers, T., Rodebaugh, A., Yoshida, N., and Toyoda, S.: Extending records of the isotopic composition of atmospheric N2O back to 1900 a.d. from air trapped in snow at South Pole, in: 1st interna-tional symposium on isotopomers, (Ed) Yoshida, N., Yokohama, Japan, 2001.
the stratosphere, J. Geophys. Res., 106, 7515–7522, 2001. Trenberth, K. E. and Guillemot, C. J.: The total mass of the
atmo-sphere, J. Geophys. Res., 99, 23 079–23 088, 1994.
Trudinger, C. M., Enting, D. M., Etheridge, D. M., Francey, R. J., Levchenko, V. A., Steele, L. P., Raynaud, D. , and Arnaud, L.: Modeling air movement and bubble trapping in firn, J. Geophys. Res., 102, 6747–6763, 1997.
Turatti, F., Griffith, D. W. T., Wilson, S. R., Esler, M. B., Rahn, T., Zhang, H., and Blake, G. A.: Positionally dependent15N fractionation factors in the UV photolysis of N2O determined
by high resolution FTIR spectroscopy, Geophys. Res. Lett., 27, 2489–2492, 2000.
Warneck, P.: Chemistry of the natural atmosphere, pp. 923, Aca-demic Press, San Diego, 1999.
Yoshida, N. and Toyoda, S.: Constraining the atmospheric N2O budget from intramolecular site preference in N2O isotopomers, Nature, 405, 330–334, 2000.