www.atmos-chem-phys.net/11/1549/2011/ doi:10.5194/acp-11-1549-2011
© Author(s) 2011. CC Attribution 3.0 License.
Chemistry
and Physics
Spatial variability of POPs in European background air
A. K. Halse1, M. Schlabach1, S. Eckhardt1, A. Sweetman2, K. C. Jones2, and K. Breivik1,3
1Norwegian Institute for Air Research (NILU), P.O. Box 100, 2027 Kjeller, Norway
2Department of Environmental Science, Institute of Environmental and Natural Sciences, Lancaster University, Lancaster, LA1 4YQ, UK
3University of Oslo, Department of Chemistry, P.O. Box 1033, 0315 Oslo, Norway Received: 20 July 2010 – Published in Atmos. Chem. Phys. Discuss.: 1 October 2010 Revised: 7 January 2011 – Accepted: 4 February 2011 – Published: 17 February 2011
Abstract. Passive air samplers (PAS) were deployed at 86
European background sites during summer 2006 in order (i) to gain further insight into spatial patterns of persistent or-ganic pollutants (POPs) in European background air and, (ii) to evaluate PAS as an alternative sampling technique under EMEP (Co-operative programme for monitoring and evalua-tion of the long-range transmissions of air pollutants in Eu-rope). The samples were analyzed for selected PCBs, HCHs, DDTs, HCB, PAHs and chlordanes, and air concentrations were calculated on the basis of losses of performance refer-ence compounds. Air concentrations of PCBs were generally lowest in more remote areas of northern Europe with elevated levels in more densely populated areas.γ-HCH was found at elevated levels in more central parts of Europe, whereasα -HCH, β-HCH and DDTs showed higher concentrations in the south-eastern part. There was no clear spatial pattern in the concentrations for PAHs, indicative of influence by local sources, rather than long range atmospheric transport (LRAT). HCB was evenly distributed across Europe, while the concentrations of chlordanes were typically low or non-detectable. A comparison of results obtained on the basis of PAS and active air sampling (AAS) illustrated that co-ordinated PAS campaigns have the potential serve as useful inter-comparison exercises within and across existing mon-itoring networks. The results also highlighted limitations of the current EMEP measurement network with respect to spatial coverage. We finally adopted an existing Lagrangian transport model (FLEXPART) as recently modified to incor-porate key processes relevant for POPs to evaluate potential source regions affecting observed concentrations at selected
Correspondence to:K. Breivik ([email protected] )
sites. Using PCB-28 as an example, the model predicted con-centrations which agreed within a factor of 3 with PAS mea-surements for all except 1 out of the 17 sites selected for this analysis.
1 Introduction
Persistent organic pollutants (POPs) constitute a group of organic chemicals that are semi-volatile, bio-accumulative, persistent and toxic (e.g. Vallack et al., 1998). A key feature of these chemicals is their intrinsic potential for long range atmospheric transport (LRAT). Two international agreements have come into effect in order to protect human health and the environment from these substances. These are the global Stockholm Convention on POPs (UNEP, 2003) and the re-gional 1998 Aarhus Protocol on Persistent Organic Pollu-tants under the 1979 Geneva Convention on Long-range Transboundary Air Pollution (CLRTAP). The latter Protocol entered into force in 2003, and its ultimate goal is to elimi-nate any discharges, emissions and losses of POPs to the en-vironment. The Aarhus Protocol initially focuses on 16 sub-stances which include eleven pesticides, two industrial chem-icals and three by-products/contaminants (UNECE, 1998).
increasingly popular over the last decade, have the poten-tial to be used as a complimentary technique to conventional AAS (e.g. Shoeib and Harner, 2002b; Jaward et al., 2004a; Pozo et al., 2004; Harner et al., 2006b). Of key relevance to this study are the first European campaign using PAS (Jaward et al., 2004a, b) and the Global Atmospheric Passive Sam-pling (GAPS) studies (e.g. Pozo et al., 2009) which have measured POPs at both urban and rural sites on a European and global scale, respectively.
An important objective of this study has been to improve the knowledge of spatial patterns of POPs in background air across Europe using PAS. Altogether 92 samplers were deployed for∼3 months at 86 sites in 34 European coun-tries during the late summer of 2006. Unlike the former European-wide survey carried out in 2002 (Jaward et al. 2004a,b), our main focus is on the occurrence of POPs across Europe in the context of LRAT. This study therefore targets background sites only. As PAS were mainly located at estab-lished EMEP sites which additionally monitor POPs using AAS on a regular basis, this study offered a unique oppor-tunity to investigate similarities and differences in levels and patterns on the basis of complementary air measurements.
The results of these investigations are also used to dis-cuss limitations of the current EMEP measurement network with respect to spatial coverage. These results may also be used to evaluate LRAT models, both within EMEP (e.g. Malanichev et al., 2004) and beyond. As an illustration, we have also included an assessment of differences in predicted source-receptor relationships at selected sites as exemplified for PCB-28, using an existing model (Eckhardt et al., 2009).
2 Materials and methods
2.1 Theory
Polyurethane foam (PUF) disks have gained increasing use as PAS (Shoeib and Harner, 2002b; Harner et al., 2004, 2006b; Jaward et al., 2004a; Pozo et al., 2004, 2006; Motelay-Massei et al., 2005). These PUF disks have high affinity and capacity to sorb organic chemicals. Accumula-tion of a chemical during exposure is equivalent to the rate of uptake minus rate of loss. Uptake of POPs is airside con-trolled and is initially linear and a function of the mass trans-fer coefficient (kA), the planar area of the sampling media (APSM)and concentration of the compound in air (CA). Ide-ally, these are the functioning conditions to the sampler out in the field, but as the chemical builds up in the sampling medium, the rate of uptake will be reduced and finally reach equilibrium (Shoeib and Harner, 2002b). The duration of the linear phase is dependent on the octanol-air partition coeffi-cient (KOA), and chemicals with lowKOAwill reach equilib-rium with the atmosphere faster than chemicals with higher
KOA(Harner et al., 2004). Uptake is also found to increase at
elevated wind speeds, as this causes an increase in the mass transfer coefficient (kA)(Tuduri et al., 2006).
The PUF disk sampler typically contains a PUF foam disk placed between two stainless steel metal domes in a so called “flying saucer” design (Wilford et al., 2004). This design aims to protect the foam disk from precipitation, sunlight, wind speed effects and coarse particle deposition. Air flows through a gap between the two domes (Pozo et al., 2004). Different passive sampler housings have been tested, and a relatively recent study (Tuduri et al., 2006), shows that the “flying saucer” design dampens the wind speed effect ade-quately. The specific housing design used in this study with metal tubes inside the sampler, offers the additional advan-tage that the width of the gap between the two domes is kept identical from site to site.
The PUF disks were spiked with depuration compounds (Performance Reference Compounds – PRCs) of different volatility prior to exposure (Huckins et al., 2002), which were either isotopically labelled or other non-native com-pounds. The loss rate of PRCs experienced during deploy-ment are in turn used to back-calculate air concentrations in the PAS (e.g. Tuduri et al., 2006).
2.2 Deployment and sample preparation
Samplers were exposed in the field for about 3 months in various European countries in a coordinated campaign dur-ing late summer 2006. The study region included 34 coun-tries and 86 sites, located from Spitsbergen (78◦N) in the north to Cyprus (33◦N) in the south, and from Greenland (38◦W) in the west to Kazakhstan (75◦E) in the east (see Table S1). Most of the sites included in this study (N = 71) are part of the EMEP measurement network (see e.g. Aas and Breivik, 2008) although additional remote sites (N = 15) were included to improve spatial coverage in certain regions. PAS were additionally co-deployed with AAS at EMEP sites (Fig. S1) where POPs are monitored under EMEP on a rou-tine basis to evaluate possible differences in results, along with duplicated PAS samplers and field blanks.
2.3 Analysis
In the following section, only a brief overview of the sample treatment and analysis will be given. More detailed informa-tion of the sample preparainforma-tion, including pre-cleaning and clean-up of the PUF disks and analysis is presented in the Supplement.
persistent compounds, and silica fractionation for the PAH extract (Supplement S1.2). The extracts were further con-centrated by a gentle stream of nitrogen to∼50 µL and added recovery standards (Supplement S1.3). Identification and quantification of individual substances was carried out us-ing a gas chromatograph coupled to a high resolution (PCBs, HCHs, HCB, DDTs) and low resolution (PAHs, chlordanes) mass spectrometer, with gas chromatograph conditions as ex-plained in Supplement (Table S3, Supplement S1.3).
2.4 Deriving concentrations in air/effective air
sample volume
In order to back-calculate the actual air concentrations for individual compounds in air, information on the PUF charac-teristics, air temperature, measured loss of individual PRCs and their temperature dependent KOA-values were used in an initial step to calculate site-specific sampling rates (e.g. Shoeib and Harner, 2002b; Pozo et al., 2004, 2009). The average air temperatures at each site for the exposure pe-riod are based on meteorological data from European Centre for Medium-Range Weather Forecasts (ECMWF) to ensure a consistent approach. Here, at 2 meter above ground level, the temperature was averaged every 3 hour over the period for which the respective sample was taken. The altitude for each site (Table S1) was next compared against the model altitude. For five high altitude sites where large differences were noted (Jungfraujoch, Moussala, Zavizan, Chopok and Longobucco), the ECMWF data were adjusted by assuming a temperature decrease by altitude of−0.65◦C per 100 m. Loss of PRCs from individual samples was estimated on the basis of the ratio between the amount of PRCs in individ-ual samples and the average amount of PRCs in the field blanks. For PCBs (23, 30, 32, 107, 198), temperature depen-dent KOA-values were derived on the basis of data reported by Harner and Bidleman (1996) and relative retention times from Harju et al. (1998). For PCB-12 and -14, we used data from Li et al. (2003), and for D6γ-HCH, information pre-sented by Shoeib and Harner (2002a). Only PRCs which experienced a loss of 40% or more were used to calculate an average site-specific sampling rate (Pozo et al., 2009). The resulting sampling rates and number of PRCs used in these calculations are presented in Table S1. These sampling rates were then used to convert measured values into air concen-tration by dividing the amounts in the sampler by the effec-tive air volumes as detailed by Shoeib and Harner (2002b). For a few sites experiencing insufficient loss of the PRCs (Nuuk, Summit, Spitsbergen, Sniezka), the default sampling rate proposed by Harner et al. (2006c) was used to estimate effective air volumes for individual substances. The result-ing air concentrations for these sites should therefore be in-terpreted with caution.
2.5 Model
Simulations of atmospheric POP transport were made using the Lagrangian particle dispersion model FLEXPART (Stohl et al., 1998, 2005; Stohl and Thomson, 1999). FLEX-PART was driven with analyses from the European Centre for Medium-Range Weather Forecasts (ECMWF, 1995) with 1◦×1◦ resolution (derived from T319 spectral truncation). Analyses at 00:00, 06:00, 12:00 and 18:00 UTC, and 3-h forecasts at 03:00, 09:00, 15:00 and 21:00 UTC were used. There are 23 ECMWF model levels below 3000 m, and 91 in total. FLEXPART calculates the trajectories of so-called tracer particles and accounts for turbulence, convection, de-position (wet and dry) and atmospheric reaction by hydroxyl (OH) radicals (Eckhardt et al., 2009). It was run in backward mode, in order to identify the source regions of air pollu-tants at a particular site (Stohl et al., 2003; Seibert and Frank, 2004). These were found by following all 4 million particles equally released over the sample duration, 20 days backward in time. These source regions are expressed as emission sen-sitivities (ES) in the footprint layer (0–100 m above ground) during each deployment period at different sites. The ES unit is nanoseconds per cubic meter, which is the residence time of air masses normalized by the volume. The ES maps for the footprint layer thus illustrates were the air mass had the abil-ity to collect pollutants from sources near the ground. Mul-tiplying this ES with emission fluxes from the PCB-28 emis-sion inventory (Breivik et al., 2007) yields the geographical distribution of sources contributing to the simulated concen-tration at the given measurement site. Emission contributions (EC), which gives the simulated air concentration at the re-ceptor, may then be obtained by areal integration. For further details we refer to the original publications listed above.
3 Quality Assurance/Quality Control (QA/QC)
Table 1. Concentrations of selected PCBs, HCHs, DDTs, chlordanes and HCB (pg m−3)and selected PAHs (ng m−3)at European back-ground sites.
Measured range
Compounds Average Deployed % above Max/min
±S.D Median samples Blanks MDL MDL ratio (MMR)
PCB-28 5±4 4 0.6–20 0.06–0.3 0.4 100 34
PCB-52 5±4 4 0.8–20 0.05–0.3 0.3 100 25
PCB-101 4±5 3 0.4–34 0.03–0.3 0.3 100 84
PCB-118 1.5±1.5 1.0 0.2a–8.3 0.001b–0.2 0.2 95 >55 PCB-138 2.0±2.4 1.2 0.2a–18.3 0.001b–0.2 0.2 95 >102
PCB-153 3±4 2 0.3a–28 0.004b–0.3 0.3 94 >87
PCB-180 0.8±0.9 0.6 0.05a–6 0.001–0.04 0.05 98 >122
67PCBs 21±19 17 2–121 >55
α-HCH 26±24 21 5–156 0.1–0.8 1 100 33
β-HCH 2±7 1 0.13a–49 0.01–0.2 0.13 85 >380
γ-HCH 35±38 19 1.8–170 0.1–1.3 1.3 100 94
63HCHs 64±59 46 9–311 >36
p,p′-DDE 21±47 6 1.6a–281 0.06–2 1.6 74 >177
p,p′–DDD 0.5±1.1 0.2 0.06a–10 0.004b–0.07 0.06 79 >169 o,p′-DDT 4±7 2 0.3a–39 0.001b– 0.3d 0.3 87 >143
p,p′-DDT 6±9 2 0.2a–46 0.001b–0.2 0.2 86 >240
64DDTs 32±62 10 1.1–356 >312
Fluorene 1.7±1.8 1.0 0.1a–9.7 0.01b–0.1 0.1 98 >83 Phenanthrene 3±3 2 0.1a–20 0.01b–0.1 0.1 95 >147 Anthracene 0.07±0.1 0.03 0.007a–0.9 0.007c 0.007 88 >130 Fluoranthene 0.7±0.8 0.4 0.03a–3.5 0.01b–0.03 0.03 95 >117 Pyrene 0.4±0.4 0.2 0.02a–2.4 0.01b–0.02 0.02 99 >153 Benz[a]anthracene 0.02±0.03 0.01 0.004a–0.2 0.005c 0.004 68 >49 Chrysene 0.07±0.07 0.03 0.004a–0.3 0.004c 0.004 95 >58 Benzo[a]pyrene 0.008±0.01 0.002 0.004a–0.06 0.004c 0.004 43 >15
68PAHs 6±6 4 0.2–35 >205
HCB 49±18 45 23–115 0.2–3 3 100 5
trans-chlordane 0.8±1.1 0.4 0.07a–7.3 0.003e–0.1 0.07 95 >104 cis-chlordane 1.2±0.7 1.2 0.1a–4.6 0.006e–0.1 0.1 98 >46 trans-nonachlor 1.3±1.0 1.2 0.1a–7.0 0.002e–0.08 0.1 98 >77 cis-nonachlor 0.16±0.1 0.15 0.05a–0.5 0.001e–0.04 0.05 87 >11
64chlordanes 3.5±2.7 3.2 0.2–19.4 >114
aMDL (method detection limit)bThe lower limit is 1/2 of the IDL (instrument detection limit)cThe component were not detected in the blanksdInterference in one of the blanks eLower and upper concentrations in the blanks were below IDL
3.1 Method and field blanks values
Method and field blanks consisted of pre-cleaned PUF disks which were extracted and analyzed in the same way as the exposed samples. Method blanks were only stored at NILU, whereas field blanks were brought in field with the deployed samples but not exposed. The field and method blank values were converted into an air concentration by using the average sampling rate (4.9 m3day−1), temperature (14◦C) and expo-sure time (94 days). The method and field blank values had similar values.
3.2 Method detection limit (MDL)
For the components studied here (fluorene – benzo(a)pyrene) only 0.01 ng m−3was used. For values that fell below this limit, half of this measured value was used. Furthermore, when the target compound in the exposed samples fell be-low the calculated method detection limit (MDL), half of the MDL from the field and method blanks was used for statis-tical treatment (Pozo et al., 2009). Table 1 provides more information regarding the blanks.
3.3 Recoveries
Two types of recoveries were compiled, namely recovery of the internal standards and of the PRCs. Quantification of the analytes is based on the added13C or2D-labeled internal standards and therefore the results must not be corrected for low recoveries. Recovery rates are listed and discussed in the Supplement (S1.4, S1.5 and Table S2).
The concentrations were not blank corrected due to both low and not stable concentrations in the blanks, whereas they were automatically corrected for the recoveries.
3.4 Uncertainties in the chemical analysis
Different factors influence the uncertainty in the chemical analysis: loss during sample extraction and clean-up, ac-curacy of the standard concentrations, instrumental param-eters, in addition to interferences from other compounds and possible sample contamination. To compensate for possible loss of analytes due to sample clean-up, internal standards were used in combination with a recovery standard. Field blanks were used to evaluate possible contamination during transport, and the method blanks to evaluate the laboratory conditions (e.g. solvents, adsorbents) respectively. Different approaches were applied to quantify these uncertainties, i.e. performance of intra laboratory/inter laboratory experiments and a critical step-by-step evaluation of all analytical steps. Both approaches result in a similar estimate for the uncer-tainty of the chemical analysis in the range of 20–35%, but will vary for different compounds/groups.
3.5 Uncertainties in back-calculated PAS
air concentrations
The PAS results are converted into air concentrations, rather than presented as sequestered amount per sampler, as this is essential to facilitate a direct comparison with both AAS results (4.2.1) and model outputs (4.4). The use of back-calculated air concentrations introduces additional uncertain-ties which are likely to exceed those that are associated with the chemical analysis alone (3.4). Past evaluations has sug-gested that the PAS method enables estimates of “true” air concentrations within a factor of 2–3 (Gouin et al., 2005a; Harner et al., 2006a; Klanova et al., 2008). Errors in esti-mated air concentrations reflect in part uncertainties in input parameters used to calculate uptake rates (e.g. Shoeib and Harner, 2002a), such as octanol-air partition coefficients and
their temperature dependencies (e.g. Li et al., 2003), the use of modeled rather than measured chamber air temperatures (Kennedy et al., 2010), and in the selection/loss of PRCs (e.g. Bartkow et al., 2006a; Moeckel et al., 2009). Further-more, there are uncertainties associated with sampling per-formance under variable environmental conditions, such as elevated wind speeds (Tuduri et al., 2006; Chaemfa et al., 2009b), sun-light intensity (Bartkow et al., 2006b), humid-ity (Santiago and Cayetano, 2007), temperatures (Klanova et al., 2008) and potential artifacts caused by inadvertent particle-phase sampling of POPs (e.g. Klanova et al., 2008; Chaemfa et al., 2009b). To further characterize uncertainties associated with uptake rates, a range of different field studies have previously been carried out whereby results obtained on the basis of AAS and PAS have been compared and con-trasted (e.g. Gouin et al., 2005a, 2008; Klanova et al., 2008; Chaemfa et al., 2008, 2009a; Moeckel et al., 2009; Hayward et al., 2010). We refer to these studies for a more detailed account of uncertainties in uptake rates.
4 Results and discussion
4.1 Overall results
Table 1 shows the calculated air concentrations (average, me-dian, range) of selected POPs at European background sites (N = 86), while data for individual sites are included in the Supplement. PCBs 28, 52, 101, α- and γ-HCH and HCB were detected in all samples, while some samples were below the method detection limit (MDL) for all other compounds. The spatial variability in the overall results is initially eval-uated by the ratio between maximum and minimum air con-centrations (MMR). For samples with concon-centrations below the MDL, the minimum concentration was replaced by the MDL when calculating the MMR and set to 1/2 MDL for the calculation of average, and median air concentrations in Table 1.
PCBs
The average concentration of 67PCBs was 21 pg m−3 (SD±19 pg m−3). The most abundant PCBs were PCB-52,
highest and lowest samples, but included a combination of both urban areas as well as remote background sites. MMR furthermore tended to increase with increasing chlorination (Table 1), suggesting lighter PCBs to be more evenly dis-tributed in European background air in comparison to their heavier counterparts. This may in part be seen as a reflection of a more limited long-range atmospheric transport potential of heavier PCBs, causing larger variability in air concentra-tions (and thus MMR) for these substances (Wania and Daly, 2002).
HCHs
The average concentration of 63HCHs (α, β, γ) was 64 pg m−3(SD±59 pg m−3). The concentration of63HCHs varied from 9–311 pg m−3, with γ-HCH andα-HCH con-tributing on average 55% and 41%, respectively. β-HCH, which was close to MDL in some samples (Table 1), was less abundant and contributed only 4% on average. The me-dian concentrations ofγ-HCH andα-HCH were similar, al-though the average concentration for γ-HCH (35 pg m−3)
was higher than forα-HCH (26 pg m−3). This illustrates a more homogenous distribution ofα-HCH in European back-ground air in comparison toγ-HCH, as also illustrated by the MMR for these two HCH isomers (Table 1). γ-HCH is less volatile thanα-HCH (Xiao et al., 2004), which in turn may help to explain observed differences in air concentrations and environmental fates between the two isomers (Breivik and Wania, 2002). The results forβ-HCH should be inter-preted with caution as several samples (N = 13) were below MDL (Table 1). However, the large spatial variability for this isomer (MMR>380) suggests a highly skewed distribution. This is noteworthy and may in part be attributed to the fact thatβ-HCH is much more water-soluble than the other two isomers and hence more easily subject to wash-out by rain in spite of a similar emission history toα-HCH (Li et al., 2002).
DDTs
The average concentration of 64DDTs was 32 pg m−3 (SD±62 pg m−3), and ranged from 1.1 pg m−3 to 356 pg m−3 with p,p′−DDE as the major contributing isomer (67% on average). The second most prominent isomer was p,p′−DDT with an average contribution of 18%. MMRs were all high within the group of DDTs and ranged from>143 (o,p′−DDT) to>240(p,p′−DDT).
PAHs
The average concentration of 68PAHs was 6 ng m−3 (SD±6 ng m−3) and ranged from 0.2–35 ng m−3. The more abundant PAHs include phenanthrene and fluorene
which each contributed on average 49% and 29%, respec-tively. As expected, the contribution from heavier PAHs, such as benz(a)anthracene, chrysene and benzo(a)pyrene, was typically low with average contributions of 0.35%. 1.2% and 0.14% to 68PAHs, respectively. This is also consistent with earlier studies (e.g. Halsall et al., 1994; Lohmann et al., 2000). MMR furthermore ranged from>15 (benzo(a)pyrene) to>153 (pyrene). The results for68PAHs compares favourably with similar results from the previ-ous European campaign by Jaward et al. (2004b), which re-ported a measured range between 0.004 and 26 ng m−3 for the same PAHs and also noted that lighter PAHs tended to dominate in the samples since they occur in the gas-phase and hence have higher ability for transport, while heav-ier PAHs (benzo(a)pyrene) are more related to the particle phase (Lohmann et al., 2000).
HCB
HCB was detected in all samples with an average concentra-tion of 49 pg m−3(SD±18 pg m−3; range: 23-115 pg m−3). The variability was limited with a MMR of 5, very similar to what has been previously reported for Europe (Jaward et al., 2004a). This has been interpreted as evidence of the long atmospheric lifetime of this volatile compound, combined with the absence of significant point sources of HCB in Europe (Jaward et al., 2004a). However, simi-lar studies in Asia have reported simi-larger variability, indica-tive of continuing emissions (Jaward et al., 2005). We also note that the range in air concentrations reported here (23– 115 pg m−3)are higher than previously reported for Europe (11–50 pg m−3)by Jaward et al. (2004a). Interestingly, a re-cent study on levels and trends of POPs in Arctic air suggest an increase in HCB in recent years, and attribute this to a potential increase in worldwide usage of certain pesticides contaminated with HCB (Hung et al., 2010).
Chlordanes
The average concentration for the 64chlordanes was 3.5 pg m−3 (SD±2.7 pg m−3). The concentrations varied from 0.2 pg m−3 to 19.4 pg m−3, with trans-nonachlor and cis-chlordane contributing 38% and 35%, respectively. The least abundant compound was cis-nonachlor with 5%. Con-centrations of individual chlordanes were typically low in comparison to the other substances studied and MMR ranged from>11 (cis-nonachlor) to>104 (trans-chlordane).
4.2 Duplicate passive air sampling and comparison with
active air sampling
a) b) c) 1 10 100 1000
Košetice C) n=3 Råö (S) (n=3) Aspvreten (S) (n=1)
p
g
/m
3
SnDDTs
PAS AAS d) 0.1 1 10
Košetice C) n=6 Råö (S) (n=3) Aspvreten (S) (n=5) Pallas (SF) (n=3)
n
g
/m
3
SnPAHs
PAS AAS e) f) 1 10 100 1000
Košetice C) Birkenes (N) Stórhöfdi(IS) Spitsbergen (N)
p g /m 3 HCB PAS AAS 1.0 10.0 100.0
Košetice C) Råö (S) Birkenes (N) Aspvreten (S)
Stórhöfdi (IS) Pallas (SF) Spitsbergen (N) p g /m 3 g-HCH PAS AAS 1 10 100 Košetice (CZ)
Råö (S) Birkenes (N) Aspvreten (S)
Stórhöfdi (IS)
Pallas (SF) Spitsbergen (N)
p
g
/m
3
a-HCH PAS
AAS
1 10 100
Košetice C) (n=7)
Råö (S) (n=7) Birkenes (N) (n=7) Aspvreten (S) n(=7) Stórhöfdi IS 0019R Pallas (SF) (n=6) Spitsbergen (N) (n=3) p g /m 3
SnPCBs
PAS AAS
Fig. 1. (a)–(f): Comparison of results obtained on the basis of PAS (average of two parallels) and AAS (see text for details).
(Koˇsetice, Pallas, St´orh¨ofdi, Birkenes, Spitsbergen, R˚a¨o, As-pvreten) (Aas and Breivik, 2008), see also Fig. S1. This was done to gain further insights into the reproducibility of the PAS method (e.g. Harner et al., 2006b) as further discussed in the Supplement (Supplement S1.6), and to evaluate possible differences between PAS and AAS results (e.g. Gouin et al., 2005a, b; Mari et al., 2008). Regrettably, one of the samplers from the Aspvreten site was lost. The comparison for this EMEP AAS site is thus restricted to one PAS sample only.
4.2.1 Passive air sampling in comparison with active
air samplers
One of the objectives of this study has been to further as-sess the potential of PAS as a complementary technique to conventional AAS within the EMEP monitoring program. For this purpose direct comparisons of results obtained on the basis of AAS and PAS have been carried out. Although such comparisons have been reported previously (Gouin et al., 2005a; Mari et al., 2008), past evaluations of this kind have typically been carried out on the basis of results ob-tained at the same chemical laboratory. In this work, AAS results are mainly obtained on the basis of results originating from different chemical laboratories, hence both intra and in-ter laboratory uncertainties must be taken into account. Ex-ceptions to this are the samples from the two Norwegian sites (Birkenes and Spitsbergen) which were both analyzed at the NILU laboratories. We should further note that the AAS monitoring strategies within EMEP vary in terms of both sampling durations and frequencies and hence temporal
cov-erage (Table S5). Only St´orh¨ofdi and R˚a¨o collect samples on a continuous basis, while Koˇsetice, Birkenes, Aspvreten, Pal-las and Spitsbergen have sampling coverage of less than 30% (Table S5). A direct comparison between AAS and PAS for the latter five EMEP sites is therefore difficult as the differ-ent samplers have been exposed to differdiffer-ent air masses. AAS and PAS sampling strategies are also fundamentally differ-ent as data obtained on the basis of AAS typically represdiffer-ent the sum of the particulate and gaseous air concentrations. Fi-nally, we note again that all results for Spitsbergen obtained on the basis of PAS in this study may be questioned as they rely on the default uptake rate (2.4).
Relative deviations for individual substances, expressed as (CPAS-CAAS)/CAAS, are additionally included in Table S5 whereby a positive deviation illustrates higher concentration in the PAS, relative to the AAS.
PCBs
The percentage deviation relative to AAS results varied from
−59% (Pallas) up to +86% (Koˇsetice) for6nPCBs, where n denotes the number of congeners (see Table S5). Larger rel-ative deviations were observed for some congeners and sites, such as PCBs 101 (+178%), 138 (257%) and 153 (193%) at Koˇsetice. One possible explanation for the large deviations seen at the Koˇsetice site is that the AAS is only operating one day per week (Table S5) and hence the air masses sampled deviate significantly between the AAS and the PAS. This ef-fect may be particularly significant at Koˇsetice as this site is located close to major source regions in Europe (Breivik et al., 2007). Air concentrations at this site may thus be ex-pected to fluctuate significantly over time as the air masses would be expected to be less well-mixed. This issue is fur-ther explored for PCB-28 in Sect. 4.4. However, if differ-ence in sampling coverage was the only factor to consider, significant deviations would also be expected at those other sites which do not operate the AAS on a continuous ba-sis (Birkenes, Aspvreten, Pallas and Spitsbergen). The best agreement between AAS and PAS for6nPCBs was obtained for Birkenes (−5%) (Table S5), which may be due to a com-bination of air concentrations being well above MDL and the fact that the samples being analyzed at the same chemical laboratory. The latter may indeed represent an important fac-tor to consider as it has recently been indicated that differ-ences up to a factor of 2 can be expected for atmospheric samples of semi-volatile organic compounds when compar-ing results from different laboratories (Su and Hung, 2010). It must be cautioned that this comparison is of limited signif-icance for Spitsbergen and Pallas as some PAS results were close to or below MDL (Table S5). For the latter site, a rel-atively large difference in the estimated uptake rate between the two PAS parallels was also noted (Supplement S1.6).
HCHs
α- andγ-HCH were reported for all sites (Fig. 1b,c). The percentage deviation relative to AAS for theα- andγ-HCH isomers ranged from−43% (Birkenes) to +318% (St´orh¨ofdi) and from −48% (Birkenes) to +85% (Koˇsetice) for these two isomers, respectively (Table S5). With the exception of Birkenes, Pallas and St´orh¨ofdi (latter only forγ-HCH), pos-itive deviations (CPAS>CAAS)were typically observed for these two isomers. For theα-HCH isomer, minor deviations were seen for R˚a¨o (+19%), Spitsbergen (+23%) and Pallas (−17%). Likewise, good agreement forγ-HCH was found for St´orh¨ofdi (−8%), Spitsbergen (+22%) and R˚a¨o (24%).
Given that the AAS at St´orh¨ofdi operates on a continuous basis (Table S5) it is difficult to offer an explanation for the large differences seen for α-HCH at but not forγ-HCH at this site. It is interesting to note that there are significant dif-ferences for both HCHs at Birkenes in spite of both AAS and PAS being analyzed at the same laboratory. Again, a plausi-ble explanation is that differences between AAS and PAS are caused by differences in sampling coverage as the sampling frequency at Birkenes is only one day per week (Table S5).
DDTs
As several DDTs were either not reported by AAS, or be-cause several results from PAS were found to be below MDL (Table S5, Fig. 1d), a comparison was only possible for Koˇsetice, R˚a¨o and Aspvreten. The percentage devia-tion for6nDDTs varies from−34% (Aspvreten) to +282% (Koˇsetice).
PAHs
For the same reasons as for the DDTs, the comparison for PAHs had to be carried out for a variable number of compounds (phenanthrene, anthracene, fluorathene, pyrene, benzo(a)pyrene, benz(a)anthracene) and limited to four sta-tions (Koˇsetice, R˚a¨o, Aspvreten and Pallas), see Fig. 1e. The percentage deviations relative to AAS for6nPAHs (Ta-ble S5) ranged from +45% (R˚a¨o) to +216% (Koˇsetice). The relative deviations for the individual PAHs were mostly pos-itive, except pyrene and benz(a)anthracene at Aspvreten, and benzo(a)pyrene at Koˇsetice. The best agreement between the two air sampling techniques was found for R˚a¨o and Pallas (+45% and +52% for6nPAHs, respectively).
HCB
Figure 2a)
S7PCBs (pg /m3)
Figure 2b)
S3HCHs (pg /m3)
Figure 2c)
S4DDTs (pg /m3)
Figure 2d)
S8PAHs (ng /m3)
Figure 2e)
HCB (pg/m3)
Figure 2f)
S4chlordanes (pg /m3)
Fig. 2. (a)–(f): Spatial patterns of67PCBs,63HCHs,64DDTs,68PAHs, HCB and64chlordanes in European background air.
4.3 Spatial patterns
As most EMEP monitoring stations reporting POPs in air are mainly located in the northwestern part of Europe (Aas and Breivik, 2008), an additional objective of this study was to evaluate potential limitations in the current EMEP measure-ment network with respect to spatial coverage. Improved spatial coverage is not only considered important to support relevant modelling activities within EMEP (e.g. Malanichev et al., 2004) and beyond, but it may also provide useful in-formation for future monitoring strategies within EMEP.
PCBs
(>50 pg m−3)were detected at sites in Belgium, Germany, Italy, the Netherland and Ukraine, while the highest concen-trations were observed at a site in Denmark (121 pg m−3). Whenever significantly elevated levels are measured at a spe-cific site, this may indicate an influence from one or more nearby sources as may be the case with the elevated levels seen at the Danish site.
HCHs
The spatial patterns for 63HCHs and individual HCHs across Europe are shown in Fig. 2b) and Fig. S4(a–c), re-spectively. HCHs are insecticides which have been exten-sively used in Europe (Breivik et al., 1999) and the rest of the world (e.g. Li et al., 1996, 1999). The results for
63HCHs shows a fairly consistent pattern with low levels (<20 pg m−3) at most Scandinavian and Arctic sites. Ele-vated levels (>200 pg m−3)were recorded at certain sites in France, Moldova and Ukraine. HCHs ultimately originate from the production and use of technical HCH (55–80%α -HCH, 2–16%β-HCH, 8–15%γ-HCH) or lindane (>99%γ -HCH) (Breivik et al., 1999). Hence, while the occurrence of
γ-HCH may be attributed to either technical HCH or lindane,
α- andβ-HCH were only major constituents in the technical mixture. In general terms, lindane usage tended to dominate in the western part of Europe, while technical HCH tended to dominate in the eastern part (Breivik et al., 1999). This pat-tern is also reflected in the results, whereby elevated levels of
α- andβ-HCH are mainly seen at some sites in the southeast-ern areas of Europe (Fig. S4a,b). Asβ-HCH is more easily washed out by rain thanα-HCH, elevated atmospheric con-centrations ofβ-HCH may hence be a more useful indicator to identify proximity to regions or areas that are affected by ongoing or past historical usage of technical HCH. Elevated levels ofγ-HCH tend to occur across central parts of Europe (Fig. S4c). Given the remoteness from key source areas, rel-atively high levels ofα-HCH are also observed at the sites in Iceland, Greenland and Spitsbergen, which may be seen as a reflection of the elevated long-range atmospheric transport potential of this isomer (Li et al., 2002; Wania and Mackay, 1996; Beyer et al., 2000).
DDTs
The spatial patterns of 64DDTs and individual DDTs are presented in Fig. 2c and Fig. S5a–d), respectively. The technical mixture of DDT contains up to 80–85% of the p,p′−DDT isomer and only small amounts of the
o,p′−DDT isomer (15–20%) (Motelay-Massei et al., 2005) and was banned in European countries during the 1970s and 1980s (Pacyna et al., 2003). Levels of64DDTs were generally low and frequently below the MDL in North-ern Europe but with increasing air concentrations towards Central and Eastern Europe (Fig. 2c). Concentrations of
64DDTs above 100 pg m−3 occurred at sites in the Czech Republic, Greece, Hungary, Moldova, Poland and Ukraine (Fig. 2c). The spatial pattern for individual isomers (Fig. S5) generally reflected that of 64DDTs, although absolute air concentrations varied. A p,p′−DDE/p,p′−DDT ratio lower than 1 has been proposed as an indication of fresh use of technical DDT (Pozo et al., 2006). This ratio is shown in Fig. S5e). Jaward (2004a) previously noted low
p,p′−DDE/p,p′−DDT ratios in European air, which sug-gest a fresh p,p′−DDT signal. This is in contrast to our results four years later, which indicates a more weath-ered signal with an average ratio of 3.8 (range 0.9–8.5) (Fig. S5e). A ratio higher than 1 is also in better accordance with observations based on AAS from various EMEP sites (Koˇsetice, Pallas, Storh¨ofdi, Spitsbergen and R˚a¨o) which´
show a mean value for this ratio in the range between 1.3 and 10.9 during 2006 (Aas and Breivik, 2008). The ra-tio o,p′−DDT/p,p′−DDT (Fig. S5f) has previously been used to evaluate possible influence from dicofol, a miti-cide which contains 10% of theo,p′−DDT isomer (Becker, 2008; Gillespie et al., 1994; Qiu et al., 2005). Several countries in Europe (e.g. Italy, United Kingdom, Spain and Turkey) utilize dicofol in agriculture (Gillespie et al., 1994; Turgut et al., 2009). This study confirms several sites which had higher values for the o,p′−DDT isomer in compari-son to the p,p′−DDT isomer. The average ratio (±SD) was 0.86±0.26 and spanned from 0.3–1.6 which may sug-gest some influence from dicofol at certain sites. A ratio higher than 1 was found at sites in Austria, Denmark, Fin-land, France, IreFin-land, Italy, Kazakhstan, Lithuania, Moldova, the Netherlands, Norway, Poland, Sweden and United King-dom (Fig. S5f).
PAHs
Figure 2d shows the spatial pattern for 68PAHs across Europe (see also Fig. S6). PAHs are by-products from incomplete combustion processes with many different sources (Lohmann et al., 2000). No clear trend in spatial pat-terns could be found, and it seems likely that the sites which are experiencing elevated concentrations are mainly affected by local sources. Hence, many of the sites included may not be considered true background sites with respect to PAHs. Elevated concentrations of68PAHs (>20 ng m−3)where ob-served at sites in Finland, Greece, the Netherlands and Spain (Fig. 2d).
HCB
al., 2004a) concentrations are relatively uniform across Eu-rope. Elevated air concentrations (>100 pg m−3)occurred at four sites, two of which are found at high elevation (Sum-mit, Spitsbergen). Yet, as the uptake rate for these two sites rely on the default value, we suspect air concentrations may have been overestimated as the true uptake rates at these ex-posed sites may have been underestimated due to wind speed effects (Tuduri et al., 2006).
Chlordanes
The spatial pattern for64chlordanes is presented in Fig. 2f), and for individual compounds in Fig. S7. The technical mixture of chlordane consists mainly of trans-chlordane, cis-chlordane and trans-nonachlor (Sovocool et al., 1977; Dearth and Hites, 1990). Chlordane were formerly used in agriculture as an insecticide and termiticide up to the mid 1980s (Bidleman et al., 2002). The levels of the individual chlordanes were typically low and several sites were below MDL. The predominating compounds were trans-chlordane and trans-nonachlor, while cis-nonachlor were found at low-est levels. Elevated levels of 64chlordanes (>10 pg m−3) were found at sites in Belgium, Greece and the Nether-lands. The trans-chlordane/cis-chlordane (TC/CC) ratio is 1.56 in the technical chlordane mixture (Bidleman et al., 2002). trans-chlordane is more easily degraded than cis-chlordane in the environment and ratio values for TC/CC close to 1 implies a weathered signal. Consequently elevated ratios may indicate fresh usage of technical chlordane (Pozo et al., 2004). The average ratio (±SD) was 0.5±0.4 and spanned from 0.03–2.6. Sites with a ratio>1.56 were found in Moldova (1.57), the Netherlands (1.61, 1.63) and Malta (2.58).
4.4 Model evaluations
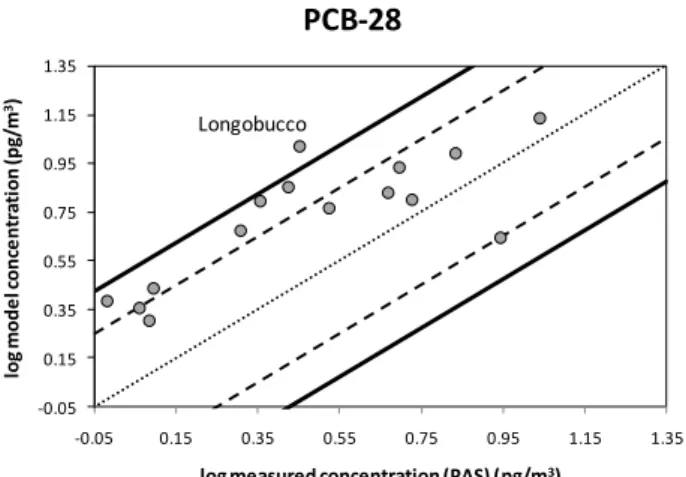
The atmospheric transport model FLEXPART was used in a time-reverse mode to identify the source regions respon-sible for the PCB-28 loading at the respective sampling site in addition the meteorological parameters driving the trans-port. In contrast to classical trajectory calculations (Gouin et al., 2005a) turbulence, convection and removal processes (dry and wet deposition, reaction with OH) are taken into account. In this manner the source regions for each sample can be identified and an emission sensitivity (ES) map can be derived. Combining this information with the PCB-28 emis-sion inventory (Breivik et al., 2007) a concentration for each receptor can be predicted, resulting in a emission contribu-tion (EC) map. We selected PCB-28 to illustrate the model approach as (a) unlike several compounds included in this study, PCB-28 exists solely in the gaseous state in the at-mosphere, and (b) a spatially resolved emission inventory is available which is essential as model input. The model was run for 17 of the sites included in this study, including all
Longobucco
-0.05 0.15 0.35 0.55 0.75 0.95 1.15 1.35
-0.05 0.15 0.35 0.55 0.75 0.95 1.15 1.35
lo
g
m
o
de
l c
o
nc
e
nt
ra
ti
o
n
(pg
/m
3)
log measured concentration (PAS) (pg/m3)
PCB-28
Fig. 3.Modelled versus observed (PAS) air concentrations for PCB-28 at selected sites. The dashed and solid lines represent agreement within a factor of 2 and 3, respectively.
EMEP AAS to also facilitate a comparison between model and measurements derived using on the basis of both AAS and PAS. Table S6 presents the sites along with predicted and observed concentrations, including percentage deviation between model and PAS measurement results, while Fig. 3 shows the modelled versus observed air concentrations, both expressed on a logarithmic basis. The agreement between PAS and model results were found to be within a factor of 3 for 16 out of 17 sites (solid black lines), with most re-sults within a factor of 2 (dashed lines). It is possible that the overestimation of the model is caused by too high emis-sions in the inventory. The overall results also show that the model predicted values in comparison to AAS results which were∼2–3 times higher at four out of seven sites (Koˇsetice, Birkenes, R˚a¨o, Aspvreten) and ∼2–12 times lower for the other sites (Pallas, St´orh¨ofdi, Spitsbergen) (Table S6).
Figure 4b)
Figure 4d) Figure 4a)
Figure 4c)
ES [ns/m3]
EC 1E-12 [pg/m5] EC 1E-12 [pg/m5]
ES [ns/m3]
Fig. 4.(a-d): Maps of Footprint ES (emission sensitivity)(a),(b)and EC (emission contribution)(c),(d)for PCB-28 for the PAS sampling period at Birkenes(a),(c)and Koˇsetice(b),(d)(see text for details).
(2.98 pg m−3)of the average air concentration derived for the PAS deployment period. For Koˇsetice it thus seems likely that some of the discrepancy may be better explained by other factors, such as a tendency for the model to overesti-mate air concentrations as noted above and/or due to inter-laboratory differences. The latter explanation cannot be the reason for Birkenes as both AAS and PAS were analyzed at the same laboratory.
In a recent study by Eckhardt et al. (2009) the same method was used in order to identify source regions con-tributing to the loadings of PCB-28 at the Birkenes site (for sampling times of 24 h). Again, Koˇsetice and Birkenes (Fig. 4), where chosen for further discussion of the model results, while additional model results can be found in the Supplement (Figs. S8 to S22). As the air masses controlling observed air concentrations are expected to differ between PAS and AAS results, we have additionally included results representing AAS sampling times alone for the Koˇsetice and Birkenes sites in Figs. S23–S24. Yet, these results were
of PCB-28 are controlled by primary emissions alone. This assumption may be criticized as it is well established that PCBs have the potential to undergo reversible atmospheric deposition. For example, soils have a large capacity to re-tain PCBs (Meijer et al., 2003) and several recent studies have indicated that lower molecular weight PCBs may be subject to significant re-volatilization from urban and indus-trial soils, following reductions in primary emissions (Li et al., 2010; Ruzickova et al., 2008). At the same time, Li et al. (2010) also conclude that air concentrations at remote and background sites were mostly influenced by primary sources, which is both in agreement with long-term time trends of PCBs in European background air (Schuster et al., 2010) and in line with the model assumptions made herein.
5 Conclusions
This study presents new data on the spatial pattern of selected POPs in European background air. As illustrated for PCB-28, these data are expected to be of significant value for future attempts to evaluate relevant atmospheric fate and transport models for Europe, both within EMEP and beyond. The re-sults combined further illustrates that PAS may complement future monitoring strategies within the EMEP program. The observed spatial variability of POPs in air also highlighted limitations of the current EMEP measurement network with respect to spatial coverage. Finally, we conclude that co-ordinated PAS campaigns may have the potential to serve as useful inter-comparison exercises within and across ex-isting monitoring networks which could complement inter-laboratory comparison studies.
Supplementary material related to this article is available online at:
http://www.atmos-chem-phys.net/11/1549/2011/
acp-11-1549-2011-supplement.zip.
Acknowledgements. The authors thank Tom Harner, Eva Brorstr¨om-Lund´en, and Ivan Holoubek for advice and colleagues at NILU (S. Manø, A. Borgen, H. Gundersen, M. Ghebremeskel, A. G. Hjellbrekke and S. E. Walker) for support. We would also like to thank the volunteers within and outside the European Monitoring and Evaluation Programme (EMEP) for their valuable assistance in the field. Isabel Bey has provided the OH fields and the Norwegian MetOffice have given us access to the ECMWF data. This study received financial support from the Research Council of Norway (183437/S30), EMEP and the Nordic Council of Ministers. Lancaster University acknowledge financial support from the UK Department of Food and Rural Affairs for research and monitoring work on persistent organic pollutants.
Edited by: H. C. Hansson
References
Aas, W. and Breivik, K.: Heavy metals and POPs measurements, 2006 Co-operative programme for monitoring and evaluation of long range transmission of air pollutants in Europe (EMEP), NILU, Kjeller, 2008.
Aas, W. and Breivik, K.: Heavy metals and POP measurements 2007, Co-operative programm for monitoring and evaluation of long-range transmissions of air pollutants in Europe, NILU, KjellerO-95038/O-99050, 3-117, 2009.
Bailey, R. E.: Global hexachlorobenzene emissions, Chemosphere, 43, 167–182, 2001.
Barber, J. L., Sweetman, A. J., van Wijk, D., and Jones, K. C.: Hexachlorobenzene in the global environment: Emissions, lev-els, distribution, trends and processes, Sci. Total Environ., 349, 1–44, doi:10.1016/j.sciotenv.2005.03.014, 2005.
Bartkow, M. E., Jones, K. C., Kennedy, K. E., Holling, N., Hawker, D. W., and M¨uller, J. F.: Evaluation of performance reference compounds in polyethylene-based passive air samplers, Environ. Pollut., 144, 365–370, doi:10.1016/j.envpol.2005.12.043, 2006a. Bartkow, M. E., Kennedy, K. E., Huckins, J. N., Holling, N., Ko-marova, T., and M¨uller, J. F.: Photodegradation of polyaro-matic hydrocarbons in passive air samplers: Field testing dif-ferent deployment chambers, Environ. Pollut., 144, 371–376, doi:10.1016/j.envpol.2005.12.050, 2006b.
Becker, S.: Trends and behaviour of semi-volatile organic com-pounds in the Artic Atmosphere, Ph.D., Environmental Science Department, Lancaster University, Lancaster, UK, 2008. Beyer, A., Mackay, D., Matthies, M., Wania, F., and Webster, E.:
Assessing long-range transport potential of persistent organic pollutants, Environ. Sci. Technol., 34, 699–703, 2000.
Bidleman, T. F., Jantunen, L. M. M., Helm, P. A., Brorstrom-Lunden, E., and Juntto, S.: Chlordane enantiomers and temporal trends of chlordane isomers in arctic air, Environ. Sci. Technol., 36, 539–544, doi:10.1021/es011142b, 2002.
Breivik, K. and Wania, F.: Mass budgets, pathways, and equi-librium states of two hexachlorocyclohexanes in the Baltic Sea environment, Environ. Sci. Technol., 36, 1024–1032, doi:10.1021/es001972+, 2002.
Breivik, K., Pacyna, J. M., and Munch, J.: Use of alpha-, beta-and gamma-hexachlorocyclohexane in Europe, 1970–1996, Sci. Total. Environ., 239, 151–163, 1999.
Breivik, K., Sweetman, A., Pacyna, J. M., and Jones, K. C.: To-wards a global historical emission inventory for selected PCB congeners – A mass balance approach-3. An update, Sci. To-tal Environ., 377, 296–307, doi:10.1016/j.scitotenv.2007.02.026, 2007.
Chaemfa, C., Barber, J. L., Gocht, T., Harner, T., Holoubek, I., Klanova, J., and Jones, K. C.: Field calibration of polyurethane foam (PUF) disk passive air samplers for PCBs and OC pesticides, Environ. Pollut., 156, 1290–1297, doi:10.1016/j.envpol.2008.03.016, 2008.
Chaemfa, C., Barber, J. L., Kim, K. S., Harner, T., and Jones, K. C.: Further studies on the uptake of persistent organic pollutants (POPs) by polyurethane foam disk passive air samplers, Atmos. Environ., 43, 3843–3849, doi:10.1016/j.atmosenv.2009.05.020, 2009a.
air samplers used for persistent organic pollutants, J. Environ. Monit., 11, 1135–1139, doi:10.1039/b823016a, 2009b.
Dearth, M. A. and Hites, R. A.: Highly chlorinated dimethanofluo-renes in technical chlordane and in human adipose-tissue, J. Am. Soc. Mass. Spectr., 1, 99–103, 1990.
Eckhardt, S., Breivik, K., Li, Y. F., Manø, S., and Stohl, A.: Source regions of some persistent organic pollutants measured in the at-mosphere at Birkenes, Norway, Atmos. Chem. Phys., 9, 6597– 6610, doi:10.5194/acp-9-6597-2009, 2009.
Gillespie, M. J., Lythgo, C. M., Plumb, A. D., and Wilkins, J. P. G.: A survey comparing the chemical composition of dicofol formu-lations sold in the UK before and after the introduction of the EC prohibition directive 79/117/EEC, Pestic. Sci., 42, 305–314, 1994.
Gouin, T., Harner, T., Blanchard, P., and Mackay, D.: Passive and active air samplers as complementary methods for investigating persistent organic pollutants in the Great Lakes basin, Environ. Sci. Technol., 39, 9115–9122, doi:10.1021/ES051387f, 2005a. Gouin, T., Harner, T., Daly, G. L., Wania, F., Mackay, D., and
Jones, K. C.: Variability of concentrations of polybrominated diphenyl ethers and polychlorinated biphenyls in air: implica-tions for monitoring, modeling and control, Atmos. Environ., 39, 151–166, doi:10.1016/j.atmosenv.2004.09.022, 2005b.
Gouin, T., Wania, F., Ruepert, C., and Castillo, L. E.: Field testing passive air samplers for current use pesticides in a tropical environment, Environ. Sci. Technol., 42, 6625–6630, doi:10.1021/es8008425, 2008.
Halsall, C. J., Coleman, P. J., Davis, B. J., Burnett, V., Waterhouse, K. S., Hardingjones, P., and Jones, K. C.: Polycyclic aromatic-hydrocarbons in UK urban air, Environ. Sci. Technol., 28, 2380– 2386, 1994.
Harju, M., Haglund, P., and Naikwadi, K., P: Gas-chromatographic properties of the 209 PCB congeners on non-polar, chiral and liquid-crystal columns, Organohalogen compounds, 35, 111– 114, 1998.
Harner, T. and Bidleman, T. F: Measurement of octanol-air partition coefficients for polychlorinated biphenyls, J. Chem. Eng. Data, 41, 895–899, 1996.
Harner, T., Shoeib, M., Diamond, M., Stern, G., and Rosenberg, B.: Using passive air samplers to assess urban – Rural trends for persistent organic pollutants. 1. Polychlorinated biphenyls and organochlorine pesticides, Environ. Sci. Technol., 38, 4474– 4483, doi:10.1021/es040302r, 2004.
Harner, T., Bartkow, M., Holoubek, I., Klanova, J., Wania, F., Gioia, R., Moeckel, C., Sweetman, A. J., and Jones, K. C.: Passive air sampling for persistent organic pollutants: Introduc-tory remarks to the special issue, Environ. Pollut., 144, 361–364, doi:10.1016/j.envpol.2005.12.044, 2006a.
Harner, T., Pozo, K., Gouin, T., Macdonald, A. M., Hung, H., Cainey, J., and Peters, A.: Global pilot study for persistent or-ganic pollutants (POPs) using PUF disk passive air samplers, En-viron. Pollut., 144, 445–452, doi:10.1016/j.envpol.2005.12.053, 2006b.
Harner, T., Shoeib, M., Diamond, M., Ikonomou, M., and Stern, G.: Passive sampler derived air concentrations of PBDEs along an urban-rural transect: Spatial and temporal trends, Chemosphere, 64, 262–267, doi:10.1016/j.chemosphere.2005.12.018, 2006c. Hayward, S. J., Gouin, T., and Wania, F.: Comparison of Four
Active and Passive Sampling Techniques for Pesticides in Air,
Environ. Sci. Technol., 44, 3410–3416, doi:10.1021/es902512h, 2010.
Huckins, J. N., Petty, J. D., Lebo, J. A., Almeida, F. V., Booij, K., Alvarez, D. A., Clark, R. C., and Mogensen, B. B.: Development of the permeability/performance reference compound approach for in situ calibration of semipermeable membrane devices, En-viron. Sci. Technol., 36, 85–91, doi:10.1021/es010991w, 2002. Hung, H., Kallenborn, R., Breivik, K., Su, Y., Brorstr¨om-Lund´en,
E., Olafsdottir, K., Thorlacius, J. M., Lepp¨anen, S., Bossi, R., Skov, H., Manø, S., Patton, G. W., Stern, G., Sverko, E., and Fellin, P.: Atmospheric monitoring of organic pollutants in the Arctic under the Arctic Monitoring and Assessment Programme (AMAP): 1993–2006, Sci. Total Environ., in press, Corrected Proof, doi:10.1016, 2010.
Jaward, F. M., Farrar, N. J., Harner, T., Sweetman, A. J., and Jones, K. C.: Passive air sampling of PCBs, PBDEs, and organochlo-rine pesticides across Europe, Environ. Sci. Technol., 38, 34–41, doi:10.1021/es034705n, 2004a.
Jaward, F. M., Farrar, N. J., Harner, T., Sweetman, A. J., and Jones, K. C.: Passive air sampling of polycyclic aromatic hydrocarbons and polychlorinated naphthalenes across Europe, Environ. Toxi-col. Chem., 23, 1355–1364, 2004b.
Jaward, T. M., Zhang, G., Nam, J. J., Sweetman, A. J., Obbard, J. P., Kobara, Y., and Jones, K. C.: Passive air sampling of polychlo-rinated biphenyls, organochlorine compounds, and polybromi-nated diphenyl ethers across Asia, Environ. Sci. Technol., 39, 8638–8645, doi:10.1021/es051382h, 2005.
Kennedy, K., Hawker, D. W., Bartkow, M. E., Carter, S., Ishikawa, Y., and Mueller, J. F.: The potential effect of differential ambient and deployment chamber temperatures on PRC derived sampling rates with polyurethane foam (PUF) passive air samplers, En-viron. Pollut., 158, 142–147, doi:10.1016/j.envpol.2009.07.031, 2010.
Klanova, J., Eupr, P., Kohoutek, J., and Harner, T.: Assessing the influence of meteorological parameters on the performance of polyurethane foam-based passive air samplers, Environ. Sci. Technol., 42, 550–555, doi:10.1021/es072098o, 2008.
Li, N. Q., Wania, F., Lei, Y. D., and Daly, G. L.: A comprehensive and critical compilation, evaluation, and selection of physical-chemical property data for selected polychlorinated biphenyls, J. Phys. Chem. Ref. Data., 32, 1545–1590, doi:10.1063/1.1562632, 2003.
Li, Y. F.: Global technical hexachlorocyclohexane usage and its contamination consequences in the environment: from 1948 to 1997, Sci. Total. Environ., 232, 121–158, 1999.
Li, Y. F., McMillan, A., and Scholtz, M. T.: Global HCH usage with 1 degrees x1 degrees longitude/latitude resolution, Environ. Sci. Technol., 30, 3525–3533, 1996.
Li, Y. F., Macdonald, R. W., Jantunen, L. M. M., Harner, T., Bidleman, T. F., and Strachan, W. M. J.: The transport of beta-hexachlorocyclohexane to the western Arctic Ocean: a contrast to alpha-HCH, Sci. Total Environ., 291, 229–246, 2002. Li, Y. F., Harner, T., Liu, L. Y., Zhang, Z., Ren, N. Q., Jia, H.
L., Ma, J. M., and Sverko, E.: Polychlorinated Biphenyls in Global Air and Surface Soil: Distributions, Air-Soil Exchange, and Fractionation Effect, Environ. Sci. Technol., 44, 2784–2790, doi:10.1021/es901871e, 2010.
2003.
Lohmann, R., Northcott, G. L., and Jones, K. C.: Assessing the contribution of diffuse domestic burning as a source of PCDD/Fs, PCBs, and PAHs to the UK atmosphere, Environ. Sci. Technol., 34, 2892–2899, doi:10.1021/es991183w, 2000.
Malanichev, A., Mantseva, E., Shatalov, V., Strukov, B., and Vu-lykh, N.: Numerical evaluation of the PCBs transport over the Northern Hemisphere, Environ. Pollut., 128, 279–289, doi:10.1016/j.envpol.2003.08.040, 2004.
Mari, M., Schuhmacher, M., Feliubadalo, J., and Domingo, J. L.: Air concentrations of PCDD/Fs, PCBs and PCNs using ac-tive and passive air samplers, Chemosphere, 70, 1637–1643, doi:10.1016/j.chemosphere.2007.07.076, 2008.
Meijer, S. N., Ockenden, W. A., Sweetman, A., Breivik, K., Gri-malt, J. O., and Jones, K. C.: Global distribution and budget of PCBs and HCB in background surface soils: Implications or sources and environmental processes, Environ. Sci. Technol., 37, 667–672, doi:10.1021/es025809l, 2003.
Moeckel, C., Harner, T., Nizzetto, L., Strandberg, B., Lindroth, A., and Jones, K. C.: Use of Depuration Compounds in Passive Air Samplers: Results from Active Sampling-Supported Field De-ployment, Potential Uses, and Recommendations, Environ. Sci. Technol., 43, 3227–3232, doi:10.1021/es802897x, 2009. Motelay-Massei, A., Harner, T., Shoeib, M., Diamond, M., Stern,
G., and Rosenberg, B.: Using passive air samplers to assess urban-rural trends for persistent organic pollutants and poly-cyclic aromatic hydrocarbons. 2. Seasonal trends for PAHs, PCBs, and organochlorine pesticides, Environ. Sci. Technol., 39, 5763–5773, doi:10.1021/es0504183, 2005.
Pacyna, J. M., Breivik, K., Munch, J., and Fudala, J.: European atmospheric emissions of selected persistent organic pollutants, 1970–1995, S119–S131, 2003.
Pozo, K., Harner, T., Shoeib, M., Urrutia, R., Barra, R., Parra, O., and Focardi, S.: Passive-sampler derived air concentrations of persistent organic pollutants on a north-south transect in Chile, Environ. Sci. Technol., 38, 6529–6537, doi:10.1021/es049065i, 2004.
Pozo, K., Harner, T., Wania, F., Muir, D. C. G., Jones, K. C., and Barrie, L. A.: Toward a global network for persistent organic pollutants in air: Results from the GAPS study, Environ. Sci. Technol., 40, 4867–4873, doi:10.1021/es060447t, 2006. Pozo, K., Harner, T., Lee, S. C., Wania, F., Muir, D. C. G., and
Jones, K. C.: Seasonally Resolved Concentrations of Persis-tent Organic Pollutants in the Global Atmosphere from the First Year of the GAPS Study, Environ. Sci. Technol., 43, 796–803, doi:10.1021/es802106a, 2009.
Qiu, X. H., Zhu, T., Yao, B., Hu, J. X., and Hu, S. W.: Contribution of dicofol to the current DDT pollution in China, Environ. Sci. Technol., 39, 4385–4390, doi:10.1021/es050342a, 2005. Ruzickova, P., Klanova, J., Cupr, P., Lammel, G., and
Holoubek, I.: An assessment of air-soil exchange of polychlo-rinated biphenyls and organochlorine pesticides across Central and Southern Europe, Environ. Sci. Technol., 42, 179–185, doi:10.1021/es071406f, 2008.
Santiago, E. C. and Cayetano, M. G.: Polycyclic aromatic hydrocar-bons in ambient air in the Philippines derived from passive sam-pler with polyurethane foam disk, Atmos. Environ., 41, 4138– 4147, doi:10.1016/j.atmosenv.2007.01.021, 2007.
Schuster, J. K., Gioia, R., Breivik, K., Steinnes, E., Scheringer, M.,
and Jones, K. C.: Trends in European Background Air Reflect Reductions in Primary Emissions of PCBs and PBDEs, Environ. Sci. Technol., 44, 6760–6766, doi:10.1021/es101009x, 2010. Seibert, P. and Frank, A.: Source-receptor matrix calculation with a
Lagrangian particle dispersion model in backward mode, Atmos. Chem. Phys., 4, 51–63, doi:10.5194/acp-4-51-2004, 2004. Shoeib, M. and Harner, T.: Using measured octanol-air partition
coefficients to explain environmental partitioning of organochlo-rine pesticides, 21, 984–990, 2002a.
Shoeib, M. and Harner, T.: Characterization and comparison of three passive air samplers for persistent organic pollutants, En-viron. Sci. Technol., 36, 4142–4151, doi:10.1021/es020635t, 2002b.
Sovocool, G. W., Lewis, R. G., Harless, R. L., Wilson, N. K., and Zehr, R. D.: Analysis of technical chlordane by gas chromatog-raphy mass spectrometry., Anal. Chem., 49, 734–740, 1977. Stohl, A., Hittenberger, M., and Wotawa, G.: Validation of the
Lagrangian particle dispersion model FLEXPART against large-scale tracer experiment data, Atmos. Environ., 32, 4245–4264, 1998.
Stohl, A. and Thomson, D. J.: A density correction for Lagrangian particle dispersion models, Bound.-Lay. Meteorol., 90, 155–167, 1999.
Stohl, A., Forster, C., Eckhardt, S., Spichtinger, N., Huntrieser, H., Heland, J., Schlager, H., Wilhelm, S., Arnold, F., and Cooper, O.: A backward modeling study of intercontinental pollution transport using aircraft measurements, J. Geophys. Res.-Atmos., 108(18), 4370, doi:10.1029/2002jd002862, 2003.
Stohl, A., Forster, C., Frank, A., Seibert, P., and Wotawa, G.: Technical note: The Lagrangian particle dispersion model FLEXPART version 6.2, Atmos. Chem. Phys., 5, 2461–2474, doi:10.5194/acp-5-2461-2005, 2005.
Su, Y. S. and Hung, H. L.: Inter-laboratory comparison study on measuring semi-volatile organic chemicals in stan-dards and air samples, Environ. Pollut., 158, 3365–3371, doi:10.1016/j.envpol.2010.07.041, 2010.
Tuduri, L., Harner, T., and Hung, H.: Polyurethane foam (PUF) disks passive air samplers: Wind effect on sampling rates, En-viron. Pollut., 144, 377–383, doi:10.1016/j.envpol.2005.12.047, 2006.
Turgut, C., Gokbulut, C., and Cutright, T. J.: Contents and sources of DDT impurities in dicofol formulations in Turkey, Environ. Sci. Pollut. R., 16, 214–217, doi:10.1007/s11356-008-0083-3, 2009.
The 1998 Aarhus Protocol on persistant organic pollutants (POPs): United Nations Economics Commission for Europe: http://www. unece.org/env/lrtap/welcome.html, 1998.
Vallack, H. W., Bakker, D. J., Brandt, I., Brostrom-Lunden, E., Brouwer, A., Bull, K. R., Gough, C., Guardans, R., Holoubek, I., Jansson, B., Koch, R., Kuylenstierna, J., Lecloux, A., Mackay, D., McCutcheon, P., Mocarelli, P., and Taalman, R. D. F.: Con-trolling persistent organic pollutants – what next?, Environ. Tox-icol. Pharmacol., 6, 143–175, 1998.
Wania, F. and Mackay, D.: Tracking the distribution of persistent or-ganic pollutants, Environ. Sci. Technol., 30, A390–A396, 1996. Wania, F. and Daly, G. L.: Estimating the contribution of
degrada-tion in air and deposidegrada-tion to the deep sea to the global loss of PCBs, Atmos. Environ., 36, 5581–5593, 2002.
C.: Passive sampling survey of polybrominated diphenyl ether flame retardants in indoor and outdoor air in Ottawa, Canada: Implications for sources and exposure, Environ. Sci. Technol., 38, 5312–5318, doi:10.1021/es049260x, 2004.


![Figure 4b) Figure 4d)Figure 4a)Figure 4c)ES [ns/m3] EC 1E-12 [pg/m 5 ] EC 1E-12 [pg/m 5 ]ES [ns/m3]](https://thumb-eu.123doks.com/thumbv2/123dok_br/16357665.190013/12.892.206.689.102.629/figure-figure-figure-figure-es-ec-ec-es.webp)
