The Role and Issues of Clustering
Technique in Designing Maintainable
Object Oriented System
A. K. Malviya1, Vibhooti Singh2
A. K. Malviya is an Associate Prof. in the Department of Computer Science & Engineering, Kamla Nehru Institute of Technology, Sultanpur, KNIT, U.P, INDIA. Email: [email protected] Vibhooti Singh is Sr. Lecturer in the department of Computer Science & Engineering , Prasad institute of
Technology, Jaunpur,PIT, U.P,INDIA. Email: [email protected]
Abstract:
Object Oriented Software development technique has become very popular and is being used by most of the software development companies. Although maintenance may be turn out to be easier for Object Oriented System. But it is unlikely that the maintenance burden will be completely disappearing. It has always been a crucial issue for software project developers. Still, maintenance consumes a large portion of software development cost. Therefore it is worthwhile to develop Object Oriented System keeping maintainability as a key issue in design phase. This paper investigates the use of clustering technique of data mining in maintenance of software system using object oriented metrics. The presented work evaluates the K-means clustering method by applying it to the commercial software system. The experimental work of software maintenance for the sample data is being simulated on Matlab.
Keywords: Software maintenance, Data mining, K-means clustering algorithm, Object-Oriented metrics.
1. Introduction:
Software maintenance is a time consuming and expensive phase of a software development life cycle. Maintenance has often taken a back seat where software development is concerned. However, once software is delivered it gets maintained for the rest of its useful life. Maintenance business has a big share in software industry. The ever-increasing growth in development of hardware, research and software environment demands of various types of user communities call for frequent maintenance of software systems.
Software quality can be defined as the totality of features and characteristics of a product that could satisfy a given set of requirements. In ISO 9126, software quality is described as a combination of six factors; functionality, reliability, efficiency, usability, maintainability and portability. Maintainability is one of the main criteria, characteristics or contributing attributes towards quality. IEEE [5] defines maintainability as “the ease with which a software system or component can be modified to correct faults, improve performance or other attributes, or adapt to a changed environment.
It is seen that many resources are spent on software maintenance. Software maintenance is one of the most costly activities even in object oriented development era. There are several ways to control the cost of maintenance. One of the popular approaches to control maintenance cost is to utilize software metrics during the development phase. Numerous studies have been done to establish the relationships between object oriented metrics and maintainability. These metrics can be used as predictors of maintenance effort [7], [8], [12], [13], [14]. The researchers have used many different techniques, i.e., statistical and neural network to establish the relationship and predicting maintenance effort.
next Section provides overview of related work. The subsequent sections illustrate K-means clustering approach with its metrics studied followed by simulation of the result. Observations and conclusion are presented at last.
2. Related Work:
The term Data mining refers to extracting or “mining” knowledge from large amounts of data. It is applicable in virtually every situation in which users have a huge amount of raw data and there exists a need to turn such data into useful information and knowledge.
In recent years, data mining clustering technique are used in software maintenance [1], [2], [6], [10], [11]. [Program comprehension is a time-consuming activity in software maintenance. A large number of researches have been conducted in the area of program comprehension over last few decades. The design recovery techniques are used to produce abstractions that facilitae the understanding of the system. It is useful in reengineering and maintaining large legacy systems. Oca et. al. in [10] have been presented an approach to design recovery based on data mining. This approach derives from the observation that data mining can discover unsupervised non-trivial relationships among elements in large databases.
Rousidis et al. in [11] have been presented a methodology for clustering information extracted from Java source code aiming at capturing program structures and achieving better program understanding. A partitioned cluster algorithm for software measurement data analysis using K-Attracters was presented in [6].
3. K-means Clustering Approach:
The main objective of clustering is to place record into disjoint groups. These records in a group are similar to each other and dissimilar to records of other groups. K-means clustering algorithm is generally used partitioning algorithm. It uses Euclidean distance measure to compute distance between two objects in Euclidean space. The Euclidean distance between points rj and rk in n-dimensional space is calculated as
Distance (rj,rk)=sqrt(|rj1-rk1|2+|rj2-rk2|2+…..|rjn-rkn|2)
The algorithm begins by randomly choosing k records to represent the centriods (means) m1, m2,….mk of the clusters c1, c2, …. Ck. All the records are placed in a given cluster based on the distance between the record and cluster mean. If the distance between mi and record rj is the smallest among all cluster means, then record rj is placed in cluster ci. Once all records have been initially placed in cluster, the mean for each cluster is recomputed. Then the process repeats by examining each record again and placing it in the cluster whose mean is closest. The terminating condition is usually the squared-error criterion. For clusters ci, . . . . ck with mean m1, m2, . . . . mk, the squared error criterion is defined as follows [4]:
4. Empirical Data Collection:
This investigation is being made to show the use of K-means clustering technique in evaluation of software maintenance. The presented work is being designed and developed in commercial software product User Interface Management System (UIMS) with classic Ada[7]. This UIMS system contains 39 classes. The selected object oriented metrics used in this work are given in the sub-section.
4.1 Selected Object Oriented Metrics: Demarco’s once said, “One can neither predict nor control what he can not measure”. The use of metrics (measurement data) provides a systematic approach for maintainability evaluation. It also enables the engineers of a system to track status, identify potential problematic areas and make decisions related to their tasks. One approach to control the maintenance costs is to utilize software metrics during software development phase [6], [14]. The following metrics are studied in this work:
Weighted Methods per Class (WMC): WMC measures the overall complexity of the class. It is the sum of the all complexities of its methods [3].
Depth of Inheritance Tree (DIT): DIT of a class in an inheritance hierarchy is the maximum length from the class node to the root of the tree. It provides for each class a measure of the inheritance levels from the object hierarchy top [3].
Number Of Children (NOC): It counts the no. of classes which inherit a particular class. It measures the number of immediate discendants of the class [3].
Lack of Cohesion in Methods (LCOM): LCOM is a count of the number of methods pairs where similarity is o minus the count of method pairs where similarity is not zero.
Message Passing Coupling (MPC): It is count to measure the complexity of message passing among classes [7].
Data Abstraction Coupling (DAC): DAC measures the coupling complexity caused by ADTs [7].
Number Of Methods (NOM): It measures the number of local methods in a class.
SIZE1: It measures number of semicolons in a class [7].
SIZE2: It measures number of attributes and number of local methods [7].
5. Simulation:
This section presents the performed analysis to evaluate the K-means clustering method by applying it to the software maintenance data of commercial software system. The analysis is simulated on MatLab(Matrix Laboratory). The algorithm used in this simulation is given in figure 1.
Figure 1: Algorithm for Simulation
The algorithm begins with initialization of number of classes with their attributes, number of centriods and number of desired cluster. In next step randomly chooses k records to represent the centriods. Then compute the distance using the equation as explained in section 3. Therefore, all the records are placed in a given cluster based on the distance between the record and cluster mean. Further, re-computation is done in next step till all records stay in their previous clusters. Ultimately, the above mentioned algorithm produces the population of classes in a given cluster.
6. Experimental Result:
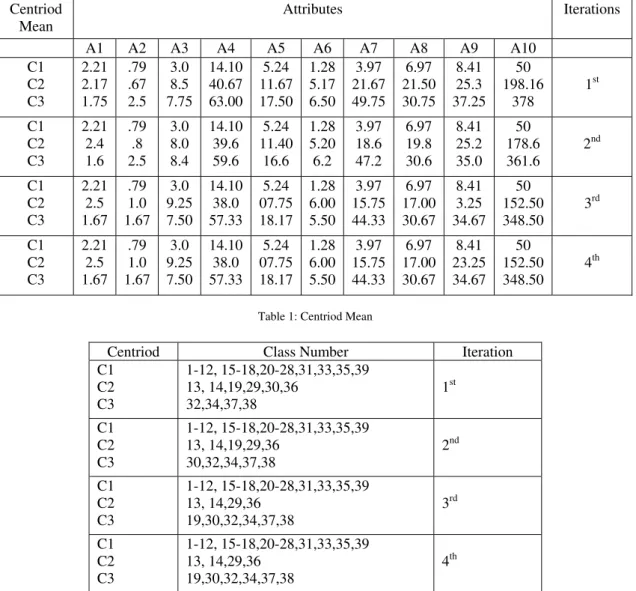
The numbers of classes used in this experiment on sample data of UIMS are 39. The number of dimensions of class data is 10. It is assumed that first centriod (C1) is fourth class, second centriod (C2) is thirteenth class and third centriod (C3) is thirty seventh class. Table 1 revels the centriod mean of Centriods (C1, C2 and C3) at each iteration of the algorithm. Table 2 represents specific classes into their cluster. It is found that 30th class change it position from C1 to C3 in second iteration and 19th class change its position from c2 to c3 in third iteration and so on. It is represented as bold in table 2.
Step 1: Initialization
1. A: Input the number of classes with their attributes, 1. B: Input number of centriods
1. C: Input number of desired cluster.
Step 2: Selection of centriods from available classes on random bases.
Step 3: Computation of Distance
3. A: Compute the distance between classes and centriods. 3. B: Display distance between centriods and classes.
Step 4: Make decision to place classes in specified centriods.
Step 5: Display records in a specified centriod.
Step 6: Re-computation
6. A: Re-compute the mean for each cluster. 6. B: Compute squared-error criterion.
Step 7: Clustering process continues until all records stay in their previous clusters.
Centriod Mean
Attributes Iterations
A1 A2 A3 A4 A5 A6 A7 A8 A9 A10 C1 C2 C3 2.21 2.17 1.75 .79 .67 2.5 3.0 8.5 7.75 14.10 40.67 63.00 5.24 11.67 17.50 1.28 5.17 6.50 3.97 21.67 49.75 6.97 21.50 30.75 8.41 25.3 37.25 50 198.16 378 1st C1 C2 C3 2.21 2.4 1.6 .79 .8 2.5 3.0 8.0 8.4 14.10 39.6 59.6 5.24 11.40 16.6 1.28 5.20 6.2 3.97 18.6 47.2 6.97 19.8 30.6 8.41 25.2 35.0 50 178.6 361.6 2nd C1 C2 C3 2.21 2.5 1.67 .79 1.0 1.67 3.0 9.25 7.50 14.10 38.0 57.33 5.24 07.75 18.17 1.28 6.00 5.50 3.97 15.75 44.33 6.97 17.00 30.67 8.41 3.25 34.67 50 152.50 348.50 3rd C1 C2 C3 2.21 2.5 1.67 .79 1.0 1.67 3.0 9.25 7.50 14.10 38.0 57.33 5.24 07.75 18.17 1.28 6.00 5.50 3.97 15.75 44.33 6.97 17.00 30.67 8.41 23.25 34.67 50 152.50 348.50 4th
Table 1: Centriod Mean
Centriod Class Number Iteration
C1 C2 C3 1-12, 15-18,20-28,31,33,35,39 13, 14,19,29,30,36 32,34,37,38 1st C1 C2 C3 1-12, 15-18,20-28,31,33,35,39 13, 14,19,29,36 30,32,34,37,38 2nd C1 C2 C3 1-12, 15-18,20-28,31,33,35,39 13, 14,29,36 19,30,32,34,37,38 3rd C1 C2 C3 1-12, 15-18,20-28,31,33,35,39 13, 14,29,36 19,30,32,34,37,38 4th
Table 2: Class Number of Centriod C1, C2, C3
Using the Table 2, the population of classes in cluster is calculated as mentioned in Table 3.
Centriod Number of Classes %
C1 C2 C3 29 4 6 74.40 10.27 15.38
Table 3: Number of classes in Centriod and %
7.Experimental Observation:
It is observed after performing the above mentioned experiment that:
• Cluster 1 has the largest population (more than 74% of the whole population) and contains classes that their attributes are low and therefore it is easier to understand and maintain them. This cluster can be labeled as “Good” cluster.
• Cluster 2 contains classes with increased values of attributes. This cluster can be labeled as “Average” cluster.
8.Conclusions and Future Scope:
In this work, the development of a methodology based on the K-means clustering data mining technique has been implemented on UIMS class data. It is observed that the algorithm is able to decide the cluster with Good, Average and Bad conditions. That provides the help to the software designers and maintainers to take the appropriate action at design level. It can also be used by software designer to change or modify the design of difficult to maintain classes at design level of software. This work is small step toward the design of maintainable object oriented software system.
There is a future scope for more similar studies may be carried out with large data set of industrial object oriented system. It is planned, in future, to compare this methodology with other data mining clustering technique in terms of performance and complexity.
References:
[1] Anponellis, P., Antorious, D. and others,”A Data Mining Methodology For Evaluating Maintainability According to ISO/IEC-9126
Software Engineering-Product”, Internet.
[2] Beyer, D. and Noack, A., “Clustering Software Artifacts based on Frequent Common Changes”, Proceding of 13 International
workshop on Program Comprehension, 2005 IEEE.
[3] Chidamber and Kemerer, C.F., “A Metrics suite for Object Oriented Design”, IEEE Transactions on Software Engineering”, Vol. 20,
No.4, pp. 476-493, 1994.
[4] Elmasri and Navathe, “Fundamental of Database System”, 4th
edition, Pearson India, 2005.
[5] IEEE Standard Glossary of Software Engineering Terminology, Report IEEE Std. 610.12-1990, IEEE, 1990.
[6] Kanellopoulos, Y. and Others, “K-attractors: A clustering Algorithm for Software Measurement Data Analysis”, 19th
IEEE International Conference on Tools with A.I.
[7] Li. W., & Henry, S., “Object-Oriented Metrics that Predict Maintainability”, The Journal of Systems and Software, Vol. 23, pp.
111-122, 1993,.
[8] Malviya, A.K. and Dutta, M.,”Measuring the Maintainability of Object Oriented Systems”, International Journal of Information &
Computing Science, Vol. 7 and No. 2, pp. 1-12.
[9] Muthana, S., Kontogiannis, k., Ponnambalam, K. and Stacey, B. “A Maintainable Model for Industrial Software Systems Using
Design Level Metrics”, IEEE Software, 2000.
[10] Oca, C.M. and Carver, D.L., “Identification of Data Cohesive Subsystem Using Data Mining Techniques”, Internet
[11] Rousidis, D. and Tjortjis, C., “Clustering Data Retrieved from Java Source Code to Support Software maintenance: A Case Study”,
Proceeding of the ninth European Conference on Software Maintenance and Reengineering, 2005 IEEE.
[12] Tripathi, A.K. and Malviya, A.K., “On Maintainability and Coupling of Object Oriented Software”, Journal of the CSI, Vol.32, No. 3,
Sep. 2002.
[13] Tripathi, A.K. and Malviya, A.K.,”Some Observations on Maintainability Metrics for Object Oriented Software”, International Journal
of Information and Computing Science, Vol. 3, No2., pp. 52-56, Dec. 2000.
[14] Zhou, Y. and Leung, H., “Predicting Object-Oriented Software Maintainability using Multivariate Adaptive regression Splines”, The
Journal of Systems and Software, 80(2007), pp. 1349-1361.
Dr. Anil Kumar Malviya is an Associate Professor (MCA) in Computer Science & Engineering Department at Kamla Nehru Institute of Technology, (KNIT), Sultanpur. He received his B.Sc. & M.Sc. both in Computer Science from Banaras Hindu University, Varanasi respectively in 1991 and 1993 and Ph.D. degree in Computer Science from Dr. B.R. Ambedkar University, Agra in 2006. He is Life Member of CSI, India. He has published about 20 papers in International/National Journals conferences and seminars. His research interests are Data mining and Software engineering, Cryptography & Network Security.
Vibhooti Singh is Sr. Lecturer (MCA) in Computer Science & Engineering Department at Prasad Institute of Technology,(PIT), Jaunpur. He received his MCA from Uttar Pradesh Technical University Lucknow in 2006 & M.TECH(IT) from Karnataka State open university Mysore in 2010.He has presented and published 2 papers in International/National Journals conferences and seminars. His research interests are Software engineering, Cryptography & Network Security.