STRATEGIES TO IMPROVE THE EFFICIENCY OF GENOMIC
SELECTION IN ANIMAL BREEDING PROGRAMS
Haroldo Henrique de Rezende Neves
Zootecnista
UNIVERSIDADE ESTADUAL PAULISTA - UNESP
CÂMPUS DE JABOTICABAL
STRATEGIES TO IMPROVE THE EFFICIENCY OF GENOMIC
SELECTION IN ANIMAL BREEDING PROGRAMS
Haroldo Henrique de Rezende Neves
Advisor: Profa. Dra. Sandra Aidar de Queiroz
Co-Advisor: Dr. Roberto Carvalheiro
2013
Thesis presented to the Faculdade de Ciências Agrárias e Veterinárias Unesp, Câmpus de Jaboticabal, in partial fulfilment of requirements for
the degree of Doutor em Genética e Melhoramento Animal
N514s Strategies to improve the efficiency of genomic selection in animal breeding programs / Haroldo Henrique de Rezende Neves. ––
Jaboticabal, 2013 vi, 162 p. : il. ; 29 cm
Tese (doutorado) - Universidade Estadual Paulista, Faculdade de Ciências Agrárias e Veterinárias, 2013
Orientadora: Sandra Aidar de Queiroz Co-orientador: Roberto Carvalheiro
Banca examinadora: Fabyano Fonseca e Silva, Fernanda Brito, Fernando Sebastián Baldi Rey, Rúsbel Raúl Aspilcueta Borquis
Bibliografia
1. Melhoramento genético. 2. Bovinos de corte. 3. Seleção genômica. I. Título. II. Jaboticabal-Faculdade de Ciências Agrárias e Veterinárias.
CDU 636.2:636.082
CURRICULUM VITAE
HAROLDO HENRIQUE DE REZENDE NEVES – was born in Araxá, Minas
"Se procurar bem você acaba encontrando, não a explicação (duvidosa) da vida, mas a poesia (inexplicável) da vida."
This thesis is dedicated in loving memory to my mother Cecilia, whose love, devotion, strength, faith and wisdom will always guide me.
ACKNOWLEDGEMENTS
I thank God for the miracle of life, for the strength to carry on.
I would like to express my gratitude to Profa. Sandra Aidar de Queiroz and to my friend Roberto Carvalheiro, for their guidance, friendship, support, advice, encouragement and for every contribution to my personal and professional development.
I would like to express my gratitude to all members of the internal and external examining comitees: Dr. Danísio Prado Munari, Dr. Henrique Nunes de Oliveira, Dr. Fernando Sebastián Baldi Rey, Dr. Rúsbel Raúl Aspilcueta Borquis, Dra. Fernanda Varnieri Brito and Dr. Fabyano Fonseca e Silva, for their kind attention and for their valuable suggestions and contributions to improve this thesis.
Financial support from the Fundação de Amparo à Pesquisa do Estado de São Paulo (FAPESP) is gratefully acknowledged. In addition, the Faculdade de Ciências Agrárias e Veterinárias - Unesp Jaboticabal (FCAV / Unesp) is acknowledged for all support provided to the development of this thesis as well as for every contribution to my professional development. The support and incentive of the postgraduate program on Genetics and Animal Breeding at FCAV⁄ Unesp is gratefully acknowledged.
I would like to express my gratitude to all professors of the postgraduate program on Genetics and Animal Breeding at FCAV/Unesp (Genética e Melhoramento Animal), for their decisive contribution to my academic formation. The postgraduate program inComputer Science and Computational Mathematics at ICMC-USP (São Carlos) is also gratefully acknowledged.
I would like to thank to all members of the Zebu Genome Consortium, for the constructive discussions and for their generous assistance. I thank to Prof. José Fernando Garcia, for the opportunity to participate in the group. I thank to Yuri, Solomon, Ana Maria, Leonardo Seno, Márcia, Adriana, as well as to many other colleagues, for the friendship, collaboration and all high-level discussions.
I would like to express my gratitude to all members of GenSys Consultores Associados for the collaboration in different moments of my graduate studies.
I wish to thank to all friends and colleagues I met during the graduate studies.
I thank to my friends from Mata Bixera for many remarkable moments throughout these years. I especially thank to Fernando (Pinico), Luiz (Kalango), Anderson (Batata), Otavio (Finkado), Sérgio (Grico), Henrique (Cadera), José Rodolfo (Bernento), Victor (Cervo), Oberdan (Lírou), Bruno (Mininão), Guilherme (Pedala), Mikhael (Teta), Victor (Sofredô), Thiago (Gozo), Daniel (Rombo), Eduardo (Biruleiby), Marco Túlio (K-pão), Gabriel (Xurros), Fábio (Muralha), David (Sarrafo), Aníbal (Babaka), Silas (Delegado), Ivaldo (De-dinho), Lucas (Ex-Seção), Leonardo (Mid Night), Rhaony (Zé-Mayer), Eduardo (Quem?), Ricardo (Limeira), Murilo (Zôtro), Gustavo (Dildo), Henrique (Taradão), Neil (Vápu) and Guilherme (Xangrilá). I thank my friends from the first years in Jaboticabal: Felipe (Tumor), Ronaldo (Bicudo), Gustavo (Bodão), Daniel (Boto), Alexandre (Bigato), Fabiano, Marco Antonio (Koringa) and Fernando (Futum).
I thank to the friends I made during the undergraduate studies in Animal Science (especially those from the XLVII Turma de Zootecnia da FCAV, ZOO 2003), for the support and friendship throughout these years. Thanks to André (Mama-ki), Daniel (Furunku), Daniel (Refugo), Fernando (Mala), Giancarlo (Caxão), Gustavo (Bodão), Gustavo (Vurto), Henrique (Tansso), José Rodolfo (Bernento), Rodrigo (Pinto), Rodrigo (Xoko) and many others.
CONTENTS
CHAPTER 1 - General considerations ... 1
Introduction ... 1
Genomic selection ... 2
Statistical methods to estimate markers effects ... 4
Impact of genomic selection on inbreeding incidence and long-term genetic gain ... 9
Outline of the thesis ... 10
CHAPTER 2 - Statistical methods for genomic selection in a mice population... 17
Abstract ... 17
Background ... 18
Methods... 19
Results ... 28
Discussion ... 40
Conclusions ... 46
References ... 46
CHAPTER 3 – Adequacy of using different pseudo-phenotypes for model training and validation of genomic predictions in a simulated beef cattle population... 50
Abstract ... 50
Background ... 51
Methods... 54
Results ... 61
Discussion ... 69
Conclusions ... 74
Literature Cited ... 75
Supplementary Figure 1 ... 81
CHAPTER 4 - Trait-specific long-term consequences of genomic selection in beef cattle ... 82
Abstract ... 82
Methods ... 85
Results ... 98
Discussion ... 119
Conclusions ... 128
References ... 129
CHAPTER 5 - Long-term consequences of selective genotyping strategies in a beef cattle population undergoing selection ... 135
Abstract ... 135
Background ... 136
Methods ... 138
Results ... 145
Discussion ... 154
Conclusions ... 157
References ... 157
STRATEGIES TO IMPROVE THE EFFICIENCY OF GENOMIC SELECTION IN ANIMAL BREEDING PROGRAMS
ABSTRACT
This thesis comprises four different studies carried out to evaluate alternative strategies aimed to improve the efficiency of genomic selection (GS) in animal breeding programs. The performance of different statistical methods used to predict the genetic merit of animals based on genomic information was assess in the first study. Five different traits of a real mice dataset were analyzed and methods with large conceptual differences reached very similar predictive abilities in some situations, while a clear re-ranking of methods was observed in function of the trait analyzed.
In the second study, the adequacy of using different response variables (pseudo-phenotypes) to estimate marker effects was investigated through simulation of multi-step genomic evaluation in a large beef cattle population. There was evidence that deregressed proofs comprised a more suitable response variable for both model training and model validation, when compared to estimated breeding values and progeny-yield deviations.
Long-term consequences of application of GS in a beef cattle population undergoing selection were assessed though simulation. Large benefits were envisaged for GS over traditional selection for scenarios mimicking selection for meat quality and female reproduction. There was evidence that larger advantage can be expected for GS compared to BLUP when the selected trait is under less polygenic background and that attributing more weight to favorable alleles of low-frequency can contribute to reduce inbreeding rates and loss of favorable alleles in GS.
The results of this thesis highlight the potential of using GS to improve female reproduction and meat quality traits in beef cattle, also showing that genomic information can be a valuable tool to monitor inbreeding incidence and thus enhance strategies to maintain genetic diversity in the long-term.
ESTRATÉGIAS PARA AUMENTO DE EFICIÊNCIA DA SELEÇÃO GENÔMICA EM PROGRAMAS DE MELHORAMENTO GENÉTICO ANIMAL
RESUMO
Esta tese compreende quatro diferentes estudos conduzidos a fim de avaliar estratégias alternativas para aumentar a eficiência de seleção genômica (GS) em programas de melhoramento animal. Um primeiro estudo foi desenvolvido com a finalidade de avaliar a performance preditiva de diferentes métodos estatísticos com base na informação de painéis de marcadores densamente distribuídos ao longo do genoma. Cinco diferentes características de uma população real de camundongos foram analisadas. Verificou-se que métodos com grandes diferenças conceituais apresentaram performance preditiva similar em algumas situações, também havendo variação na performance relativa dos métodos em função da característica analisada.
O uso de diferentes variáveis resposta (pseudo-fenótipos) para estimação de efeitos de marcadores foi avaliado num segundo estudo, por meio da simulação de uma grande população de bovinos de corte, para a qual predições genômicas foram obtidas usando um procedimento de múltiplas etapas. Houve evidência de que provas desregredidas (dEBV) são mais apropriadas do que valores genéticos preditos (EBV) e médias ajustadas de desempenho da progênie (PYD), tanto para o treinamento de modelos quanto para a validação de predições genômicas.
No terceiro estudo, procurou-se avaliar consequências em longo-prazo da aplicação de GS numa população de bovinos de corte sob seleção. Verificou-se grande benefício da aplicação de GS em cenários simulando seleção para características de qualidade de carne e reprodução de fêmeas. Houve evidência de que pode-se esperar maior benefício para GS, quando comparada à seleção por BLUP, no caso de características oligogênicas. Também foi possível inferir que em aplicações de GS, o uso de um critério de seleção em que se atribui maior peso a alelos favoráveis de menor frequência poderia proporcionar menor incidência de endogamia e redução na perda de alelos favoráveis.
de predição utilizadas para aplicação de GS numa população simulada de bovinos sob seleção. Não foi possível identificar claro benefício decorrente da aplicação de nenhuma estratégia em particular, embora as estratégias que incluíram genotipagem de machos superiores tenham proporcionado maior progresso genético nos cenários em que predições genômicas foram obtidas por meio de um procedimento de avaliação implementado numa única etapa.
Como resultado geral, evidenciou-se o potencial de aplicação de GS para acelerar o progresso genético em características de reprodução de fêmeas e qualidade de carne em bovinos de corte, bem como a utilidade da informação genômica para monitoramento de endogamia e definição de estratégias mais eficientes para manutenção da diversidade genética em longo-prazo.
CHAPTER 1 - General considerations
Introduction
Improvements in production levels and product quality are needed in livestock systems to meet the growing world demand for animal-source foods. Besides this increasing demand, the productive sector must deal with constraints related to competition for land, greenhouse gas emissions and also due to hardening legislation in the fields of environment and animal welfare (FAO, 2011). In this context, animal breeding has played and will continue to play an important role to improve the efficiency of such production systems, especially in terms of competitiveness, safety, sustainability and biodiversity conservation (Harlizius et al., 2004).
The main objective of animal breeding programs is to improve the performance of the next generations, through identification and reproduction of the animals with better genetic pool to efficiently produce in a specific environment (herein, superior animals). In the last decades, animal breeders succeeded in achieving this goal, mostly through the application of statistical tools grounded in quantitative genetics theory, what could be called as 'classical animal breeding'. In this case, the traditional prediction of the genetic merit of individuals (estimated breeding values, EBV) is obtained based on information of pedigree and phenotypes (own records and measures on relatives).
The sequencing of bovine genome (Bovine Genome Consortium, 2009) and the availability of dense panels of SNP markers, allowed GS to migrate from simulation to real-word. First applications of GS started in dairy cattle (e.g. Harris et al., 2008; Van Raden et al., 2009). Although individually less informative than multi-allelic markers, SNPs became the markers of choice for GS applications, because they are abundant throughout the genome, have low mutation rate and enable screening samples at relatively low cost. Since then, several studies have focused on the use of genomic selection to enhance both animal and plant breeding.
Genomic selection
The reasoning behind GS is that high-density panels, providing enough genome coverage, would allow markers to capture variability associated to most of the loci (herein QTL) influencing traits of economic relevance. The sum of the effects of such markers would be an accurate predictor of the genetic merit of selection candidates (Meuwissen et al., 2001), given that these effects are estimated simultaneously and that the panel is dense enough. Herein, the prediction of genetic merit obtained through GS will be referred to as genomic estimated breeding value (GEBV).
Markers and QTL must be in sufficient linkage disequilibrium (LD) (i.e. close/associated enough) to ensure that markers will consistently predict QTL effects across generations and/or populations (Hayes et al., 2009; Calus, 2010). As QTL position is generally not known, the average LD between adjacent markers is referred to as the key parameter to evaluate the precision with which GEBV can be predicted, in a way that the lower the extent of LD in a population, the denser must be the marker panel for GS to work (de Ross et al., 2008).
The implementation of genomic selection can be divided in the following steps:
-Model training: statistical models are fitted using phenotypic and genotypic
including single or repeated measures of individual phenotypic performance, progeny records and even estimated breeding values (EBV) from genetic evaluations.
In some sense, using EBVs as response variable could be a convenient choice, because this measure is expected to be a more reliable predictor of the genetic merit of individuals, if considerable amount of information is available for EBV calculation, when compared to the use of single phenotypic measurements. On the other hand, Garrick et al. (2009) highlighted some potential problems of this approach and proposed using deregressed EBVs (dEBV) to estimate marker effects. While some studies had pointed out benefit in using dEBV as response variable (e.g. Ostersen et al. 2011), other studies did not confirm such advantage (Guo et al., 2010). A more careful analysis of such discrepancies suggests that more benefit is expected for using dEBVs when the amount of information used to predict EBV is lower and more heterogeneous among reference animals.
Given the costs involved in genotyping animals for high-density panels, strategies are needed to allow more cost-effective scenarios for application of GS, of which one example is selective genotyping. Some studies have identified strategies to choose a more informative set of animals to compose the reference population that would provide greater predictive ability (e.g. genotyping animals with extreme yield deviation values, Boligon et al., 2012).
-Validation: before GS is routinely applied, its feasibility needs to be evaluated.
For this, the reliability of the estimated marker effects (and thus of the genomic predictions) is verified in an independent set of animals. A general scheme to carry out such validation is forward prediction (e.g. VanRaden et al., 2009; Habier et al., 2011). In this case, data is split such that the information on older animals are included in the reference population, while the GEBV of younger animals ('testing set' or 'validation set') is predicted based on their genotypes. As these younger animals are also progeny-tested, and thus have reliable EBVs, the correlation between GEBV and EBV in the testing set is considered as a good proxy for the reliability of genomic predictions.
similar to K-fold cross-validation (e.g. Legarra et al., 2008; Saatchi et al., 2012) are often employed in this situation.
According to Calus (2010), there is no consensus on the ideal design of reference and validation populations, what is driven by economical or practical constraints in some situations. However, some studies have compared different strategies for such design, suggesting that multi-generational reference populations would allow lower decrease in prediction accuracy due to marker-QTL associations being broken by recombination along the generations (e.g. Muir, 2007) as well as proposing alternatives that would reduce the need of re-estimation of marker effects every generation (Solberg et al., 2009). While such issues are important for species in which generation intervals are smaller and/or phenotyping is too costly, in dairy cattle, the routine genetic evaluations already include periodic update of reference populations, in a way that all phenotypic and genotypic information available at each time is employed to re-estimate the marker effects, with various genomic evaluations being released along the year (Wiggans et al., 2011).
-Selection: Once the genomic predictions are found reliable enough, GS can
be used to predict the genetic merit of animals, as soon as they are genotyped. Schaeffer (2006) highlighted the potential benefits of this strategy in terms of reducing generation intervals, increasing prediction accuracies and selection intensities and reducing breeding organization costs as well, while it has been argued that GS could be an effective way to enhance genetic evaluations of difficult-to-measure traits as well as of traits expressed late in life (Goddard et al., 2010; Dekkers, 2012).
Statistical methods to estimate markers effects
The estimation of marker effects can be treated as a multiple regression problem, in which phenotypes for a trait of economic relevance are the response variable, while the genotypes for SNP markers are the explanatory variables. This situation typically constitutes a “large p, small n problem” because the number of
models may suffer of multicollinearity, especially because markers in close positions are expected to be highly correlated.
The basic statistical model employed for marker effect estimation in the influential study of Meuwissen et al. (2001) can be described as:
y = 1n +
p
j j jg
X
1
+ e, (1)
where y is the vector of phenotypes (of length n), is an overall mean, 1n is a vector
of ones (of order n), gj and Xj represent the allele substitution effect of the j-th marker
and an incidence matrix relating y to the effect of marker j, respectively, and e is a random residual, under the assumption that e~ N (0, σ²e).
In practical terms, the main difference among the different methods proposed in Meuwissen et al. (2001) relies on the assumptions about the variances of marker effects. In one method, that can be considered a ridge regression procedure and that will be regarded to as RR-GBLUP hereafter, the best linear unbiased prediction of marker effects was obtained under the assumption that they follow the same normal distribution, with variance σ²m, so that mixed model equations are solved considering a variance ratio (λ ) obtained as λ = σ2
e/(σ2m/k), k=2 ∑ pi − (1 − pi) and pi is the allelic
frequency of the ith marker, what reflects the fact that more polymorphic loci
contribute more to the genetic variation.
In the Bayes A method (Meuwisen et al., 2001), a model similar to that in (1) was implemented under a Bayesian regression framework, so that marker-specific variances (σ²j) are fitted. The priors for such variances were defined as σ²j~χ-2(v,S),
and the hyperparameters were chosen so that the prior distribution of marker effects is a scaled t distribution. The Bayes B method (Meuwisen et al., 2001) included an additional Metropolis-Hastings step, that induces a posterior distribution of marker effects having higher density at 0. In this method, marker effects are assumed to be either zero with a high probability (usually 0.95 or larger) or have their variances estimated assuming a prior distribution similar to that described for Bayes A.
demonstrated that both approaches (RR-GBLUP and GBLUP), under some assumptions, are equivalent.
Besides the methods proposed in Meuwissen et al. (2001), many other approaches have been applied for estimation of marker effects since then. Some of them involve dimensionality reduction techniques commonly used in other fields, among which partial least squares (Solberg et al., 2009), principal component analysis (Macciotta & Gaspa, 2009; Solberg et al., 2009) and the LASSO (Usai et al., 2009). Bayesian implementations of the LASSO (de los Campos et al., 2009; Legarra et al., 2011) have been applied in genomic prediction as well.
While some simulation studies had suggested larger predictive ability for Bayes B, when compared to other methods (Meuwissen et al., 2001; Clark et al., 2011), one drawback of such approach is that it can be too demanding computationally. Thus, to overcome such limitations, alternative Bayesian regression approaches of similar concept have been proposed: SSVS (Verbyla et al., 2009), Bayes Dpi and Bayes Cpi (Habier et al., 2011) and BayesR (Erbe et al., 2012).
A comprehensive review of genomic prediction methods can be found in de los Campos et al. (2013). These authors classified genomic prediction methods into three groups: penalized methods, Bayesian methods and non-parametric methods. In the case of penalized methods, marker effect estimation can be viewed as an optimization problem in which the objective function includes both goodness of fit to the training data (usually through the residual sum of squares) and a penalty function on model complexity.
Common penalty functions in penalized methods are based on either the sum of squares of regression coefficients (RR-GBLUP) or on the sum of absolute regression coefficients (LASSO), while a weighted average of these two penalty functions would originate the elastic net (EN) method, in an attempt to combine features of both methods (de los Campos, 2013).
for which a normal prior is assumed for maker effects. According to de los Campos et al. (2013), this assumption could lead to sub-optimal solutions, for instance when some markers are in regions not linked to any QTL.
At higher marker density, a small proportion of the markers is expected to be statistically associated to QTL and thus have effect on the trait. For this reason, other prior densities that have higher mass at zero and thicker tails have been postulated for marker effects, aiming to induce stronger shrinkage of estimates of markers with small effects, while allowing less shrinkage of estimates of markers with larger effects. The most common prior densities with these features are the scaled t (Bayes A) and the double exponential (Bayesian LASSO).
Another group of Bayesian regression methods assume that marker effects follow a mixture of densities with large and small variances (e.g. SSVS, Bayes R), what could induce differential shrinkage of estimates of marker effects. In order to induce variable selection, other group of methods postulate a combination of point mass at zero and a density with large variance (slab) as a prior for marker effects (de los Campos et al., 2013), thus resulting in a proportion (π) of marker not having effect on the trait. Bayes B (for which the slab is a scaled t) and Bayes Cpi (for which the slab is a normal density) are examples of this last group.
As mentioned earlier, in many Bayesian regression methods, some hyperparameters are often fixed at arbitrary values (e.g. π in Bayes B), what has motivated some criticism. As suggested in Gianola (2013), a more elegant approach to this problem would be to assign priors for such hyperparameters and infer them from the resulting model. However, in a situation when p >> n and with long-range LD, it may not be possible to estimate all these parameters jointly (de los Campos et al., 2013).
Moreover, Gianola (2013) alerted to the problem of making inferences based marker effects estimated obtained using Bayesian linear regression methods when p
While in most of the methods discussed earlier, genomic values can be represented as parametric functions of marker genotypes, this does not hold in the case of other methods used to estimate marker effects, including non-parametric regression approaches (Gianola et al., 2006; Bennewitz et al., 2009) and machine learning methods (e.g. Long et al., 2007; González-Récio & Forni, 2011). An important motivation for using non-parametric methods in genomic prediction would be the possibility to enhance predictions for traits influenced by non-additive effects. It is worth to emphasize that in this case these methods predict genotypic values rather than purely additive breeding values.
Although simulation studies have suggested the superiority of methods based on some sort of variable selection over GBLUP and RR-GBLUP (Meuwissen et al., 2001; Habier et al., 2007; Solberg et al., 2008; Clark et al, 2011), this advantage rarely has been verified with real data. Previous studies comparing genomic predictions with different methods using real data indicated that RR-GBLUP performed comparably or better than variable selection methods (Hayes et al., 2009; Luan et al., 2009; Moser et al., 2009; Legarra et al., 2011), although there is evidence that substantially higher accuracy can be achieved using variable selection methods for some traits (e.g. traits affected by DGAT1) (VanRaden et al., 2009; Legarra et al., 2011).
It has been argued that shrinkage methods with assumptions close to the infinitesimal model (i.e. RR-GBLUP and its variants) are robust with respect to the underlying genetic architecture of the traits, while the predictive performance of variable selection methods is more variable in function of the genetic background of the traits (Daetwyler et al., 2010).
and compute genomic predictions. In addition, genomic predictions can be combined (blended) to traditional predictions of genetic merit (EBV), as is the case of some dairy cattle breeding programs (e.g. VanRaden et al., 2009).
One alternative to the multi-step approach is single-step genomic prediction (Legarra et al., 2009). In such procedure, all available information (including genotypic information, pedigree and phenotypes) can be employed in genetic evaluation, so that the pedigree relationship matrix is augmented with genomic information. This procedure allows to generate predictions for both genotyped and non-genotyped animals simultaneously, being that model assumptions are close to those of GBLUP.
Impact of genomic selection on inbreeding incidence and long-term genetic gain
When compared to traditional selection based on BLUP, in addition to enable increased rates of genetic progress, GS schemes could also reduce the levels inbreeding accumulated along the selection process (Daetwyler et al., 2007). This would be justified by the fact that genomic prediction would allow better estimation of the Mendelian sampling term (MS), i.e. of the component of the true breeding value (TBV) defined as the deviation of the parent average (PA). This feature would result in smaller co-selection of closely related animals when compared to BLUP.
On the other hand, large reductions in generation intervals under GS prediction could lead to an increase of annual inbreeding rates. However, the risks associated to inbreeding incidence are more relevant on a generation basis, since the processes that counterbalance this phenomenon also occur in time horizon equivalent to one generation (Daetwyler et al, 2007). According to these same authors, the possibility of more intense selection in GS schemes (e.g. screening of a larger number of selection candidates) could also contribute to increase the levels of inbreeding.
contributions between both sexes in the long-term and possibly allowing to reduce inbreeding rates when compared to BLUP selection, at a same level of genetic gain. Avendaño et al. (2004) also argued that the MS term is the main component that allow optimum contribution selection (OCS) strategies to be effective at controlling inbreeding rates and increase genetic progress.
As a general rule, many aspects previously discussed draw attention for the potential benefits of GS in situations in which genomic predictions allow more accurate estimation of the Mendelian sampling term. Anyway, further studies, possibly involving more detailed simulations, are needed to investigate the relationship between genomic selection and inbreeding incidence, as well as other long-term consequences of such a strategy.
The large amount of genomic information made available by high-density panels could allow the development of estimators of inbreeding that would be more informative than pedigree-based estimators (Villanueva et al., 2005; Daetwyler et al., 2007).
Outline of the thesis
This thesis comprises four different studies carried out to evaluate alternative strategies aimed to improve efficiency of genomic selection in animal breeding programs. The study presented in Chapter 2 was devoted to test the performance of different statistical methods used to predict the genetic merit of animals based on information of genome-wide dense molecular markers, after analyzing a real mice dataset from a public database. The focus was on the interplay between the genetic background of the traits and the relative performance of different methods as well as on the influence of the extent of relatedness between selection candidates and the reference population on such predictions. In this scope, better understanding of such inter-relationships as well as the identification of more suitable statistical methods to estimate marker effects could make an important contribution to improve the efficiency of GS.
different response variables (pseudo-phenotypes) to estimate marker effects was investigated. A large beef cattle population was simulated to evaluate the impact of using different pseudo-phenotypes in a multi-step genomic evaluation, aiming to identify more appropriate procedures for both model training and validation of genomic predictions in such situation.
The knowledge about the potential of different selection strategies to enable genetic gain and maintain genetic diversity in longer time horizons is essential for the sustainability of breeding schemes. A third study (Chapter 4) was designed to assess long-term consequences of application of GS in a simulated cattle population undergoing selection. Such study aimed to provide some insight on the potential consequences of GS under different scenarios of selection, while alternative strategies to monitor and control inbreeding incidence were investigated.
Using selective genotyping strategies has been suggested as an alternative to improve cost-effectiveness of GS, while some drawbacks have also been identified for some of such strategies. Chapter 5 addresses the question about how different selective genotyping approaches would perform when updating the reference population used in GS, considering a simulated beef cattle population undergoing selection, also evaluating the quality of genomic predictions obtained using different statistical methods, in both short and long-term.
Literature cited
AVENDAÑO, S.; WOOLLIAMS, J. A.; VILLANUEVA, B. Prediction of accuracy of estimated Mendelian sampling terms. Journal of Animal Breeding and Genetics,
Berlin, v. 122, n. 5, p. 302–308, 2005.
BENNEWITZ, J.; SOLBERG, T.; MEUWISSEN, T. H. E. Genomic breeding value estimation using nonparametric additive regression models. Genetics Selection
Evolution, Jouy-en-Josas, v. 41, n. 20, 2009. Available at: <
http://dx.doi.org/10.1186/1297-9686-41-20>.
BOLIGON, A. A.; LONG, N.; ALBUQUERQUE, L. G.; WEIGEL, K. A.; GIANOLA, D.; ROSA, G.J.M. Comparison of selective genotyping strategies for prediction of breeding values in a population undergoing selection. Journal of Animal Science,
BOVINE GENOME SEQUENCING AND ANALYSIS CONSORTIUM. The genome sequence of taurine cattle: a window to ruminant biology and evolution. Science,
Washington DC, v. 324, n. 5926, p. 522-528, 2009.
CALUS, M. P. L. Genomic breeding value prediction: methods and procedures.
Animal, Cambridge, v. 4, n. 2, p 157-164, 2010.
CLARK, S. A.; HICKEY, J. M.; VAN DER WERF, J. H. J. Different models of genetic variation and their effect on genomic evaluation. Genetics Selection Evolution,
Jouy-en-Josas, v. 43, n. 18, 2011. Available at: <http://dx.doi.org/ 10.1186/1297-9686-43-18>.
DAETWYLER, H. D.; CALUS, M. P.; PONG-WONG, R.; DE LOS CAMPOS, G.; HICKEY, J. M. Genomic prediction in animals and plants: simulation of data, validation, reporting, and benchmarking. Genetics, Bethesda, v. 193, n. 2, p. 347-365, 2013.
DAETWYLER, H. D.; PONG-WONG, R.; VILLANUEVA, B.; WOOLLIAMS, J.A. The impact of genetic architecture on genome-wide evaluation methods. Genetics,
Bethesda,v. 185, n. 3, p. 1021-1031, 2010.
DAETWYLER, H. D.;VILLANUEVA, B.; BIJMA, P.; WOOLIAMS, J. A. Inbreeding in genome-wide selection. Journal of Animal Breeding and Genetics, Berlin, v. 124, n. 6, p. 369–376, 2007.
DE LOS CAMPOS, G.; NAYA, H.;GIANOLA, D.; CROSSA, J.; MANFREDI, E.; WEIGEL, K. A.; COTES, J. M. Predicting quantitative traits with regression models for dense molecular markers and pedigree. Genetics, Bethesda,v.182, n. 1, p. 375–
385, 2009.
DE LOS CAMPOS, G.; HICKEY, J.; PONG-WONG, R.; DAETWYLER, H. D.; CALUS, M. P. L. Whole-Genome Regression and Prediction Methods Applied to Plant and Animal Breeding. Genetics, Bethesda,v. 193, n. 2, p. 327-345, 2013. DE ROOS A. P. W.; HAYES, B. J.; SPELMAN, R.; GODDARD, M. E. Linkage disequilibrium and persistence of phase in Holstein Friesian, Jersey and Angus cattle. Genetics, Bethesda,v. 179, n. 3, p. 1503-1512, 2008.
ERBE, M.; HAYES, B. J.; MATUKAMULLI, L. K.; GOSWAMI, S.; BOWMAN, P. J.; REICH, C. M.; MASON, B. A.; GODDARD, M. E. Improving accuracy of genomic predictions within and between dairy cattle breeds with high density SNP panels.
Journal of Dairy Science, Champaign, v. 95, n. 7, p. 4114-4129, 2012.
FAO. 2011. Mapping supply and demand for animal-source foods to 2030, by T.P. Robinson & F. Pozzi. Animal Production and Health Working Paper. No. 2. Rome. GARRICK, D.J; TAYLOR, J.F.; FERNANDO, R .L. Deregressing estimated breeding values and weighting information for genomic regression analyses. Genetics
Selection Evolution, Jouy-en-Josas, v. 41, n. 55, 2009. Available at:
<http://dx.doi.org/10.1186/1297-9686-41-55>.
GIANOLA, D.; FERNANDO, R. L.; STELLA, A. Genomic assisted prediction of genetic value with semiparametric procedures. Genetics, Bethesda, v. 173, n. 3, p. 1761–1776, 2006.
GIANOLA, D. Priors in Whole-Genome Regression: The Bayesian Alphabet Returns.
Genetics, Bethesda,v. 194, n. 3, p. 573-596, 2013.
GODDARD, M.E.; HAYES, B.J.; MEUWISSEN T.H. Genomic selection in livestock populations. Genetics Research, Cambridge,v. 92, n. 5-6, p. 413-421, 2010.
GODDARD, M. E. Genomic selection: Prediction of accuracy and maximisation of long term response. Genetica, Dordrecht, v. 136, n. 2, p. 245-257, 2009.
GONZÁLEZ-RECIO, O.; FORNI, S. Genome-wide prediction of discrete traits using Bayesian regressions and machine learning. Genetics Selection Evolution, Jouy-en-Josas, v. 43, n. 7, 2011. Available at: <10.1186/1297-9686-43-7>.
GUO, G.; LUND, M.S.; ZHANG, Y.; SU, G. Comparison between genomic predictions using daughter yield deviation and conventional estimated breeding value as response variables. Journal of Animal Breeding and Genetics, Berlin, v. 127, n. 6, p. 423-432, 2010.
HABIER, D.; FERNANDO, R. L.; KIZILKAYA, K.; GARRICK, D. J. Extension of the bayesian alphabet for genomic selection. BMC Bioinformatics, London, v. 12, n. 186, 2011. Available at: <http://dx.doi.org/10.1186/1471-2105-12-186>.
HARLIZIUS, B.; VAN WIJK, R.; MERKS, J. W. Genomics for food safety and sustainable animal production. Journal of Biotechnology, Amsterdam, v.113, n. 1-3, p. 33-42, 2004.
HARRIS, B.L.; JOHNSON, D. L.; SPELMAN, R. J. Genomic selection in New Zealand and the implications for national genetic evaluation. In: International Committee for Animal Recording Biennial Session, 36., 2008, Niagara Falls, Canada.
Proceedings...Niagara Falls: ICAR, 2008, p. 325-330.
HAYES, B.J.; BOWMAN, P.J.; CHAMBERLAIN, A.J.; GODDARD, M. E. Invited review: Genomic selection in dairy cattle: Progress and challenges. Journal of Dairy Science, Champaign, v. 92, n. 3, p. 433–443, 2009.
LEGARRA, A.; ROBERT-GRANIÉ, C.; CROISEAU, P.; GUILLAUME, F.; FRITZ, S. Improved Lasso for genomic selection. Genetics Research, Cambridge, v. 93, n. 1, p. 77-87, 2011.
LEGARRA, A.; ROBERT-GRANIÉ, C.; MANFREDI, E.; ELSEN, J-M. Performance of genomic selection in mice. Genetics, Bethesda,v.180, n. 1, p. 611-618,2008.
LEGARRA, A.; AGUILAR, I.; MISZTAL, I. A relationship matrix including full pedigree and genomic information. Journal of Dairy Science, Champaign, v. 92, n. 9, p. 4656-4663, 2009.
LONG , N.; GIANOLA, D.; ROSA, G. J. M.; WEIGEL, K. A.; AVENDAÑO S. Machine learning classification procedure for selecting SNPs in genomic selection: application to early mortality in broilers. Journal of Animal Breeding and Genetics, Berlin, v. 124, n. 6, p. 377-389, 2007.
LUAN, T.; WOOLLIAMS, J.A.; LIEN, S.; KENT, M.; SVENDSEN, M.; MEUWISSEN, T.H.E. The accuracy of genomic selection in Norwegian Red cattle assessed by cross-validation. Genetics, Bethesda, v.183, n. 3, p.1119-1126, 2009.
MACCIOTTA, N. P. P.; GASPA, G. Use of principal component and factor analysis to reduce the number of independent variables in the prediction of genomic breeding values. Italian Journal of Animal Science, Pavia, v. 8 (suppl. 2), n. 1, p. 105-107, 2009.
MOSER, G.; TIER, B.; CRUMP, R. E.; KHATKAR, M.S.; RAADSMA, H. W. A comparison of five methods to predict genomic breeding values of dairy bulls from genome-wide SNP markers. Genetics Selection Evolution, Jouy-en-Josas, v. 41, n. 56, 2009. Available at: < http://dx.doi.org/10.1186/1297-9686-41-56>.
MUIR, W. M. Comparison of genomic and traditional BLUP estimated breeding value accuracy and selection response under alternative trait and genomic parameters.
Journal of Animal Breeding and Genetics, Berlin, v. 124, n. 6, p. 342–355, 2007. NEJATI-JAVAREMI, A.; SMITH, C.; GIBSON, J.P. Effect of total allelic relationship on accuracy of evaluation and response to selection. Journal of Animal Science,
Champaign, v. 75, n. 7, p. 1738–1745, 1997.
OSTERSEN, T.; CHRISTENSEN, O. F.; HENRYON, M.; NIELSEN, B.; SU, G.; MADSEN, P. Deregressed EBV as the response variable yield more reliable genomic predictions than traditional EBV in purebred pigs. Genetics Selection Evolution,
Jouy-en-Josas, v. 43, n. 38, 2011. Available at: <http://dx.doi.org/10.1186/1297-9686-43-38>.
SAATCHI, M., SCHNABEL, R. D.; ROLF, M. M.; TAYLOR, J. F.; GARRICK, D. J. Accuracy of direct genomic breeding values for nationally evaluated traits in US Limousin and Simmental beef cattle. Genetics Selection Evolution, Jouy-en-Josas,
v. 44, n. 38, 2012. Available at: <http://dx.doi.org/10.1186/1297-9686-44-38>.
SCHAEFFER, L.R. Strategy for applying genome-wide selection in dairy cattle.
Journal of Animal Breeding and Genetics, Berlin, v. 123, n. 4, p. 218–223, 2006. SOLBERG, T. R.; SONESSON, A. K.; WOOLLIAMS, J. A., MEUWISEEN, T. H. E. Reducing dimensionality for prediction of genome-wide breeding values. Genetics Selection Evolution, Jouy-en-Josas, v. 41, n. 29, 2009. Available at: < http://dx.doi.org/10.1186/1297-9686-41-29>.
USAI, M.G.; GODDARD, M.E.; HAYES, B.J. LASSO with cross-validation for genomic selection. Genetics Research, Cambridge,v. 91, n. 6, p. 427-436, 2009. VANRADEN, P.M.; VAN TASSELL, C.P.; WIGGANS, G.R.; SONSTEGARD, T.S.; SCHNABEL, R.D.; TAYLOR, J.F.; SCHENKEL, F.S. Invited review: Reliability of genomic predictions for North American Holstein bulls. Journal of Dairy Science,
VERBYLA, K.L.; HAYES, B.J.; BOWMAN, P.J.; GODDARD, M.E. Accuracy of genomic selection using stochastic search variable selection in Australian Holstein Friesian dairy cattle. Genetics Research, Cambridge,v. 91, n. 5, p. 307-311, 2009. VILLANUEVA, B.; PONG-WONG, R.; FERNANDEZ, J.; TORO, M. A. Benefits from marker-assisted selection under an additive polygenic genetic model. Journal of Animal Science, Champaign, v. 83, n. 8, p. 1747–1752, 2005.
CHAPTER 2 - Statistical methods for genomic selection in a mice population
Abstract
Background
The availability of high-density panels of SNP markers has opened new perspectives for marker-assisted selection strategies, such that genotypes for these markers are used to predict the genetic merit of selection candidates. Because the number of markers is often much larger than the number of phenotypes, marker effect estimation is not a trivial task. The objective of this research was to compare the predictive performance of ten different statistical methods employed in genomic selection, by analyzing data from a heterogeneous stock mice population.
Results
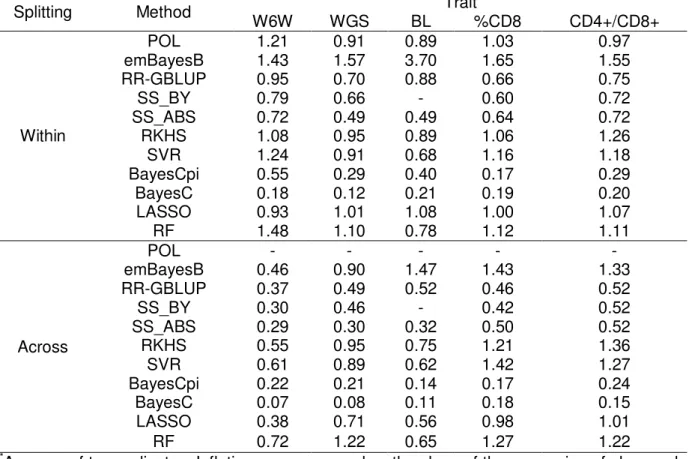
For the five traits analyzed (W6W: weight at six weeks, WGS: growth slope, BL: body length, %CD8+: percentage of CD8+ cells, CD4+/ CD8+: ratio between CD4+ and CD8+ cells), within-family predictions were more accurate than across-family predictions, although this superiority in accuracy varied markedly across traits. For within-family prediction, two kernel methods, Reproducing Kernel Hilbert Spaces Regression (RKHS) and Support Vector Regression (SVR), were the most accurate for W6W, while a polygenic model also had comparable performance. A form of ridge regression assuming that all markers contribute to the additive variance (RR-GBLUP) figured among the most accurate for WGS and BL, while two variable selection methods (LASSO and Random Forest, RF) had the greatest predictive abilities for %CD8+ and CD4+/ CD8+. RF, RKHS, SVR and RR-GBLUP outperformed the remainder methods in terms of bias and inflation of predictions.
Conclusions
across traits and computational requirements, RR-GBLUP, RKHS and SVR are particularly appealing for application in genomic selection.
Keywords: kernel regression, LASSO, Random Forest, ridge regression, SNP, subset
selection
Background
The availability of high-density panels of single nucleotide polymorphisms (SNP) containing thousands of markers opened new perspectives for the study of complex diseases, while has enhanced marker-assisted selection strategies in animal and plant breeding.
The possibility to predict accurately the genetic merit of selection candidates based on their genotypes for SNP markers, a process known as genomic selection [1], is revolutionizing breeding schemes. The reasoning of this process is that whenever marker density is high enough, most QTL will be in high linkage disequilibrium (LD) with some markers and estimates of marker effects will lead to accurate predictions of genetic merit for a trait.
Despite this, the amount of information to be analyzed in this situation poses new challenges from statistical and computational viewpoints. As the number of predictor variables (markers) is generally much higher than the number of observations (phenotypes), there is lack of degrees of freedom to estimate all marker effects simultaneously, what is aggravated by the fact that models may suffer from multicollinearity, especially because markers in close positions are expected to be highly correlated.
There are still few extensive studies aimed to compare predictive performance of such methods in plants or in animals [5]. In the present study, we analyze a publicly available dataset, including pedigree, genotypic and phenotypic information of a mice population. Although this same dataset had already been analyzed previously ([6], [7], [8]), we focus on a broader comparison of statistical methods employed for genomic prediction, by studying five traits that probably have considerable differences in terms of genetic architecture.
Thus, the objective of this research was to compare the predictive performance of ten different statistical methods employed in genomic selection by using data from a heterogeneous stock mice population, aiming to provide some insight in the scope of statistical methods useful for genomic selection and in the interplay between the genetic background of traits and the performance of these methods.
Methods
Data
The data came from a heterogeneous stock mice population kept by The Welcome Trust Centre for Human Genetics (WTCHG) (data are available at
http://gscan.well.ox.ac.uk). Briefly, this population was generated from the crossing of eight inbred lines, followed by 50 generations of random mating. As a result, this population exhibits a high level of linkage disequilibrium, even for pairs of markers separated by until 2Mb [9]. When considering genotypic information obtained with a panel with 11.558 SNP markers and average inter-marker distance of 204 kb, the average r² between adjacent markers was about 0.62 [6]. This amount of LD enhanced QTL mapping for complex traits in mice [10] and would be equally helpful in the context of genomic selection, besides the fact that knowledge of the origin of this population could improve interpretability of the results.
Only animals with both genotypes and phenotypes were considered and details of sampling and genotyping are described in Valdar et al. [11]. The raw data included genotypes for 12,226 SNP markers located in autosomes of 1,940 animals.
evidence of departure from Hardy-Weinberg equilibrium were considered in analyses.
Missing genotypes (0.1%) were imputed using probabilistic PCA (PPCA, [12]). Although the accuracy of this procedure is slightly lower than that of other methods, computing time is much lower. In addition, the proportion of missing genotypes is small enough to neglect the effects of imputation. After data editing, a dataset including information of 1,884 animals for 9,917 markers was considered in marker effect estimation, such that 168 full-sib families with average size of 11 were represented.
Five traits whose heritabilities are quite different were analyzed: percentage of CD8+ cells (%CD8+, h²=0.89), ratio between CD4+ and CD8+ cells (CD4+/ CD8+, h²=0.80), body weight at 6 weeks (W6W, h² = 0.74), growth slope (WGS, h²=0.30), body length (BL, h²=0.13) [11]. Aiming to reduce computing times, phenotypes for each trait were pre-corrected for the significant environmental effects reported by [11].
Regarding to the genetic architecture of the traits in this study, an analysis of the supplementary material in [10] revealed that 17, 11, 19, 10 and 6 QTL were found to be significant on %CD8+, CD4+/ CD8+, W6W, GS and BL, respectively. For the first three of these traits, the QTL mapped were responsible for more than 30% of the their variance (Table 1). The largest QTL with effects on %CD8+ and CD4+/ CD8+ explained about 8.0% and 12% of the variance of these traits, respectively, while the largest QTL on the other traits only accounted for about 3% or less of their variance.
Table 1 - Available information* on the genetic architecture of the traits in study
Trait Nº QTL variance explained (%) largest QTL (%) heritability
%CD8+ 17 36.3 8.00 0.89
CD4+/CD8+ 11 33.1 11.90 0.80
W6W 19 38.3 3.20 0.74
WGS 10 20.6 2.40 0.30
BL 6 16.7 3.10 0.13
When analyzing this dataset, Legarra et al. [6] alerted for the non-random allocation of animals between cages, in a way that many full-sib groups were kept in the same cage and thus additive and environmental effects were confounded at this level. For this reason, phenotypes were also adjusted for this random effect.
For each trait, REML estimates of variance components were obtained using an animal model including all information available (pedigree and phenotypic records) and then phenotypes were adjusted for the environmental effects described previously. In this way, the adjusted phenotypes were obtained as a sum of polygenic and residual effects estimated from the animal model.
Study design
As our focus rely on the comparison of the performance of methods employed to estimate marker effects using real data, we employed a design similar to that employed by [6]. A cross-validation strategy was applied, such that data were split in two sets, reference (REF) and validation (VAL). For all methods, only the information on REF was employed to train the model, then solutions obtained in this step were used to predict the phenotypes of the animals in the VAL set.
The Pearson's correlation between phenotypes and their respective predictions (ry,ŷ), hereinafter regarded as “predictive ability”, would allow comparison
of predictive performance across methods. This approach has also a valuable interpretation in the context of animal breeding: the prediction of unobserved phenotypes mimics the prediction of the future performance of individuals in the population, as discussed in [6], in a way that the expected responses to selection using different methods could be compared.
splitting of data. To ensure a more precise comparison, the different methods were applied in exactly the same partitions of the data.
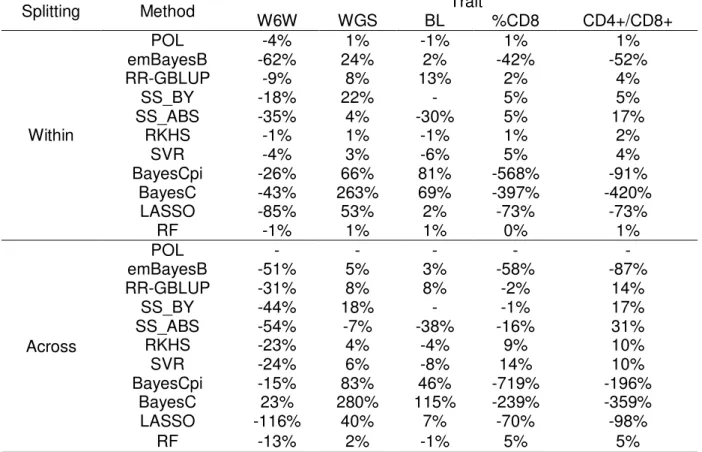
Table 2 - Summary statistics* pertaining to phenotypic data** employed in cross validation
Trait Split N Training size Phenotypes training Phenotypes testing
Min Ave Max Mean SD Mean SD
W6W within 1925 1059 1061.9 1066 -0.155 1.96 -0.188 1.95
WGS within 1917 1056 1059.6 1068 0.001 0.04 0.002 0.04
BL within 1840 1013 1017.9 1035 -0.002 0.40 -0.006 0.40
%CD8+ within 1407 774 778.6 785 0.010 4.34 0.122 4.36
CD4+/CD8+ within 1403 772 774.5 781 0.003 0.07 0.004 0.07
W6W across 1925 1059 1067.6 1081 -0.162 1.95 -0.180 1.96
WGS across 1917 1057 1063.3 1076 0.001 0.04 0.002 0.04
BL across 1840 1014 1022.3 1030 -0.002 0.40 -0.005 0.40
%CD8 across 1407 775 780.9 791 -0.149 4.23 0.319 4.43
CD4+/CD8+ across 1403 774 782.2 799 0.003 0.07 0.003 0.07
*N = total number of phenotypic records. Minimum, average and maximum size of training set
(Min, Ave and Max) and mean and standard deviation (SD) of the adjusted records
considered in training and testing sets (averaged across replicates).**Traits considered:
weight at 6 weeks (W6W), weight growth slope (WGS), body length (BL), percentage of CD8+ cells (%CD8+), ratio between CD4+ and CD8+ cells (CD4+/CD8+). Split = splitting strategy in cross-validation (within or across-family).
It is important to emphasize that full-sib families considered in REF and VAL sets in this study are linked by distant relationships in the case of across-family splitting [6]. Thus, within-family predictions are expected to account for more recent relationships, while across-family predictions would mostly pick up LD persistent among families (i.e. older relationships).
Genomic predictions
The following generic model was fitted to estimate the effect of markers on the trait Y:
y= + Xg + e, (1)
where y is the vector of adjusted phenotypes, is an overall mean, X is a matrix of
genotypes for p SNP loci (whose elements are indicator variables denoting number of copies of allele 1), g is a vector of SNP marker effects and e is a vector of random residual terms. It is worth to emphasize that the adjusted
- RR-GBLUP [1]: shrinkage method in which markers were treated as random effects,
by solving mixed model equations defined in (1) considering the variance ratios
calculated with REML estimates of residual variance (σ²e) and additive genetic
variance (σ²u), obtained in a previous step.
Under these assumptions, the direct solution for equation (1) would be obtained as:
ĝ= (X'X+ I)-1 (X'y) (2),
where = σ²e / (σ²u / k), k = 2 ∑ pi - (1-pi) and pi is the allelic frequency of the ith
marker, as in [13], what reflects the fact that more polymorphic loci contribute more to the genetic variation.
In the present study, we employed an alternative method to solve (1) based on the SVD decomposition of X (i.e. X = UDV' = RV'), as proposed in [14]. These authors showed that identical solutions to those in (2) can be obtained by:
ĝ = V (R'R+ I)-1(R'y) (3), what could be computationally advantageous when p >> n.
-emBayesB : this procedure consists in a BayesB-like method implemented using the
Expectation-Maximization algorithm proposed by [15]. A mixture distribution is assumed for marker effects - a proportion γ of them have effects drawn from a double
exponential distribution, while the remainder effects are drawn from a Dirac Delta (DD) function, which has all its probability mass at 0. In the present study, the
parameter γ was also estimated from the data.
- SS_BY: this method implemented subset selection through a two-step procedure.
First step was carried out to select markers with significant effects on y through single-marker regression. The correction proposed by Benjamini & Yekutieli [16] was used to adjust p-values for multiple comparison (markers were selected using α =
1%). This procedure is often employed to control the false-discovery rate under
dependence assumptions. In the second step, simultaneous estimation of the s
selected markers was done similarly as in (2), by fitting them as random effects. - SS_ABS: marker effects estimated with RR-GBLUP method were screened and
allelic frequency and ĝ the estimated effect for the ith locus. In the second step,
simultaneous estimation of the selected markers was done similarly as in (2).
-RKHS: Reproducing Kernel Hilbert Spaces regression using a Gaussian kernel was
carried out by fitting the following model:
y= + Khα + e,
under the assumption of the following prior distributions α ~ N(0, Kh�2) and e ~ N(0,I �2). The entries of the kernel matrix K
h were defined as:
�ℎ , = exp(−ℎ ),
where the dij the squared Euclidean distance between individuals i and j calculated
based on their genotypes for SNP markers and the smoothing parameter h was defined as h = 2/d* and d* is the mean of dij. This method was implemented in a
Bayesian framework by using a Gibbs sampler, similarly as described by [17].
-SVR: Support vector regression was implemented using a radial basis kernel.
Briefly, this method employs linear models to map (implicitly) the data to a higher-dimensional space via a kernel function. As discussed in [18], one feature of this method is to minimize a cost function that simultaneously includes model complexity and error in the training data. The regularization parameter was set to 1 as well as the default values of the tuning parameters of the function svm (R package 'e1071') were adopted.
-BayesCpi: By following notation from the equation (1), this method postulates a
mixture model for marker effects such that the elements of vector Xg were calculated
for each animal as
N
= j
j j ja I
x
1 , where xjis the genotype of the j
th marker, coded as
the number of copies of one allele, aj is the effect of marker j and Ijis an indicator
variable that assumes the value of 1 whether the jth marker has any effect on the trait or 0, otherwise.
It was assumed that aj ~ N(0, σ²a) and e ~ N (0,Iσ²e). Inverted scaled
chi-squared distributions were postulated for σ²aand σ²e as described in [19]. A binomial distribution with probability (1-π) was assumed for Ij and an uniform prior was
marker effects are sampled from the same (normal) distribution, instead of estimating marker-specific variances.
-BayesC: a similar model to that described for Bayes Cpi was fitted, differing of that by the fact that the parameter π was kept fixed at 0.λ0.
- LASSO [20]: this method can be understood as a shrunken version of least squares
estimates, obtained after minimizing the residual sum of squares subject to the restriction that L1-norm of ĝ (i.e. sum of the absolute value of marker effects ) must
be ≤ t. The threshold t was defined by means of internal cross-validation (10-fold). -RF: the Random Forest algorithm [21] was applied in a regression framework, by
assuming the matrix X as predictor of the phenotypes in y. A random forest of 1000 trees was built and this model was used to predict observations of VAL set.
Implementation
All analyses were performed using the R software [22]. In order to avoid the direct inversion of large matrices, the GSRU algorithm [23] was employed to solve iteratively the linear systems in RR-GBLUP, SS_BY, SS_ABS and emBayesB. To
speed up computations, the implementations for RR-GBLUP, SS_BY, SS_ABS, emBayesB, BayesCpi and BayesC were compiled in C++ language, by using Rcpp package. The method RKHS was implemented using the R code provided by [17]. The other methods were implemented using specific R packages: e1071 (SVR), glmnet (LASSO) and randomForest (RF). REML estimates of variance components were obtained using ASREML-R package [24]. All the analyses were performed on a workstation with a Intel i7-2600 3.40GHz processor and 8GB RAM.
Analyses of results
All methods were compared based on their predictive ability(ry,ŷ), calculated as
Significant differences between methods in terms of predictive ability were assessed by means of paired t tests (α = 5%), adjusted by Bonferroni correction.
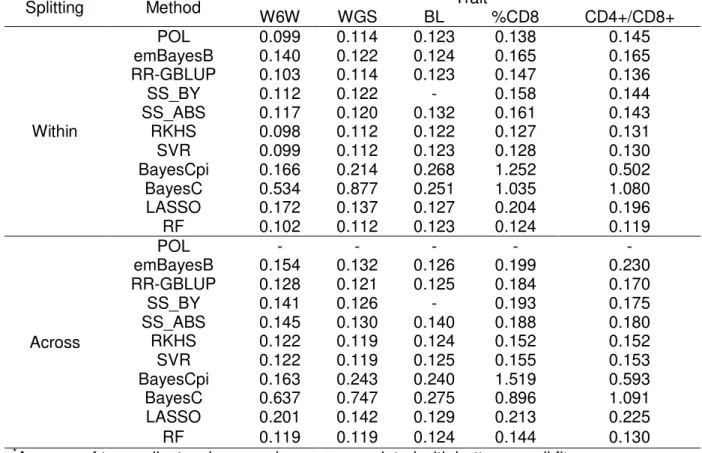
The bias of prediction of each method was measured by the average prediction error, while the trend of inflation was measured by the slope of the regression of the observed phenotypes (y) on their predicted values (ŷ). Mean squared error (MSE) was employed as a measure of the overall fit achieved with each method. As a general rule, values for bias (inflation) close to zero (close to 1) indicate better performance. As the phenotypes for each trait are in different scales, MSE was normalized (NRMSE). NRMSE was computed as the root mean-squared error divided by the range of the observed values. Values close to zero for NRMSE are associated with better overall fit.
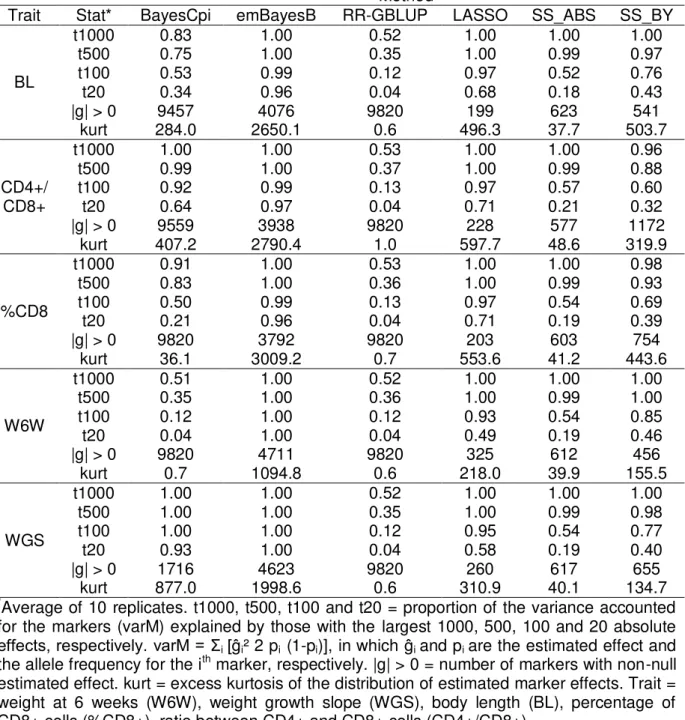
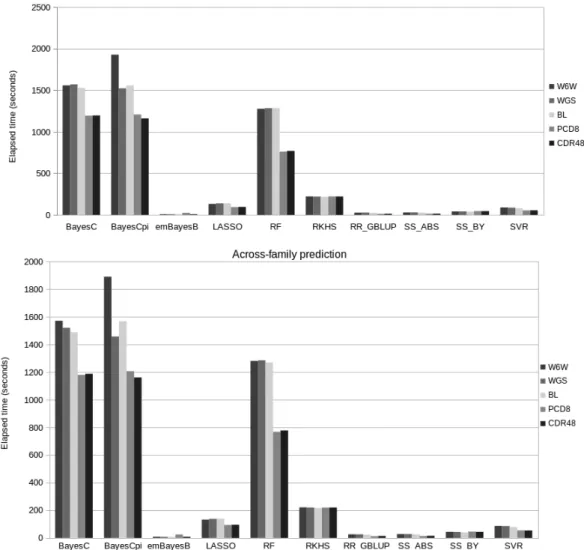
Averages and standard errors (SE) were computed for each statistic by considering the results of the ten replicates available in each situation. The computing times required for the implementation of each method were also monitored and compared. In the case of the methods which explicitly estimate marker effects (i.e. apart from RF, SVR and RKHS), the distributions of marker effects were also examined and compared.
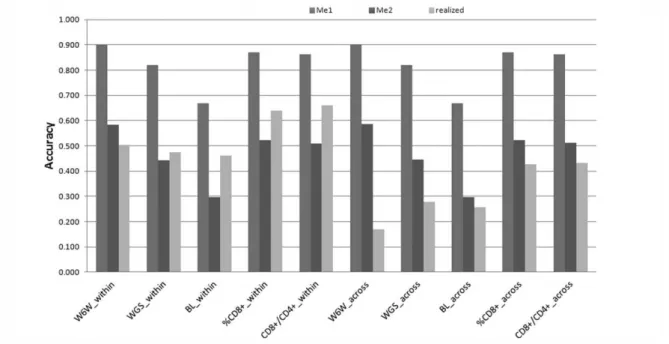
The accuracy of RR-GBLUP was calculated as its predictive ability divided by the square-root of the heritability of each trait ([25]) and then compared with the expected value for this statistic(rg,ĝ), derived according to the formula in Daetwyler et
al. (2010):
(�,�)= ℎ2
ℎ2+ ,
where N is the (average) size of the reference set, h² is the (pseudo)heritability of the trait and Me is the number of independent chromosome segments, calculated as Me = 2NeL/ln(4NeL) or Me = 2NeL ([26]). L is the length of the genome in Morgans and
Ne is the effective population size (calculated in present study based on the estimates of r² between SNP markers). The values of h² considered in the formula accounted for the fact that phenotypes were adjusted for the effect of cage.
Variation in accuracy across genetic groups
present study, it would be reasonable to investigate differences in accuracy of prediction between the unrelated families comprising the mice dataset. Because family sizes are not large enough to enable calculation of predictive ability within each of such families, we investigated this question by clustering the individuals into groups according to the genetic distance between them.
For this, a hierarchical clustering algorithm (Ward's method) was applied to a matrix of genetic distances calculated based on the genomic relationship matrix between the animals, in order to identify non-trivial partitions of the data. The Calinski-Harabaz statistic was employed to find the optimal number of clusters and after this procedure, the solution obtained with Ward's method was refined using k
-means algorithm.
For both within-family and across-family splitting, predictive abilities were calculated within each one of the genetic groups obtained through clustering, for each combination of method, trait and replicate. A Fligner-Killeen test was applied to assess homogeneity of phenotypic variances across groups, such that we could investigate whether eventual differences in predictive ability between groups could be related to differences in phenotypic variances.
Results
Variance components
REML estimates of variance components are presented for each trait in Table 3. Estimated heritabilities for W6W, WGS, BL, %CD8+ and CD4+/CD8+ matched well the previous estimates published by Valdar et al. ([11]) and presented in Table 1. The estimates for W6W, WGS and BL were in agreement to those obtained by [6], being that the largest difference was observed for body length, whose heritability was 7% lower in the present study.
Table 3 - REML estimates of variance components (and related parameters) for traits of a heterogeneous stock mice population
Trait σ²u SE σ²c SE σ²e SE h² SE
W6W 3.915 29.836 1.719 13.100 3.E-05 9.E-04 0.695 0.030
WGS 8.E-04 2.E-04 1.E-03 1.E-04 9.E-04 1.E-04 0.295 0.069
BL 0.036 0.012 0.039 0.007 0.148 0.009 0.161 0.051
%CD8 19.370 2.851 1.990 0.471 0.357 1.505 0.892 0.101
CD4+/CD8+ 5.E-03 7.E-04 6.E-04 1.E-04 4.E-04 4.E-04 0.825 0.081
Trait = weight at 6 weeks (W6W), weight growth slope (WGS), body length (BL), percentage of CD8+ cells (%CD8+), ratio between CD4+ and CD8+ cells (CD4+/CD8+).
σ²uμ additive genetic variance ; σ²c: variance due the random environmental effect of cage;
σ²e: residual variance; h²: heritability (standard error, SE, in brackets).
Within-family predictions
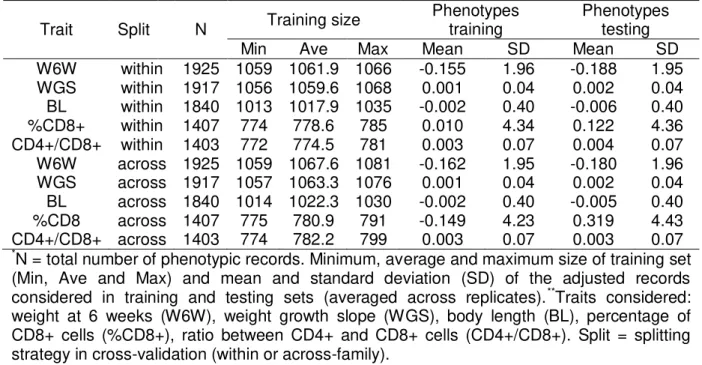
In Figure 1, results of predictive ability under within-family splitting are presented for all methods, grouped by trait, as well as the results obtained when considering only pedigree and phenotypic information (i.e. using the polygenic model, POL). The polygenic model achieved predictive abilities about 0.56, 0.30, 0.15, 0.61 and 0.52 for W6W, WGS, BL, %CD8+ and CD4+/ CD8+, respectively.
Figure 1 - Predictive ability* of the different methods employed in within-family predictions for five traits in a mice population.
*Average of ten replicates. Bars sharing the same letter are not different (P >0.05, pairwise t
test adjusted with Bonferroni correction).
The relative performance of the methods varied noticeably across traits. RKHS, POL and SVR (in this order) were the most accurate for W6W, while RKHS, SVR and RF outperformed the remainder methods with respect to the predictions for WGS. Predictions for BL did not differ greatly across methods, except by the worst performance of SS_BY. LASSO and RF were the two with greater predictive abilities for %CD8+ and CD4+/ CD8+. As a general rule, the methods based in some sort of variable selection (especially LASSO and emBayesB) had better performance in the case of %CD8+ and CD4+/ CD8+ compared to the other traits.
Overall, the subset selection methods (SS_ABS and SS_BY) did not rank among the best methods for none of the traits studied. It is important to mention that for BL, the significance threshold applied in SS_BY was possibly too stringent, since that in only one of the ten replicates significant markers were found, reason why error bars for predictive ability and fitting statistics are not presented in this situation.
Because methods with assumptions close to RR-GBLUP are among the most used in practical applications of genomic selection, it is meaningful to assess the additional gain in predictive ability that can be reached by methods with different assumptions. In present study, predictive ability of RR-GBLUP figured among the highest in the case of predictions for BL and WGS. For the remainder traits, the most accurate methods reached predictive abilities between 12% and 13% greater than RR-GBLUP.
An additional set of analyses was carried out by considering a smaller MAF threshold (1%) for genotypes, aiming to investigate whether lower frequency variants could be important for some of the traits under investigation. As a general rule, predictive abilities of the two sets of analyses did not differ by more than 0.5%, being that the largest increase (2.9%) was observed for WGS when using BayesCpi (data not shown).
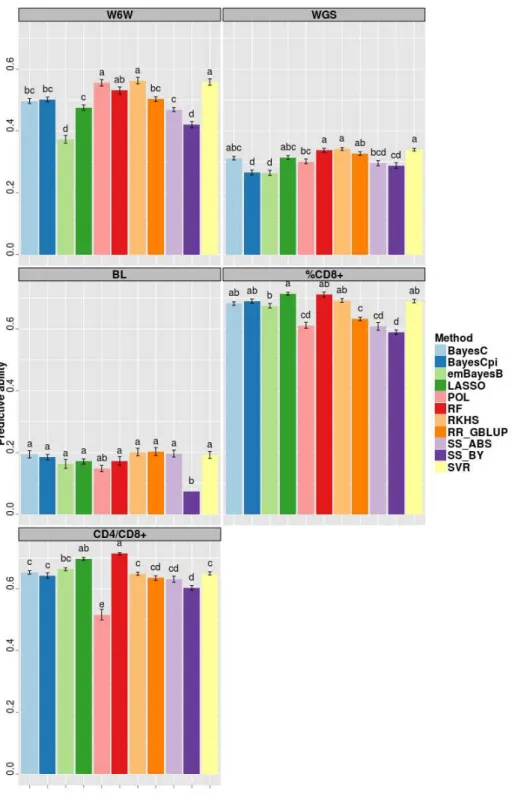
Across-family predictions