Volume 2012, Article ID 615259,8pages doi:10.1155/2012/615259
Research Article
Pharmacokinetics of Photogem Using Fluorescence Spectroscopy
in Dimethylhydrazine-Induced Murine Colorectal Carcinoma
Raduan Hage,
1, 2Juliana Ferreira,
2Vanderlei Salvador Bagnato,
3Jos´e Dirceu Vollet-Filho,
3and H´elio Plapler
11Departamento de Cirurgia, Universidade Federal de S˜ao Paulo (UNIFESP), Rua Botucatu 740, 04023-900 S˜ao Paulo, SP, Brazil
2Instituto de Pesquisa e Desenvolvimento—IP&D, Universidade do Vale do Para´ıba (UNIVAP), Avenida Shishima Hifumi 2911,
12244-000 S˜ao Jos´e dos Campos, SP, Brazil
3Instituto de F´ısica de S˜ao Carlos, Universidade de S˜ao Paulo, Avenida Trabalhador S˜ao Carlense 400,
13566-590 S˜ao Carlos, SP, Brazil
Correspondence should be addressed to Raduan Hage,raduan.dcir@epm.br
Received 13 October 2011; Revised 7 December 2011; Accepted 9 December 2011
Academic Editor: Xie Quan
Copyright © 2012 Raduan Hage et al. This is an open access article distributed under the Creative Commons Attribution License, which permits unrestricted use, distribution, and reproduction in any medium, provided the original work is properly cited.
This study aimed to investigate the pharmacokinetics of a hematoporphyrin derivative in colonic tumors induced by dimethylhy-drazine and adjacent normal colon in Wistar rats using anin vivofluorescence spectroscopy technique. In conventional clinical application of photodynamic therapy, the interval between photosensitizer (PS) administration and lesion illumination is often standardized without taking into account variations due to the type or localization of the tumor and intrinsic differences in the microcirculation and vascular permeability of each target organ. The analysis of the fluorescence spectra was based on the intensity of porphyrin emission band centered at around 620 nm in normal colon and colon tumors. The photosensitizer fluorescence intensity rapidly grew for carcinoma and normal colon, reaching the maximum values 1 and 3 hours after PS injection, respectively. Data presented here allow us to verify that the best compromise between selectivity and drug concentration for colon carcinoma in rats took place in the interval between 1 to 4 h after PS injection.
1. Introduction
Photodynamic therapy (PDT) is an established modality for the treatment against some types of cancers and other nononcologic diseases. PDT involves the interaction of the photosensitizer with a visible light of a specific wavelength and oxygen. The therapeutic effect occurs during the absorption of light, energy by the photosensitizer leading to excited state, generating highly reactive oxygen species, which destroys cellular substrates and leads to cell death. The effects of PDT depend on the simultaneous presence of the PS, excitation light and oxygen [1, 2]. Although oxidative damage is one important component contributing to tumor therapy outcome with PDT, the effects on tumor vasculature interlinked with elicited host response also play a critical role [3].
The efficiency of PDT is directly related to several factors inherent to the target tissue (cellular and vascular structure
of the tumor), photosensitizer (selectivity, solubility in lipid, and cellular placement), and parameters of irradiation, such as wavelength (nm), energy doses (J/cm2), and intensity
(W/cm2) [4].
between photosensitizer application and illumination for all tumor types is not appropriated due to the physiological dependence of the vascularization, mainly when a systemic administration of PS is considered [6].
Most of the experimental studies use the same interval between the administration of the FS and the lesion illumi-nation taking into account only the PS used. Perhaps this is one of the reasons why different results are presented in the literature. In order to improve PDT, the study of temporal evolution of photosensitizer distribution should be done before planning PDT experiments involving treatment of tumor lesions [6].
Fluorescence spectroscopy has been performed exten-sively in animal models to evaluate the uptake of photosensi-tizing agents for photodynamic therapy [6,8]. The method
of in vivo fluorescence spectroscopy is a rapid and useful
technique that may be readily applied to obtain information related to the pharmacokinetic behavior of fluorescent drugs [9,10]. Although the absolute concentration of sensitizer is difficult to be established, fluorescent monitoring is suitable to follow the time variation for the accumulation of a specific PS after injection using the fluorescence peaks associated with this photosensitizer in several tissues [6]. One of the advantages of this technique over other types of fluorescence methods, such as fluorescence microscopy [5, 11,12] and radiolabeling technique [13,14], is the fact that the sacrifice of the animals for the measurements is not necessary, thus reducing the number of animals sacrificed to obtain a given amount of information [6,15]. It also allows simultaneous multiple measurements of a site with optic fiber bundle delivery system and a charge-coupled device. Furthermore, it permits easy access to internal hollow organs by endoscopy [15].
In this study PS uptake measurements were carried out to evaluate the maximal tissue accumulation of the PS (Photogem) in dimethylhydrazine- (DMH-) induced colonic tumors and adjacent normal colon in Wistar rats using an in vivo fluorescence spectroscopy technique. This study shall provide information that can be used in future PDT investigations in this experimental animal colon tumor model.
2. Materials and Methods
2.1. Animals. The whole experiment was carried out in
accordance with the guidelines of the Committee of Ethics in Research of Universidade Federal de S˜ao Paulo for animal care (Protocol number: 1033/05). The male Wistar rats, 180 g weight, received subcutaneous injections of 1,2-dimethylhydrazine (DMH-Aldrich Chemical Co., Milwau-kee, WI, USA) on the dose of 65 mg/kg at weekly interval for five weeks for tumor induction. The animals were kept under adequate conditions and observed for 16 to 18 weeks, the time required for the development of intestinal tumors [16].
2.2. Photosensitizer. The PS chosen for this study is
Pho-togem. This is a hematoporphyrin derivative, made by Photogem LLC Co. (Moscow, Russia). It is usually described
as chemically similar to Photofrin. Both Photogem and Photofrin are mixtures of monomers, dimers, and oligomers of hematoporphyrin derivatives and first-generation PSs. The 5 mg/mL stock solutions of Photogem in 20 mM phosphate-buffered saline, pH 7.4, were stored in the dark at 4◦C [17–22].
2.3. Fluorescence System. Fluorescence collection was
ob-tained using a commercial system (Spectral-Fluorescence System for Diagnosis of Malignant Tumors, “Spectr-Cluster,” v. 2.05 m, Cluster Ltd., Moscow, Russia) composed of a Y-type optical fiber which delivers the laser light through a central fiber and collects the fluorescence from a target tissue using six fibers distributed around central one (integrant part of the system, by Cluster Ltd., Moscow, Russia) and a spectrometer (also built into the commercial system, by Cluster Ltd., Moscow, Russia) to collect fluorescence in the visible to near infrared range (540–850 nm).
The excitation light source was the 532 nm line of Nd:YAG laser with 10 mW of power, which is low enough to avoid thermal effects in the target tissue. This wavelength was chosen for fluorescence spectroscopy since it represents good cost-benefit commitment between light penetration in tissue and fluorescence excitation of porphyrins (although longer wavelengths would allow deeper evaluation, PS excitation would not be observed for those regions). The fluorescent light was filtered with standard optical filter placed at the spectrometer entrance, avoiding the influence of the fluorescence excitation. Figure 1 shows a schematic of the design, illustrating the components of the system.
2.4. Fluorescence Measurements. The animal was
anes-thetized with xylazine (5 mg/kg), ketamine (75 mg/kg), and butorphanol (1 mg/kg) injected intraperitoneal (i.p.). A midline laparotomy was performed, the site of the tumor was identified by palpation, and a longitudinal colostomy was carried out to 2 cm of distance of the opposite the tumor base. Photogem was administered at a dose of 2 mg/kg intravenously on the left caudal vein. The optical fiber was perpendicularly positioned on the surface, touching the tissue (Figure 2), in which fluorescence was evaluated at regular time intervals. For all the kinetics measurements, timet =0 corresponds to the end of the injection. After the
Nd:YAG laser
Spectrometer
Y-shaped fiber
Figure1: Schematic representation for the experimental setup.
Figure2: Fluorescence spectra acquisition in
dimethylhydrazine-induced murine colorectal carcinoma.
2.5. Histological Analysis. After fluorescence measurements,
samples of the normal colon and colon carcinoma were collected and placed in 10% neutral buffered formalin for routine histology preparation and hematoxylin and eosin (H&E) staining for histological examination.
3. Results
Results inFigure 3show typical autofluorescence (i.e., from nonsensitized tissue) spectra from colon carcinoma and normal colon. Two fluorescence peaks are observable, one at around 620 nm and another at around 680 nm, mainly in the colon carcinoma spectrum.
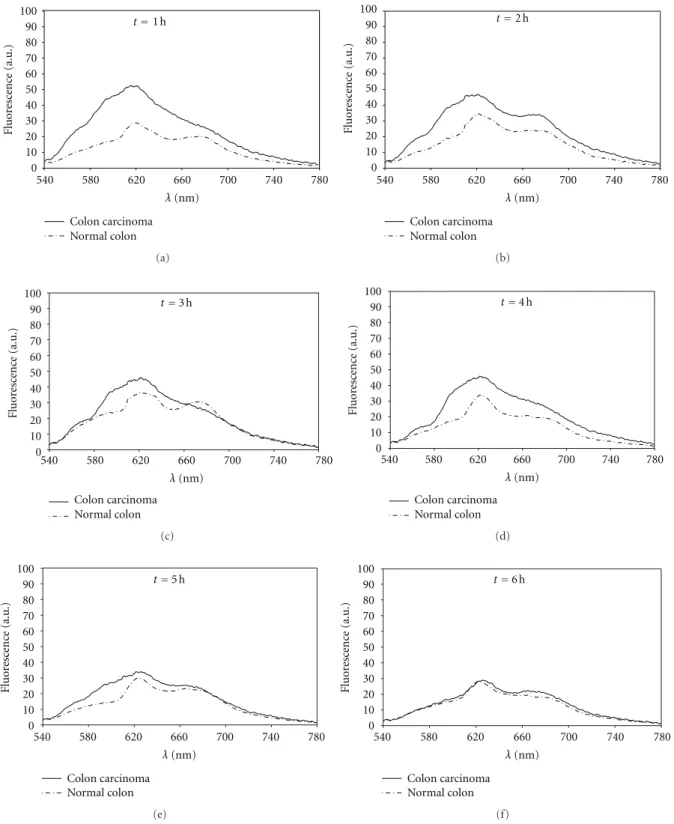
Figure 4shows a temporal sequence of plots with colon
carcinoma and normal colon spectrum obtained in different times after the PS administration. The presented spectra were normalized to the peak observed at excitation wavelength (as described), and the tissue autofluorescence previous to injection (as shown in Figure 3) was subtracted from the collected fluorescence signal during pharmacokinetics. Knowledge of the autofluorescence spectrum before injec-tion allowed for subtracinjec-tion of this component to obtain the fluorescence spectrum of PS at several time intervals after injection [15]. Table 1 shows the relative concentration of
0 10 20 30 40 50 60 70 80 90 100
500 540 580 620 660 700 740 780
Fluor
esc
enc
e (a.u.)
Colon carcinoma Normal colon
λ(nm)
Figure3: Typical fluorescence emission spectra from colon
carci-noma and normal colon.
Table 1: The relative concentration of Photogem in colon
car-cinoma and normal colon according to fluorescence intensity at 622 nm as a function of time after PS administration is presented. Data is shown as the respective values and standard deviation (SD).
Fluorescence signal±SD
Time (h) Colon carcinoma Normal colon
1 51.76±7.65 28.29±9.12
2 46.42±11.51 34.36±3.55
3 45.53±5.11 36.46±14.40
4 45.62±3.24 33.70±7.58
5 33.74±4.91 29.59±5.22
6 28.07±7.84 27.95±13.46
7 25.61±5.16 25.92±4.35
8 24.97±7.49 23.77±5.42
Photogem in colon carcinoma and normal colon according to fluorescence intensity at 622 nm as a function of time after PS administration.
In order to determine the time for accumulation in minutes (Tacc(min)) and for elimination (Telim) of the
pho-tosensitizer, a simple exponential law for each regime was considered. Origin (version 8.0) software was used to fit experimental data. Fitting was performed using the equation
C=C01−e−t/Tacc
(1)
for accumulation and
C=C0e−t/Telim (2)
for elimination ((1) and (2)) in which C represents the
concentration-related fluorescence signal,C0 represents the
initial concentration-related fluorescence signal,trepresents
time, andτrepresents the accumulation (Tacc) or elimination
(Telim) rates.Tacc andTelim were both obtained by the best
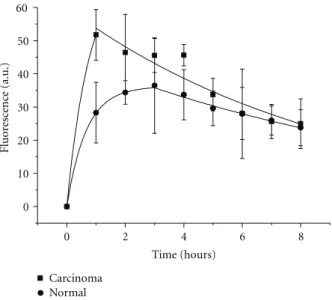
fit of equations (Table 2). First of all we observe a selectivity effects; colon carcinoma has always an uptake higher than normal tissue, based in the best fitting (Figure 5).
0 10 20 30 40 50 60 70 80 90 100
540 580 620 660 700 740 780
Colon carcinoma Normal colon
λ(nm)
t=1 h
Fluor esc enc e (a.u.) (a) 0 10 20 30 40 50 60 70 80 90 100
540 580 620 660 700 740 780
Colon carcinoma Normal colon
λ(nm)
t=2 h
Fluor esc enc e (a.u.) (b) 0 10 20 30 40 50 60 70 80 90 100
540 580 620 660 700 740 780
Colon carcinoma Normal colon
λ(nm)
t=3 h
Fluor esc enc e (a.u.) (c) 0 10 20 30 40 50 60 70 80 90 100
540 580 620 660 700 740 780
Colon carcinoma Normal colon
λ(nm)
t=4 h
Fluor esc enc e (a.u.) (d) 0 10 20 30 40 50 60 70 80 90 100
540 580 620 660 700 740 780
Colon carcinoma Normal colon
λ(nm)
t=5 h
Fluor esc enc e (a.u.) (e) 0 10 20 30 40 50 60 70 80 90 100
540 580 620 660 700 740 780
Colon carcinoma Normal colon
λ(nm)
t=6 h
Fluor
esc
enc
e (a.u.)
(f)
Figure4: Temporal sequence of colon carcinoma and normal colon fluorescence spectra after intravenous injection of Photogem ((a)=1 h;
(b)=2 h; (c)=3 h; (d)=4 h; (e)=5 h; (f)=6 h).
PS fluorescence intensity of normal colon (FInormal), divided
by FInormal:
S= (FIcarc+ FInormal)
FInormal
. (3)
This parameter represents the ability to differentiate tu-mor tissue from normal tissue using fluorescence spectrosco-py information. Selectivity values are shown inTable 3and
0
0 2 4 6 8
10 20 30 40 50 60
Carcinoma Normal
Time (hours)
Fluor
esc
enc
e (a.u.)
Figure 5: Fitting of the accumulative evolution as well as the
elimination time evolution with the equations presented in the text.
0 0.5 1 1.5 2 2.5 3
0 1 2 3 4 5 6 7 8
Selecti
vi
ty
Time (h)
Selectivity
Figure6: Fitting of the selectivity ratio between tumor and normal
tissue.
Table2: Time for accumulation (Tacc) and elimination (Telim) of
the photosensitizer obtained for the normal and colon carcinoma, presented both in minutes.
Tacc(min) Telim
Normal colon 40 min 720 min
Colon carcinoma 47 min 540 min
4. Discussion
Fluorescence intensity of photosensitizer as a function of time after intravenous injection is reported for an experi-mental animal colon tumor model usingin vivofluorescence spectroscopy technique.
Fluorescence collection was used in this study as an evaluator of the PS concentration in tissue, since it has been observed in the literature that there is a correlation between PS fluorescence and concentration [19]. Presently, one is
Table3: Selectivity values as a function of time.
Time (h) Selectivity
1 2.48
2 0.80
3 0.54
4 0.83
5 0.43
6 0.08
7 0.05
8 0.35
not able to obtain the exact amount of PS concentration from fluorescence spectroscopy measurements. Hence, it is assumed that the normalized fluorescence spectra can give one information about the actual PS concentration
in vivo. Therefore, in this study, the information related
to concentration is completely based on the fluorescence collection.
This study does not take into account variations on flu-orescence collection due to tumor dynamics and/or growth rate, because the technique here used is not able to take those variations into account properly (it is not the main issue of the study, anyway, since it aims to an evaluation that can be easily performed in preclinical and clinical trials).
The fluorescence peaks observed inFigure 3(which was collected before the PS administration) can be attributed to the presence of endogenous porphyrins, possibly related to either an altered metabolism of the cancer tissue or microbial synthesis [8,23]. After photosensitizer injection the appear-ance of the emission bands associated with the presence of porphyrin is evident in all spectra, especially in the band centered around 620 nm, one of main fluorescence band of the Photogem [6,24]. Therefore, the accumulation of Pho-togem was evaluated by the difference at the main peak at 622 nm. The amplitude of these emission peaks can be associated with relative porphyrin quantities present in the tissue, which are related to the fluorescence spectrum of the photosensitizer previous to injection. It cannot be, however, associated with absolute concentration, due to fluorescence distortions observed for porphyrins in tissue, which make difficult to extract information that can be associated with accurate concentration values [6].
Considering the additional amplitude of photosensitized tissue fluorescence as being proportional to the tissue concentration of photosensitizer, we observe that for tumor tissue the time of maximum accumulation is around 1 h and for the normal tissue 3 h (Table 1). Since the time variation of the photosensitizer fluorescence is the compromise between accumulation and clearance, we will consider that, initially, this compromise is dominated by the accumulation of photosensitizer and the long times behavior as dominated by elimination (Figure 5).
in adjacent normal tissue, although the initial time of accu-mulation (Tacc) was similar (Table 2) for both. During the
photosensitization of a tissue, there are many mechanisms taking place, which determine the observed times. The mechanism by which the PS is localized preferentially in can-cerous tissue is still not well understood, but it is believed to be associated with the tumor characteristics including an increased number of low-density lipoprotein receptors, the presence of macrophages, low pH, large interstitial space, leaky vasculature, large amounts of newly synthesized col-lagen, and high lipid content [24,25]. Additionally, tumors usually present a density of vessels that is higher than normal tissue. This fact contributes to an increase in the drug uptake rate, resulting in a faster accumulation in the tumor. Meanwhile, the considerable high amounts of immature collagen fibers that are present on the tumor allow the higher accumulation quantity. The photosensitizer is also predominantly retained in tumor stroma that is the main component of the collagen fibers [12,25]. For this reason, it is believed that tumors can accumulate a higher amount of sensitizer, as observed through the presented measurements. The observation of almost twice more PS on the tumor than on the normal tissue after one hour is in clear agreement with this argument. On the other hand, the PS was eliminated slower from normal tissue than from carcinoma tissue, suggesting that the vascular network and the lymphatic system surrounding the tumor are the determinant factors of the elimination time [12,25].
This result follows the same behavior described by Melo et al. [6] that observed the faster accumulation of Pho-togem in the liver (30 min) and kidney (40 min), while a slower one has been observed for skin, indicating that the clearance time between PS administration and performance of PDT is intimately correlated with the tissue being treated. We verify that selectivity seems to be a monotonic func-tion of time: a decrease is always observed (Table 3 and
Figure 6). This behavior is an indication that the main
contribution to selectivity arises from the accumulation mechanisms more than from elimination mechanisms.
The interval between photosensitizer administration and illumination is based on the time at which there is maximal difference between PS uptake in target tissue and surround-ing normal tissue.
The initial interest in PDT was based on the selective retention of PS in tumors promoting selective tumor de-struction [26]. Haematoporphyrin derivatives accumulation in a tissue is probably due to host factors, that is, vascular per-meability and lymphatic clearance, coupled with its ability to dissociate from serum protein-binding sites and bind to cellular sites [24,25].
In terms of measurement of PS concentrationin vivo, there is clear evidence that the variation of drug concentra-tion among subjects, and even the variaconcentra-tion within tumor, can be very large [10]. Another important observation is the fact that Photogem is not a chemically pure compound but a mixture of purified fractions of hematoporphyrin derivate, oligomeric and monomeric porphyrins, and when in solu-tion it tends to dimerize, and this type of reacsolu-tion may per-haps contribute to a variance in fluorescence signal [6]. The
Photogem fluorescence intensity rapidly grew for both colon carcinoma and normal colon reaching the maximum values 1 and 3 hours after PS injection, respectively.
Another important point to be considered in the analysis is that tissue absorption of the excitation and fluorescence light is difficult to be avoided, since the excitation and the very fluorescence of the PS molecules are affected by the sur-rounding medium. Even using lesion autofluorescence pre-vious to sensitization to account for those modifications, it would not avoid completely this effect, because the PS mol-ecule own emission is modified in tissue. So, we have used only the fluorescence collected from the sensitized lesion, and such consideration may have an influence on the fluctuation observed for PS concentration on the collected data.
For Photofrin the maximal tumor selectivity ratio (2 : 1) between tumor and normal tissue has been found between 1 and 2 hours after intravenous injection for early-stage squa-mous cell carcinomas of the oral cavity, the upper aerodiges-tive tract, the esophagus, and the tracheobronchial tree [15], which is in accordance with the data from our present study for colon carcinoma. The maximum selectivity about 2.5 : 1 was reached after 1 hour of the Photogem injection (Table 3
andFigure 6).
The photosensitizer is also predominantly retained in tumor stroma, with no detectable difference between tumor mucosa and normal mucosa [26]. Ideally, the photosensi-tiser should be selectively retained within the tumor to be destroyed with minimal retention in the surrounding normal tissues. Such high selectivity, however, is not attained with currently used photosensitizers (haematoporphyrin deriva-tive and its purified versions), and therefore damage to nor-mal tissues has to be considered, although this is acceptable provided that safe healing occurs [26].
In order to eradicate a tumor, all malignant cells must be destroyed, mainly those in the area where the tumor is invad-ing normal tissue. Apparently, the photosensitizer selectivity for tumor tissue, in this region, does not seem to offer many therapeutic benefits. The results may support evidence that, during PDT treatments, it would be necessary to use treatment parameters that kill at least some normal tissue to obtain complete eradication of a tumor [12].
The results reported in the present study show that the method of in vivo fluorescence spectroscopy showed to be an useful technique that may be readily applied to obtain information related to the pharmacokinetic behavior of fluorescent drugs in dimethylhydrazine- (DMH-) induced colonic tumors and adjacent normal colon, according to other studies that evaluated, by the same technique, the kinetics of HpD in organs such as kidney, liver [6], and skin [9].
Many investigators only compare the photosensitizer uptake in subcutaneously transplanted tumors with that in surrounding tissues (muscle and skin), and such results have little relevance to clinical practice for tumors of organs such as the colon [12]. In the present study, the PS uptake was carried out in an animal model of colon cancer therefore with the similar microenvironment is found in clinical practice.
decreasing with time. Above 4 h, it seems that selectivity becomes independent of time. Also for the selected interval, the drug concentration on the tumor compared to the nor-mal tissue is always above 70% higher, which has been considered appropriate to perform PDT.
As a final concern on the validity of the assumptions here made, it should be emphasized that this is an initial study. Evidence observed here is not conclusive, but allows estimating a good interval to the use of haematoporphyrin derivatives in rats for the treatment of colon carcinoma. Besides, improving fluorescence techniques with biochem-ical analyses might allow better understanding on the PS dynamics in normal and abnormal tissue. Performing those trials shall be the emphasis of future studies.
5. Conclusion
Pharmacokinetics monitoring has the determination of better time windows for the performance of PDT treatment as a main purpose. Data presented here is initial, and studies using larger experimental groups and evaluating biochemical information resulting form kinetics. However, this initial study evidences a best compromise between selectivity and drug concentration for colon carcinoma in rats and that this takes place during the interval between 1 to 4 h after PS injection.
Conflict of Interests
No competing financial interests exist.
Acknowledgments
The authors acknowledge the “Fundac¸˜ao de Amparo `a Pesquisa do Estado de S˜ao Paulo”—FAPESP, for the Grant number 2005/01245-0, under which this research was con-ducted.
References
[1] T. J. Dougherty, C. J. Gomer, B. W. Henderson et al., “Photo-dynamic therapy,”Journal of the National Cancer Institute, vol. 90, no. 12, pp. 889–905, 1998.
[2] S. Pervaiz and M. Olivo, “Art and science of photodynamic therapy,”Clinical and Experimental Pharmacology and
Physi-ology, vol. 33, no. 5-6, pp. 551–556, 2006.
[3] M. Korbelik and I. Cecic, “Complement activation cascade and its regulation: relevance for the response of solid tumors to photodynamic therapy,” Journal of Photochemistry and
Photobiology B, vol. 93, no. 1, pp. 53–59, 2008.
[4] B. C. Wilson and M. S. Patterson, “The physics, biophysics and technology of photodynamic therapy,”Physics in Medicine and
Biology, vol. 53, no. 9, pp. R61–R109, 2008.
[5] S. A. Pahernik, M. Dellia, F. Berr, A. Tannapfel, C. H. Wittekind, and A. E. Goetz, “Distribution and pharrnacoki-netics of Photofrinin human bile duct cancer,”Journal of
Photochemistry and Photobiology B, vol. 47, pp. 58–62, 1998.
[6] C. A. S. Melo, C. Kurachi, C. Grecco, C. H. Sibata, O. Castro-e-Silva, and V. S. Bagnato, “Pharmacokinetics of Photogem using fluorescence monitoring in Wistar rats,” Journal of
Photochemistry and Photobiology B, vol. 73, no. 3, pp. 183–188,
2004.
[7] J. Stukavec, V. Duchac, L. Horak, and P. Pouckova, “Photo-dynamic therapy of human colorectal carcinoma cell line,”
Photomedicine and Laser Surgery, vol. 27, no. 1, pp. 107–110,
2009.
[8] N. Ramanujam, “Fluorescence spectroscopy of neoplastic and non-neoplastic tissues,”Neoplasia, vol. 2, no. 1-2, pp. 89–117, 2000.
[9] J. C. Kennedy, P. Nadeau, Z. J. Petryka, R. H. Pottier, and G. Weagle, “Clearance times of porphyrin derivatives from mice as measured by in vivo fluorescence spectroscopy,”
Photochemistry and Photobiology, vol. 55, no. 5, pp. 729–734,
1992.
[10] C. Sheng, B. W. Pogue, E. Wang, J. E. Hutchins, and P. J. Hoopes, “Assessment of photosensitizer dosimetry and tissue damage assay for photodynamic therapy in advanced-stage tumors,”Photochemistry and Photobiology, vol. 79, no. 6, pp. 520–525, 2004.
[11] M. V. Agrez, R. E. Wharen, and R. E. Anderson, “Hematopor-phyrin derivative: quantitative uptake in dimethylhydrazine-induced murine colorectal carcinoma,” Journal of Surgical
Oncology, vol. 24, no. 3, pp. 173–176, 1983.
[12] H. Barr, P. Chatlani, C. J. Tralau, A. J. MacRobert, P. B. Boulos, and S. G. Bown, “Local eradication of rat colon cancer with photodynamic therapy: correlation of distribution of photosensitiser with biological effects in normal and tumour tissue,”Gut, vol. 32, no. 5, pp. 517–523, 1991.
[13] R. B. Veenhuizen and F. A. Stewart, “The importance of flu-ence rate in photodynamic therapy: is there a parallel with ion-izing radiation dose-rate effects?”Radiotherapy and Oncology, vol. 37, no. 2, pp. 131–135, 1995.
[14] P. Cramers, M. Ruevekamp, H. Oppelaar, O. Dalesio, P. Baas, and F. A. Stewart, “Foscanuptake and tissue distribution in relation to photodynamic efficacy,”British Journal of Cancer, vol. 88, no. 2, pp. 283–290, 2003.
[15] D. R. Braichotte, G. A. Wagnieres, R. Bays, P. Monnier, and H. E. Van den Bergh, “Clinical pharmacokinetic studies of pho-tofrin by fluorescence spectroscopy in the oral cavity, the esophagus, and the bronchi,”Cancer, vol. 75, no. 11, pp. 2768– 2778, 1995.
[16] L. L. S. Laranjeira, M. O. Taha, A. Ferme, R. Lemos, and H. Plapler, “Localizac¸˜ao de les˜oes tumorais induzidas pela 1,2-dimetilhidrazina e seu grau de atipia no c ´olon de ratos,”Acta
Cir´urgica Brasileira, vol. 13, no. 3, 1998.
[17] P. Company, Photogem, in Russian Pharmacopoeia. Ministry of Health of Russian Federation, 1999.
[18] A. F. Mironov, A. N. Nizhnik, and A. Y. Nockel, “Hematopor-phyrin derivatives: an oligomeric composition study,”Journal
of Photochemistry and Photobiology B, vol. 4, no. 3, pp. 297–
306, 1990.
[19] J. D. Vollet-Filho, P. F. C. Menezes, L. T. Moriyama et al., “Possibility for a full optical determination of photodynamic therapy outcome,”Journal of Applied Physics, vol. 105, no. 10, Article ID 102038, 2009.
[20] J. Ferreira, C. Kurachi, C. A. S. Melo, L. T. Moriyama, S. Zucoloto, and V. S. Bagnato, “Necrosis Characteristics of Photodynamics Therapy in Normal Rat Liver,”Laser Physics, vol. 14, no. 2, pp. 209–212, 2004.
[22] K. T. Moesta, B. Ebert, T. Handke et al., “Protoporphyrin IX occurs naturally in colorectal cancers and their metastases,”
Cancer Research, vol. 61, no. 3, pp. 991–999, 2001.
[23] V. Kulvietis, E. Zakarevicius, J. Lapienis, G. Grazieliene, V. Zalgeviciene, and R. Rotomskis, “Accumulation of exogenous sensitizers in rat brain,”Acta Medica Lituanica, vol. 14, pp. 219–224, 2007.
[24] P. J. Bugelski, C. W. Porter, and T. J. Dougherty, “Autoradio-graphic distribution of hematoporphyrin derivative in normal and tumor tissue of the mouse,”Cancer Research, vol. 41, no. 11 I, pp. 4606–4612, 1981.
[25] H. Barr, S. G. Bown, N. Krasner, and P. B. Boulos, “Photody-namic therapy for colorectal disease,”International Journal of
Colorectal Disease, vol. 4, no. 1, pp. 15–19, 1989.
[26] S. G. Bown, “Photodynamic therapy to scientists and clini-cians—one world or two?” Journal of Photochemistry and
Submit your manuscripts at
http://www.hindawi.com
Hindawi Publishing Corporation
http://www.hindawi.com Volume 2014
Inorganic Chemistry International Journal of
Hindawi Publishing Corporation
http://www.hindawi.com Volume 2014
Photoenergy
Hindawi Publishing Corporation
http://www.hindawi.com Volume 2014
Carbohydrate
Chemistry
International Journal of
Hindawi Publishing Corporation
http://www.hindawi.com Volume 2014 Journal of
Chemistry
Hindawi Publishing Corporation
http://www.hindawi.com Volume 2014
Physical Chemistry
Hindawi Publishing Corporation http://www.hindawi.com
Analytical Methods in Chemistry Journal of
Volume 2014
Bioinorganic Chemistry and Applications
Hindawi Publishing Corporation
http://www.hindawi.com Volume 2014
Spectroscopy
International Journal ofHindawi Publishing Corporation
http://www.hindawi.com Volume 2014
The Scientiic
World Journal
Hindawi Publishing Corporationhttp://www.hindawi.com Volume 2014 Medicinal Chemistry
Hindawi Publishing Corporation
http://www.hindawi.com Volume 2014
Chromatography Research International
Hindawi Publishing Corporation
http://www.hindawi.com Volume 2014
Applied ChemistryJournal of Hindawi Publishing Corporation
http://www.hindawi.com Volume 2014
Hindawi Publishing Corporation
http://www.hindawi.com Volume 2014
Theoretical Chemistry Journal of
Hindawi Publishing Corporation
http://www.hindawi.com Volume 2014 Journal of
Spectroscopy
Analytical Chemistry Hindawi Publishing Corporation
http://www.hindawi.com Volume 2014
Journal of
Hindawi Publishing Corporation
http://www.hindawi.com Volume 2014
Quantum Chemistry
Hindawi Publishing Corporation
http://www.hindawi.com Volume 2014
International
Electrochemistry
International Journal ofHindawi Publishing Corporation
http://www.hindawi.com Volume 2014
Hindawi Publishing Corporation
http://www.hindawi.com Volume 2014