Environmental Risk Factors in Han and
Uyghur Children with Dyslexia: A
Comparative Study
Hua Zhao1,2, Baoping Zhang1, Yun Chen1, Xiang Zhou1, Pengxiang Zuo1*
1Medical School, University of Shihezi, Xinjiang, China,2Medical School, Quzhou College of Technology, Zhejiang, China
Abstract
Background
Several studies have been conducted to explore risk factors for dyslexia. However, most studies examining dyslexia have been skewed toward Western countries, and few have considered two nationalities simultaneously. This study focused on differences in dyslexia prevalence and potential environmental risk factors between Han and Uyghur children.
Methods
A cross-sectional study was conducted in Kashgar and Aksu, cities in Xinjiang province, China. A two-stage sampling strategy was used to recruit 2,854 students in grades 3–6 from 5 primary schools in 5 districts; 2,348 valid student questionnaires were included in the analysis. Dyslexia checklists for Chinese and Uyghur children and pupil rating scales were used to identify children with dyslexia. Questions related to the home literacy environment and reading ability were used to evaluate potential environmental risk factors. Single factor analysis and multivariate logistic regression were used to examine prevalence and risk fac-tors for dyslexia.
Results
Dyslexia prevalence differed significantly between Han (3.9%) and Uyghur (7.0%) children (P<0.05), and the boy-to-girl diagnosis ratio was almost 2:1. Multiple logistic regression analysis showed that ethnic differences in dyslexia prevalence between Han and Uyghur children could have occurred because of factors such as mother’s occupation (P= 0.02,
OR= 0.04, 95%CI= 0.01–0.68) and the frequency with which parents told stories (P= 0.00, OR= 4.50, 95%CI= 1.67–12.11).
Conclusions
The prevalence of dyslexia was high in all children, particularly those in the Uyghur group. Environmental factors could have been responsible for some of the differences observed. a11111
OPEN ACCESS
Citation:Zhao H, Zhang B, Chen Y, Zhou X, Zuo P (2016) Environmental Risk Factors in Han and Uyghur Children with Dyslexia: A Comparative Study. PLoS ONE 11(7): e0159042. doi:10.1371/journal. pone.0159042
Editor:Stefano Federici, University of Perugia, ITALY
Received:October 21, 2015
Accepted:May 19, 2016
Published:July 14, 2016
Copyright:© 2016 Zhao et al. This is an open access article distributed under the terms of the Creative Commons Attribution License, which permits unrestricted use, distribution, and reproduction in any medium, provided the original author and source are credited.
Data Availability Statement:All relevant data are within the paper.
Funding:The National Natural Science Foundation of China Project No. 81360434.
The results contribute to the early identification and management of dyslexia in children from these two groups and research examining developmental dyslexia and differences in racial genetics.
Introduction
Developmental dyslexia (DD), or reading disability, is characterized by impaired reading per-formance despite adequate motivational, educational, and intellectual opportunities and the absence of sensory or neurological disability[1]. The disorder affects recognition speed, lan-guage processing, and understanding. In Western countries, the prevalence ofDDis estimated at 5–12% in school-age children whose native language is English[2,3]. In China, research into
DDbegan relatively late and focused mainly on Han children, for whom the incidence ofDD
was 3.9–8%[4,5].DDis an important and controversial concern worldwide. Research has shown thatDDinitially manifests in the early years of childhood. Although its etiology and pathology remain elusive, there is abundant evidence suggesting that both genetic and environ-mental factors contribute toDD. Genetic association studies have identified several candidate genes associated withDD, includingDCDC2,DYX1C1,ROBO1, andKIAA0319[1,2,6]. These genes can change the structure of protein, which may lead to changes in its functional proper-ties. However, studies in different languages have yielded conflicting results[6–10].
Moreover, cross-sectional studies have shown that some risk factors, such as maternal edu-cational levels, home literacy environment (HLE), and socioeconomic status (SES), were associ-ated with the treatment of children withDD[4,11,12]. However, the results of several other studies have indicated thatSESfactors play a minimal role inDD[5]. Moreover, risk factors associated withDDcould differ across language, race, and culture, resulting in differences between children from different ethnic backgrounds. Xinjiang lies in the far northwest of China, where Central and Western Asian cultures converge. The region is populated by various ethnic groups and predominantly by Uyghur and Han. Because of differences in the nature of the languages spoken and the specificity of the cultures,DDprevalences and risk factors differ between Han and Uyghur groups.
With respect to the nature of the languages spoken, Uyghur children are typically educated in both Uyghur and Chinese. The home language (Uyghur) is used until children enter school, but once they reach the third grade, there is a gradual change, whereby Chinese is used in Chi-nese lessons and Uyghur in others. In contrast, ChiChi-nese children are educated only in ChiChi-nese. Uyghur belongs to the Turkic language group, which is a branch of the Altaic language family, and uses a phonetic writing system. It involves a completely transparent script and has predict-able, bidirectional mapping between orthography and phonology, while Chinese has an ideo-graphic writing system, whereby symbols are used to express words or morphemes in the language, with low transparent orthography [13]. Therefore, children could experience diffi-culty in one or both languages. To date, knowledge ofDDin Uyghur children has been limited relative to that ofDDin children acquiring English (low transparent orthography with inflec-tional morphology). Results of studies focusing onDDin the Han Chinese language (low trans-parent orthography with isolation or noninflectional morphology) cannot be generalized to Uyghur (high transparent orthography with agglutination in morphology).
In addition, cultural differences could lead to greater diversity in genetic makeup and lower
For decades, Han distribution was largely in northern Xinjiang, in the Tianshan veins, whereas Uyghur people gathered in the southern area of the province [14]. In addition, Uyghur people follow the Muslim religion, which prohibits marriage to non-Muslims [14], and formed an iso-lated genetic group. From a wider perspective, Xinjiang remains relatively undeveloped eco-nomically, socially, and educationally, and this is particularly evident in the Uyghur group. Uyghur people typically have low household incomes, and the implementation of a more lib-eral childbirth policy for this group would exacerbate this situation. The latest statistics indicate that there are approximately 1.9 million students in the 3,533 primary schools in Xinjiang province. Although less well researched,DDalso exists in school-age children of Uyghur eth-nicity. Zuo et al. [15] noted that the prevalence ofDDin Uyghur children was approximately 6.8%. In addition, previous research [4,5,15] has indicated thatDDprevalence differs between the Han and Uyghur groups. We conducted this study to examine differences inDDprevalence and potential environmental risk factors between Han and Uyghur children. We also explored racial differences inDDin an attempt to obtain a more accurate pathogenesis of the disorder and provide evidence for further intervention.
Methods
Participants
Our study was conducted in the Kashgar and Aksu administrative offices located in the south of Xinjiang province, China, which has a population of 6,685,800 and spans 264,723 square kilometers. In 2013, there were approximately 633,142 students in the 1,552 primary schools in the area. Based on population and economic status, these two regions are classed as medium-sized cities [16]. Therefore, the results of the current study could be generalized to other medium-sized cities in Xinjiang province. As there are numerous primary schools in each region, we used cluster sampling to select 42 primary schools, with a total of 7,452 students in grades 3–6. Of these, we chose 5 Uyghur-Chinese bilingual primary schools, with a total of 2,854 students in grades 3–6, for inclusion in the study.
Materials
In our cross-sectional survey, the questionnaire included the following: 1)The Pupil Rating Scale Revised Screening for Learning Disability (PRS)[17] is a convenient instrument that has been widely used to identify reading disability in China. The questionnaire contains 24 items divided into 5 categories including listening comprehension and memory, language, time and location judgment, athletic ability, and social behavior. It was completed by the head teacher and based on students’performance at school. The mean score and standard deviation ofPRS
in the present study were 76.77 and 10.21 respectively. 2)The Dyslexia Checklist for Chinese Children (DCCC)[18] is a Chinese rating scale forDD, with well-established reliability and validity. The questionnaire contains 57 items divided into 8 factors: oral ability, written expres-sion, reading habits, attention, visual perception, writing, hearing, and comprehension. The scale uses 5-point scoring criteria, with 1 indicating that the behavior is never observed, and 5 indicating that it always occurs. The participants’Chinese parents (either one or both) com-pleted the questionnaire based on the children’s daily performance. Higher scores indicated that the child’s ability was considered poorer. Referring to our norm ofDCCC, the mean score and standard deviation were 118.87 and 39.75 respectively. 3)The Dyslexia Checklist for Uyghur Children (DCUC)was based on theDCCCand developed using forward and back translation. The questionnaire was found to have good reliability (retest correlation coefficients from 0.67% to 0.76%) and fair validity (criterion validity correlation coefficients from−0.39 to
based on the children’s daily performance. Referring to our norm ofDCUC, the mean score and standard deviation were 130.39 and 42.66 respectively. 4)The Home Literacy Environment and Reading Ability Survey Scale (HLE-RA)[4] contains three factors: general information, home literacy environment, and children’s reading habits. The participants’guardians com-pleted the questionnaire to evaluate the children's family background and reading environ-ment. 5)The China-Wechsler Intelligence Scale for Children (C-WISC)[19] classifies children into three groups: those with low intelligence (intelligence quotient[IQ] of<70), critical state (IQfrom 70 to 80), and normal intelligence (IQ of>80). The mean score and standard devia-tion ofC-WISCin the present study were 94.83 and 11.47 respectively.
Procedure
This research was conducted over two months, November and December 2014, by researchers who were familiar with the scales and experienced in epidemiology. The head teachers gathered all of the parents (either one or both) in classrooms and explained the aim of the study and demands of the questionnaire. ThePRSscale was completed by the head teachers, while the
DCCC(for Han children),DCUC(for Uyghur children),HLE-RAscales were completed by parents (either one or both). Results of theC-WISCtest indicated that all participants hadIQ
scores in the typical range. Based on the definition ofDDin theInternational Classification of Diseases 10(ICD-10) andDDdiagnostic criteria in theDiagnostic and Statistical Manual of Mental Disorders fourth Edition(DSM-IV), we adopted a step-by-step screening method for children withDD. The diagnosis ofDDwas based on the following criteria: 1)PRSscore of <65 points; 2) The score ofDCCCwas two standard deviations higher than the mean scores of
Han Chinese children;DCUCscore was two standard deviations higher than the mean scores of Uyghur children; 3) IQ of>80 assessed via theC-WISCtest; and 4) no visual and/or audi-tory disorders or psychiatric diseases.
Analysis
Following double data entry, theSPSS12.0package was used to perform the analyses. Descrip-tive analysis was performed to obtain means ± standard deviations (Mean ± SD) for quantita-tive variables and frequencies for qualitaquantita-tive variables. We used logistic regression analysis to examine the relationship between environmental factors andDDdiagnosis in different groups. The difference in potential environmental risk factors between Han and UyghurDDchildren was examined. Variables found to be statistically significant in the univariate analysis were included in a multivariate logistic regression model. AllPvalues were two-tailed, with a signifi-cance level of 0.05.
Ethics statement
Prior to initiation of the research, written informed consent was obtained from all participants and their guardians. Moreover, the study was approved by the ethical committee at the Medical Association of Shihezi University.
Results
Participant characteristics
Table 1. Descriptive statistics for participants (N= 2,348).
Variables Han Uyghur
N = 1156; n (%) N = 1192; n (%)
Dependent variable: dyslexia#
Dyslexia 45 (3.9) 84 (7.0)
No-dyslexia 1111 (96.1) 1108 (93.0)
Sex
Boys 599 (51.8) 564 (47.3)
Girls 557 (48.2) 628 (52.7)
Grade
Three 325 (28.1) 298 (25.0)
Four 338 (29.2) 381 (32.0)
Five 341 (29.5) 457 (38.3)
Six 152 (13.1) 56 (4.7)
Age*(years), X±SD 10.94±1.3 10.99±1.1
Variables of Socio-Economic Status (SES)
Income of family per month (RBM)
>3000 Yuan 257 (22.2) 300 (25.2)
2000–3000 Yuan 352 (30.4) 325(27.3)
1000–2000 Yuan 331 (28.6) 343 (28.8)
<1000 Yuan 216 (18.7) 224 (18.8)
Occupation of father
Professional technical staff 101 (8.7) 138 (11.6)
Institution, government and office staff 58 (5.0) 206 (17.3)
Business staff 120 (10.4) 143 (12.0)
Manual workers 188 (16.3) 102 (8.5)
Farming, forestry,fishery worker 273 (23.6) 332 (27.9) Classification of inconvenience 416 (36.0) 271 (22.7)
Occupation of mother
Professional technical staff 67 (5.8) 105 (8.8)
Institution, government and office staff 39 (3.4) 175 (14.7)
Business staff 123 (10.6) 114 (9.6)
Manual workers 150 (13.0) 75 (6.3)
Farming, forestry,fishery worker 266 (23.0) 329 (27.6) Classification of inconvenience 511 (44.2) 394 (33.0)
Father’s education level
Junior high school or below 707 (61.2) 647(54.3)
Senior high school or equivalent 273 (23.6) 229 (19.2)
Junior college or above 176 (15.2) 316 (26.5)
Mother’s education level
Junior high school or below 789 (68.3) 625 (52.4)
Senior high school or equivalent 219 (18.9) 232 (19.5)
Junior college or above 148 (12.8) 335 (28.1)
*was represented as Mean±SD deviation #
χ2= 11.3,P<0.01
Uyghur children, 1,163 (49.5%) were boys, and 1,185 (50.5%) were girls. The children’s average age was 10.9 years for both groups. With respect to family income, 300 (25.2%) Uyghur fami-lies and 257 (22.2%) Han famifami-lies earned incomes of>3000 RMB per month. Similarly, 325 (27.3%) Uyghur families and 352 (30.4%) Han families had incomes of 2000–3000RMB, 343 (28.8%) Uyghur families and 331 (28.6%) Han families earned incomes of 1000–2000RMB, and 224 (18.8%) Uyghur families and 216 (18.7%) Han families earned incomes of<1000
RMBper month. With respect to parental occupation, 27.9% of Uyghur fathers were farming, forestry, or fishery workers, and 33.0% of Uyghur mothers were classification of inconvenience. In addition, 23.6% of Han fathers were farming, forestry, or fisheries workers, and a higher proportion of Han parents (36.0% of fathers and 44.2% of mothers) were classified as inconve-nience, which meant that they did not work or worked freelancers. Regarding parental educa-tional levels, 54.3% of Uyghur fathers and 61.2% of Han fathers were educated to junior high school level or below, and 26.5% of Uyghur fathers and 15.2% of Han fathers were educated to junior college level or above. Similarly, most mothers were educated to junior high school level or below, while 28.1% and 12.8% of Uyghur and Han mothers, respectively, were educated to junior college level or above (Table 1).
Dyslexia prevalence rates in boys and girls of different ethnicities
Of 2,348 participants, 129, including 45 Han and 84 Uyghur children, had been diagnosed with
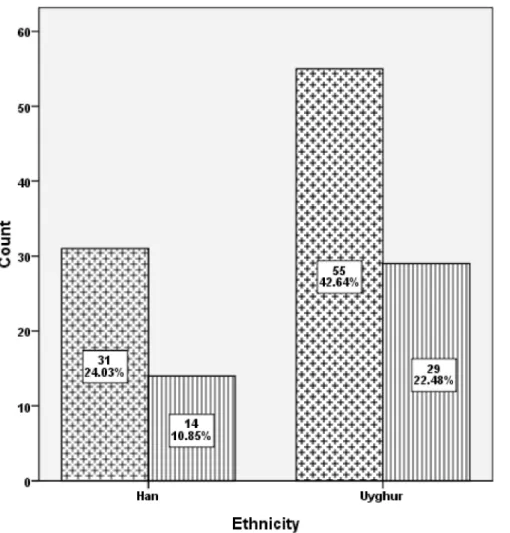
DD. TheDDprevalence rates differed significantly between Han (3.9%) and Uyghur (7.0%) children (χ2= 11.25,P<0.05). The distribution ofDDaccording to sex and ethnicity is shown inFig 1. Of the 129 children withDD, 86 were boys and 43 were girls, and the boy-to-girl diag-nosis ratio was almost 2:1. The proportions of boys who were Han and Uyghur were 24.03% and 42.64%, respectively. Similarly, 10.85% and 22.48% of the girls were Han and Uyghur, respectively.
Factors influencing
DD
diagnosis in Han and Uyghur children
We analyzed the potential risk factors forDDin Han and Uyghur children in the logistic regression analysis. Factors such as sex, mother’s occupation, parental educational level, and mostHLEfactors differed significantly between children with and withoutDDin both groups (P<0.05). However, this difference was not observed for age in either group. In addition, fam-ily income, paternal occupation, and maternal educational level were specifically associated withDDin Uyghur children (P<0.05), and child’s educational grade and book-buying expenses were associated withDDin Han children (P<0.05;Table 2).We then removed the data for children who had not been diagnosed withDD.Table 2
shows the differences in environmental risk factors between Han and Uyghur children with
DD, based on univariate analysis. The results indicate that the prevalence rates forDDwere 5.5%, 5.0%, 2.4%, and 1.3% in grades 3, 4, 5, and 6, respectively, in Han children withDD; these rates were significantly lower relative to those of Uyghur children withDD(P<0.05). There was significant difference in family income between the Han and Uyghur children with
Moreover, there was significant association between the prevalence difference ofDDin this two groups and twoHLEfactors (e.g., Frequency of parents telling stories (P= 0.01,OR= 2.54) and Children have regular reading time (P= 0.04,OR= 0.46)).
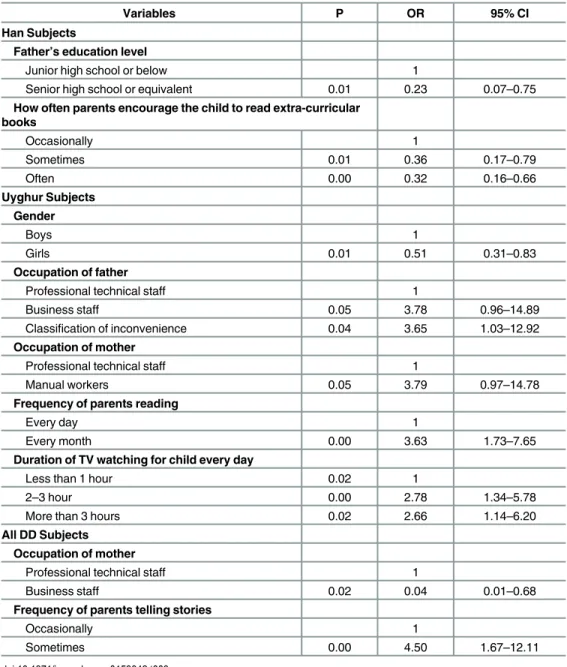
Multivariate logistic regression analysis of the factors influencing
DD
diagnosis in Uyghur and Han children
Multivariate logistic regression analysis was performed to examine the effect sizes for potential risk factors detected in the univariate analysis (Table 3). For Han children, two risk factors (paternal educational level and frequency with which parents encouraged children to read extracurricular books) were entered into the equation. Similarly, five risk factors (sex; paternal occupation; maternal occupation; frequency with which parents tell stories; and child’s daily TV viewing duration) were entered into the equation for Uyghur children. In addition, we includedDDprevalence in Uyghur and Han children as a dependent variable and the six potential risk factors as independent variables in the analysis of the sizes of the effects of these factors onDDprevalence rates. The results showed that four risk factors (maternal occupation and frequency with which parents tell stories) were significantly associated withDDprevalence differences between the Han and Uyghur groups. Relative to the differences in the proportions of Han and Uyghur children withDDwhose mothers were employed as professional or
Fig 1. Distribution of dyslexia according to differences ethnicity and sex.
Table 2. Analytical statistics for Uyghur and Han children with dyslexia.
Variables Han Subjects N = 1156 Uyghur Subjects N = 1192 All DD Subjects N = 129
DD No-DD OR (CI 95%) P DD No-DD OR (CI 95%) P Han-DD Uyg-DD OR (CI95%) P
n = 45 n = 1111 n = 84 n = 1108 n = 45 n = 84
n(%b) n(%b) n(%b) n(%b) n(%c) n(%c)
Gender 0.71(0.39–
1.23)
0.27 0.45(0.28–
0.71)
0.00 0.79(0.37–
1.67) 0.54 Boys 31 (68.9) 568 (51.1) 55 (65.5) 509 (45.9) 31(5.2) 55(9.8) Girls 14 (31.1) 543 (48.9) 29 (34.5) 599 (54.1) 14(2.5) 29(4.6)
Grade 0.64(0.46–
0.88)
0.01 0.89(0.69–
1.14)
0.36 1.50(1.06–
2.36) 0.03 Three 18 (40.0) 307 (27.6) 21 (25.0) 277 (25.0) 18(5.5) 21(7.1) Four 17 (37.8) 321 (28.9) 31 (36.9) 350 (31.6) 17(5.0) 31(8.1)
Five 8(17.8) 333
(30.0) 31 (36.9) 426 (38.4) 8(2.4) 31(6.8)
Six 2(4.4) 150
(13.5)
1(1.2) 55(5.0) 2(1.3) 1(1.8)
Agea(years), X
±SD 10.7
±1.2
10.9±1.3 0.89(0.71–
1.13)
0.35 10.9
±0.9
11.0±1.1 0.95(0.78–
1.17) 0.66 10.8 ±1.2 10.9 ±0.9 1.18(0.83– 1.67) 0.34
Variables of Socio-Economic Status (SES)
Income of family per month (RBM) 0.92(0.69–
1.23)
0.59 1.31(1.06–
1.62)
0.01 1.43(1.18–
2.08)
0.04
>3000 Yuan 11
(24.4) 246 (22.1) 10 (11.9) 290 (26.2) 11(4.3) 10(3.3)
2000–3000 Yuan 15 (33.3) 337 (30.3) 23 (27.4) 302 (27.3) 15(4.3) 23(7.1)
1000–2000 Yuan 11 (24.4) 320 (28.8) 34 (40.5) 309 (27.9) 11(3.3) 34(9.9)
<1000 Yuan 8(17.8) 208
(18.7) 17 (20.2) 207 (18.7) 8(3.7) 17(7.6)
Occupation of father 1.07(0.88–
1.30)
0.51 1.24(1.08–
1.43)
0.00 0.94(0.75–
1.18)
0.60
Professional technical staff 4(8.9) 97(8.7) 4(4.8) 134 (12.0)
4(4.0) 4(2.9)
Institution, government and office staff
4(8.9) 54(4.9) 11
(13.1) 195 (17.6)
4(8.9) 11 (15.6) Business staff 3(6.7) 117
(10.5)
8(9.5) 135 (12.2)
3(2.5) 8(5.6)
Manual workers 5(11.1) 183 (16.5)
2(2.4) 100 (9.1) 5(4.8) 2(5.6)
Farming, forestry,fishery worker
6(13.3) 267(24) 35
(41.7) 297 (26.8)
6(2.2) 35 (10.5) Classification of
inconvenience 23 (51.1) 393 (35.4) 24 (28.6) 247 (22.3) 23(5.5) 24(8.9)
Occupation of mother 1.31(1.02–
1.70)
0.03 1.16(1.01–
1.33)
0.04 0.71(0.52–
0.97)
0.03
Professional technical staff 0(0.0) 67(6.0) 2(2.4) 103(9.3) 0(0.0) 2(1.9)
Institution, government and office staff
1(2.2) 38(3.4) 8(9.5) 167
(15.1)
1(4.4) 8(12.3)
Business staff 5(11.1) 118 (10.6)
2(2.4) 112 (10.1)
5(4.1) 2(1.8)
Table 2.(Continued)
Variables Han Subjects N = 1156 Uyghur Subjects N = 1192 All DD Subjects N = 129
DD No-DD OR (CI 95%) P DD No-DD OR (CI 95%) P Han-DD Uyg-DD OR (CI95%) P
n = 45 n = 1111 n = 84 n = 1108 n = 45 n = 84
n(%b) n(%b) n(%b) n(%b) n(%c) n(%c)
Manual workers 1(2.2) 149 (13.4)
2(2.4) 112 (10.1)
1(1.1) 10 (26.0) Farming, forestry,fishery
worker 9(20.0) 257 (23.1) 35 (41.7) 294 (26.5) 9(3.4) 35 (10.6) Classification of
inconvenience 29 (64.4) 482 (43.4) 27 (32.1) 367 (33.1) 29(5.7) 27(6.9)
Father’s education level 0.55(0.33–
0.93)
0.02 0.65(0.48–
0.87)
0.00 1.40(0.81–
2.42)
0.22
Junior high school or below 37 (82.2) 670 (60.3) 59 (70.2) 615 (54.2) 37(5.2) 59(9.1)
Senior high school or equivalent 3(6.7) 270 (24.3) 10 (11.9) 219 (19.3) 3(1.1) 10(4.4)
Junior college or above 5(11.1) 171 (15.4) 15 (17.9) 301 (26.5) 5(5.7) 15(9.2)
Mother’s education level 0.59(0.34–
1.02)
0.06 0.59(0.44–
0.81)
0.00 1.77(1.16–
3.31)
0.02
Junior high school or below 35 (77.8) 754 (67.9) 59 (70.2) 566 (51.1) 35(4.4) 59(9.4)
Senior high school or equivalent 9(20.0) 210 (18.9) 12 (14.3) 220 (19.9) 9(4.1) 12(5.2)
Junior college or above 1(2.2) 147 (13.3) 13 (15.5) 322 (29.0) 1(1.1) 13(6.5)
Home Literacy Environment (HLE)
Frequency of parents telling stories 0.46(0.26–
0.81)
0.01 0.66(0.46–
0.95)
0.02 2.54(1.29–
5.00) 0.01 Occasionally 33 (73.3) 567 (51.0) 40 (47.6) 365 (32.9) 33(5.5) 40(9.9) Sometimes 10 (22.2) 428 (38.5) 39 (46.4) 599 (54.1) 10(2.3) 39(6.1)
Often 2(4.4) 116
(10.4)
5(6.0) 144 (13.0)
2(1.7) 5(3.4)
How often parents encourage the child to read extra-curricular books
0.53(0.36– 0.77)
0.00 0.60(0.45–
0.81)
0.00 0.94(0.60–
1.49) 0.80 Occasionally 17 (37.8) 172 (15.5) 27 (32.1) 206 (18.6) 17(9.0) 27 (11.6) Sometimes 12 (26.7) 357 (32.1) 35 (41.7) 442 (39.9) 12(3.3) 35(7.3) Often 16 (35.6) 582 (52.4) 22 (26.2) 460 (41.5) 16(2.7) 22(4.6)
Frequency of parents buying books children are interested in
0.49(0.33– 0.74)
0.00 0.63(0.47–
0.84)
0.00 1.52(0.94–
2.44) 0.09 Occasionally 22 (48.9) 277 (24.9) 29 (34.5) 218 (19.7) 22(7.4) 29 (11.7) Sometimes 15 (33.3) 452 (40.7) 31 (36.9) 437 (39.4) 15(3.2) 31(6.6)
Often 8(17.8) 382
(34.4) 24 (28.6) 453 (40.9) 8(2.1) 24(5.0)
Frequency of parents buying new books
1.34(1.02– 1.91)
0.03 1.13(0.95–
1.34)
0.16 0.73(0.62–
1.04)
0.08
Per week 1(2.2) 31(2.8) 1(1.2) 73(6.6) 1(3.1) 1(1.4)
technical staff, the difference between proportions of Han and Uyghur withDDchildren whose mothers were employed as business staff was greatest (P= 0.02,OR= 0.04, 95%
CI= 0.01–0.68). This indicates that in those whose mothers were employed as business staff, Uyghur children were 0.04 times more likely to haveDDrelative to Han children. For parents
Table 2.(Continued)
Variables Han Subjects N = 1156 Uyghur Subjects N = 1192 All DD Subjects N = 129
DD No-DD OR (CI 95%) P DD No-DD OR (CI 95%) P Han-DD Uyg-DD OR (CI95%) P
n = 45 n = 1111 n = 84 n = 1108 n = 45 n = 84
n(%b) n(%b) n(%b) n(%b) n(%c) n(%c)
Per month 2(4.4) 97(8.7) 10
(11.9) 160 (14.4)
2(2.0) 10(5.9)
Per term 6(13.3) 261
(23.5) 11 (13.1) 201 (18.1) 6(2.3) 11(5.2)
Every year 0(0.0) 41(3.7) 8(9.5) 38(3.4) 0(0.0) 8(17.4)
Irregularly 36 (80.0) 681 (61.3) 54 (64.3) 636 (57.4) 36(5.0) 54(7.8)
Children have regular reading time 1.89(1.01–
3.57)
0.04 1.78(1.14–
2.77)
0.01 0.46(0.21–
0.97) 0.04 Yes 15 (33.3) 541 (48.7) 44 (52.4) 733 (66.2) 15(2.7) 44(5.7) No 30 (66.7) 570 (51.3) 40 (47.6) 375 (33.8) 30(5.0) 40(9.6)
Frequency of parents reading 1.72(1.06–
2.80)
0.02 2.56(1.81–
3.65)
0.00 0.84(0.48–
1.48)
0.55
Every day 3(6.7) 184
(16.6)
9(10.7) 287 (25.9)
3(1.6) 9(3.0)
Every week 8(17.8) 314
(28.3) 18 (21.4) 438 (39.5) 8(2.5) 18(4.0)
Every month 34
(75.6) 613 (55.2) 57 (67.9) 383 (34.6) 34(5.3) 57 (13.0)
Duration of TV watching for child every day 1.48(1.11– 1.98)
0.01 1.66(1.32–
2.09)
0.00 0.94(0.65–
1.36)
0.74
Less than 1 hour 10 (22.2) 407 (36.6) 17 (20.2) 414 (37.4) 10(2.4) 17(3.9)
1–2 hour 20
(44.4) 464 (41.8) 38 (45.2) 512 (46.2) 20(4.1) 38(6.9)
2–3 hour 5(11.1) 135
(12.2) 18 (21.4) 113 (10.2) 5(3.6) 18 (13.7) More than 3 hours 10
(22.2)
105(9.5) 11
(13.1)
69(6.2) 10(8.7) 11
(13.8)
Expenses of buying books for child every year 0.56(0.36– 0.90)
0.01 0.87(0.63–
1.21)
0.42 0.95(0.59–
1.54)
0.84
Less than 150 Yuan 29 (64.4) 499 (44.9) 60 (71.4) 695 (62.7) 29(5.5) 60(8.0)
150–300 Yuan 13
(28.9) 441 (39.7) 17 (20.2) 318 (28.7) 13(2.9) 17(5.1)
300–500 Yuan 2(4.4) 115 (10.4)
3(3.6) 68(6.1) 2(1.7) 3(4.2)
More than 500 Yuan 1(2.2) 56(5.0) 4(4.8) 27(2.4) 1(1.8) 4(12.9)
aAge was represented as mean±standard deviation brepresented constituent ratio
crepresented odds ratio, n/N, means the prevalence of dyslexia under each factors.
with occasionally telling stories, the OR to be the prevalence differences ofDDwas 4.5 times as high as those parents only telling story sometimes.
Discussion
To our knowledge, this study was the first to consider the prevalence ofDDand associated risk factors in a large sample of Han and Uyghur children. We also explored the environmental risk factors affectingDDprevalence differences between the Han and Uyghur groups. Our results showed thatDDprevalence differed between Han (3.9%) and Uyghur (7.0%) children, and the boy-to-girl diagnosis ratio was almost 2:1. In addition,SESandHLEfactors were significantly associated withDDin both groups. Factors such as grade, family income, maternal occupation, maternal educational level, and twoHLEfactors (maternal occupation and frequency with which parents tell stories) could exert an impact on differences inDDprevalence between the
Table 3. Multivariate logistic regression analysis of factors associated with dyslexia.
Variables P OR 95% CI
Han Subjects
Father’s education level
Junior high school or below 1
Senior high school or equivalent 0.01 0.23 0.07–0.75
How often parents encourage the child to read extra-curricular books
Occasionally 1
Sometimes 0.01 0.36 0.17–0.79
Often 0.00 0.32 0.16–0.66
Uyghur Subjects
Gender
Boys 1
Girls 0.01 0.51 0.31–0.83
Occupation of father
Professional technical staff 1
Business staff 0.05 3.78 0.96–14.89
Classification of inconvenience 0.04 3.65 1.03–12.92
Occupation of mother
Professional technical staff 1
Manual workers 0.05 3.79 0.97–14.78
Frequency of parents reading
Every day 1
Every month 0.00 3.63 1.73–7.65
Duration of TV watching for child every day
Less than 1 hour 0.02 1
2–3 hour 0.00 2.78 1.34–5.78
More than 3 hours 0.02 2.66 1.14–6.20
All DD Subjects Occupation of mother
Professional technical staff 1
Business staff 0.02 0.04 0.01–0.68
Frequency of parents telling stories
Occasionally 1
Sometimes 0.00 4.50 1.67–12.11
two groups; this was particularly likely for maternal occupation and frequency with which parents tell stories.
Because of linguistic and genetic differences between Uyghur, Chinese, and other popula-tions, theDDprevalence varies between different studies. In European populations, the preva-lence ofDDis 5–12% [2,3]. The corresponding figure for China has been reported as 3.9–8.0% [4]. Zuo et al. showed that theDDprevalence in a Uyghur population was estimated at 6.9% [15]. Similarly, our finding thatDDprevalence in the Han group (3.9%) was significantly lower relative to that of the Uyghur group (7.0%) was consistent with those of previous studies. There are a number of possible reasons for this result. For instance, Uighur children receive bilingual Uyghur and Chinese education, and Uyghur is an alphabetical language with a linear one-dimensional alphabet [20] that differs from Chinese (ideograph language) in linguistic charac-teristics [21]. In addition, previous studies have shown that the cerebral regions activated by Uyghur and Chinese language are not identical and found that activation in the left anterior cingulate gyrus could be associated with the Uyghur language [20]. Moreover, research focus-ing on bilfocus-ingual Chinese and English individuals showed that when children are educated in two languages, the second language is likely to be influenced by the linguistic and cultural con-ventions of the first and vice versa [22]. In addition, molecular studies have found that the Uyghur population is of typical mixed genetic origin, with 60% and 40% of the population of European and East Asian ancestry, respectively; this may explain, at least in part, the genetic influence on studiedDDchildren of Uyghur whose prevalence rate is high than Chinese chil-dren but lower than European chilchil-dren [23]. Further, the Uyghur population formed an iso-lated genetic group, because it was not strongly influenced by recent migration [23], and is overwhelmingly of Muslim faith, which prohibits marriage to non-Muslims [14].
In the present study, although there was no sex difference observed between groups, the boy-to-girlDDdiagnosis ratio was approximately 1:2 in both Han and Uyghur children, and significant differences were observed between sexes in both groups. In Uyghur children, multi-variate logistic regression analysis showed that the proportion of girls withDDwas 0.51 times that of boys. Our results were consistent with those of Renato, who found that a higher number of boys were diagnosed withDDrelative to that of girls [24]. However, Liederman and other researchers considered evidence suggesting a preponderance of boys withDDcontroversial and weak and posited that it required support from other studies [25,26]. There are several pos-sible reasons for this difference. Previous analyses have indicated that girls enjoy a small advan-tage in language production until the age of 36 months [27]. Further, in China, particularly in certain ethnic groups such as the Uyghur, many parents view boys as superior; therefore, edu-cation and the way the child is raised will depend largely on the child’s sex. In terms of aca-demic performance, boys are believed to be good at math, and girls are thought to be good at languages and arts. To some extent, this could reflect sex-related differences linked to the loca-tion of the speech-processing center and differences in cognitive development. Our research implicating a important change in interveningDD, education methods should be selected based on children’s sex because of the sex difference inDDdiagnosis.
Our research also demonstrated that educational grade exerted a significant influence on
DDprevalence in Han, but not Uyghur, children. This discrepancy could have occurred because Han children are under greater pressure to enter better middle schools relative to that exerted on Uyghur Children. Moreover, there were significant differences between grades in Han and Uyghur children withDD. Further,DDprevalence showed a downward trend with progression to higher grades. This could be explained by Shaywitz’s findings indicating that
DDprevalence was lower in higher grades, relative to that in lower grades, because someDD
children. Indeed, the association between grade andDDprevalence remains unclear. In addi-tion, several studies have shown higherDDprevalence in higher grades relative to that observed in lower grades [29]. In order to explore the exact nature of the association between grade and prevalence, further studies should be conducted in the near future.
In previous studies, parental education and occupation and family income representedSES, which has been associated with children’s language development [30]. Our results suggest that
SES-related factors, such as maternal occupation and paternal educational level, were associ-ated withDDin Han children. In addition, allSES-related factors were associated withDDin Uyghur children. Moreover, in both Han and Uyghur groups, the results showed that higher parental educational levels and family income were related to lower risk ofDD. This result could be explained by previous findings indicating that higherSESwas related to reducedDD
prevalence[4]. Further,DDprevalence in Han children was significantly lower relative to that observed in Uyghur children in family income and maternal education level factors even thoughSESin Uyghur group are better than that in Han group. This finding could be explained by linguistic and genetic differences between Han and Uyghur populations, which could have led to higherDDprevalence in Uyghur children relative to that observed in Han subjects [20–23].
Furthermore, results of multiple logistic regression analysis indicated that ethnic differences inDDprevalence between Han and Uyghur children could have occurred because of differ-ences in their mothers’occupations. Relative to the differences in proportions of Uyghur and Han children whose mothers were employed as professional or technical staff, the difference in the proportions of children whose mothers were employed as business staff was greater. This finding indicates that mothers of Han children withDDwere employed mainly as business staff, and as such, rarely stayed at home or communicated with their children; therefore, Han children could have received little attention or verbal stimulation, resulting in a developmental lag in reading ability [30]. However, most Uyghur families were involved in farming and ani-mal husbandry, and mothers had more time to take care of their children. Therefore, mothers play an important role in raising children, if mothers remain at home and communicate with their children more frequently,DDprevalence is likely to decrease.
HLEhas been found to be one of the most important modifiable risk factors forDDin sev-eral studies. Rashid et al. conducted a study involving children with reading disabilities and showed thatHLEwas significantly associated with children’s comprehension and spelling scores [31]. He et al. showed that increasing literacy-related activity and reducing the total time spent using electronic devices was a potentially protective factor for Chinese children at risk of
DD[11]. Similarly, the results of the present study highlighted this point, as the risk ofDD
decreased in children of both groups if their parents provided a betterHLE. Further, other fac-tors, such the frequency with which parents tell stories and whether children have regular read-ing time, were significantly associated withDDprevalence in both Han and Uyghur children. In particular, when parents told stories more frequently, the OR forDDprevalence differences between groups decreased. However, Rashid et al. showed that parents’, rather than children’s, home literacy activities were significantly associated with several types of academic ability in their children. Therefore, to validate the positive effect ofHLE-related factors onDDin both groups, further studies involving Uyghur populations are required.
This study recruited a large sample from two major ethnic groups in the Kashgar and Aksu regions. We collected socioeconomic and environmental variables that were important in examiningDD. The results of our study identified risk factors associated with differences in
associated withDD, and only some of these were analyzed in our study. Details concerning other factors, such as birth history, nursery period, and history of infantile illness, were unknown for the participants in our study. Furthermore, the etiology ofDDis complex, and related neurology, genetics, and psychology have been investigated in many studies [2,9,10]. The present study considered only environmental risk factors affecting Han and Uyghur chil-dren withDD. Further research is required to understand the molecular mechanisms underly-ingDDin Uyghur children and whether they differ when compared to other groups.
Acknowledgments
This research was supported by the National Natural Science Foundation of China, Project No. 81360434
We would like to thank all of the participating children and their parents for their enthusias-tic cooperation. We also acknowledge YX Zhang and YF Wei for data collection, RF Liu and HJ Shi for data entry, and the teachers from the schools in Kashi and Akesu, Xinjiang, China.
Author Contributions
Conceived and designed the experiments: HZ XPZ. Performed the experiments: HZ XPZ YC BPZ. Analyzed the data: HZ XPZ. Contributed reagents/materials/analysis tools: XZ. Wrote the paper: HZ.
References
1. Cope N, Harold D, Hill G, Moskvina V, Stevenson J, Holmans P, et al. Strong evidence that KIAA0319 on chromosome 6p is a susceptibility gene for developmental dyslexia. Am J Hum Genet. 2005; 76: 581–591. PMID:15717286
2. Paracchini S, Scerri T, Monaco AP. The genetic lexicon of dyslexia. Annu Rev Genomics Hum Genet. 2007; 8: 57–79. PMID:17444811
3. Snowling MJ. Early identification and interventions for dyslexia: a contemporary view. J Res Spec Educ Needs. 2013; 13: 7–14. PMID:26290655
4. Sun Z, Zou L, Zhang J, Mo S, Shao S, Zhong R, et al. Prevalence and associated risk factors of dyslexic children in a middle-sized city of China: a cross-sectional study. PloS One. 2013; 8: e56688. doi:10. 1371/journal.pone.0056688PMID:23457604
5. Liu LL, Zou L, Song RR. Home literacy environment analysis of the influence factors about Chinese dyslexia children. Maternal and Child Health Care of China; 2010; 25: 54–56.
6. Shastry BS. Developmental dyslexia: an update. J Hum Genet. 2007; 52: 104–109. PMID:17111266
7. Mascheretti S, Bureau A, Battaglia M, Simone D, Quadrelli E, Croteau J, et al. An assessment of gene-by-environment interactions in developmental dyslexia-related phenotypes. Genes Brain Behav. 2013; 12: 47–55. doi:10.1111/gbb.12000PMID:23176554
8. Poelmans G, Buitelaar JK, Pauls DL, Franke B. A theoretical molecular network for dyslexia: integrating available genetic findings. Mol Psychiatry. 2011; 16: 365–382. doi:10.1038/mp.2010.105PMID: 20956978
9. Wong SW, Chow BW, Ho CS, Waye MM, Bishop DV. Genetic and environmental overlap between Chi-nese and English reading-related skills in ChiChi-nese children. Dev Psychol. 2014; 50: 2539–2548. doi: 10.1037/a0037836PMID:25221842
10. Su M, Wang J, Maurer U, Zhang Y, Li J, McBride-Chang C, et al. Gene-environment interaction on neu-ral mechanisms of orthographic processing in Chinese children. J Neurolinguistics. 2015; 33: 172– 186. PMID:26294811
11. He Z, Shao S, Zhou J, Ke J, Kong R, Guo S, et al. Does long time spending on the electronic devices affect the reading abilities? A cross-sectional study among Chinese school-aged children. Res Dev Dis-abil. 2014; 35: 3645–3654. doi:10.1016/j.ridd.2014.08.037PMID:25247847
13. Raman I, Weekes BS. Acquired dyslexia in a Turkish-English speaker. Ann Dyslexia. 2005; 55: 79– 104. PMID:16107781
14. Li X. Survey of intermarriage in rural area of southern Xinjiang province. Xinjiang academy of social sci-ences. 2012; 59–66.
15. Zuo PX, Gu Q, Li ZC. Factors analysis of the developmental dyslexia in Uighur children. Chinese Jour-nal of Child Care. 2013; 21: 1254–1255,1265.
16. Statistic Bureau of Xinjiang Uyghur Autonomous. 2015; 4: 5. Available:http://www.xjtj.gov.cn/sjcx.
17. Jing J, Sen Y, Hai Y. The revision and evaluation of pupil rating scale revised screening for learning dis-ability. Chinese Journal of Child Care. 1998; 9: 197–200.
18. Wu HR, Song RR, Yao B. Preliminary establishment of dyslexia checklist for Chinese children scale. Journal of Human Genetics. 2006; 27: 189–190.
19. Gong YX, Cai TS. The test analysis of China-Wechesler young children scale of intelligence. Chinese Journal of Clinical Psychology. 1994; 1: 1–6.
20. Xi YL, Tian Q, Tuerxun T, Kaheman K, Jiang CH, Huang HX, et al. Comparison of functional magnetic resonance imaging in cerebral activation between normal Uygur and Mandarin participants in semantic identification task. Int J Clin Exp Med. 2015; 8:13724–13731. PMID:26550318
21. Siok WT, Niu Z, Jin Z, Perfetti CA, Tan LH. A structural-functional basis for dyslexia in the cortex of Chi-nese readers. P Natl Acad Sci USA. 2008; 105:5561–5566.
22. Chung KK, Ho CS. Second language learning difficulties in Chinese children with dyslexia: what are the reading-related cognitive skills that contribute to English and Chinese word reading? J Learn Disabil. 2010; 43:195–211. doi:10.1177/0022219409345018PMID:19897734
23. Xu S, Huang W, Qian J, Jin L. Analysis of genomic admixture in Uyghur and its implication in mapping strategy. Am J Hum Genet. 2008; 82:883–894. doi:10.1016/j.ajhg.2008.01.017PMID:18355773
24. Donfrancesco R, Iozzino R, Caruso B, Ferrante L, Mugnaini D, Talamo A, et al. Is season of birth related to developmental dyslexia? Ann Dyslexia. 2010; 60: 175–182. doi: 10.1007/s11881-010-0037-6PMID:20680528
25. Liederman J, Kantrowitz L, Flannery K. Male vulnerability to reading disability is not likely to be a myth: A call for new data. J Learn Disabil. 2005; 38: 109–129. PMID:15813594
26. Moll K, Kunze S, Neuhoff N, Bruder J, Schulte-Koerne G. Specific learning disorder: prevalence and gender differences. PloS One. 2014; 9: e103537. doi:10.1371/journal.pone.0103537PMID:25072465
27. Le Normand M-T, Parisse C, Cohen H. Lexical diversity and productivity in French preschooolers: developmental, gender and sociocultural factors. Clin Linguist Phon. 2008; 22: 47–58. PMID: 18092219
28. Shaywitz SE. Dyslexia. N Engl J Med. 1998; 338:307–312. PMID:9445412
29. Ollikainen M, Smith KR, Joo EJ, Ng HK, Andronikos R, Novakovic B, et al. DNA methylation analysis of multiple tissues from newborn twins reveals both genetic and intrauterine components to variation in the human neonatal epigenome. Hum Mol Genet. 2010; 19: 4176–4188. doi:10.1093/hmg/ddq336 PMID:20699328
30. Franceschini S, Gori S, Ruffino M, Pedrolli K, Facoetti A. A Causal link between visual spatial attention and reading acquisition. Curr Biol. 2012; 22: 814–819. doi:10.1016/j.cub.2012.03.013PMID: 22483940