Aberrant Functional Connectome in
Neurologically Asymptomatic Patients with
End-Stage Renal Disease
Xiaofen Ma1☯, Guihua Jiang2☯, Shumei Li2, Jinhui Wang3,4, Wenfeng Zhan2,
Shaoqing Zeng2, Junzhang Tian2*, Yikai Xu1*
1Department of Medical Imaging Center, Nanfang Hospital, Southern Medial University, Guangzhou, PR China,2Department of Medical Imaging, Guangdong No. 2 Provincial People’s Hospital, Guangzhou, PR China,3Center for Cognition and Brain Disorders, Hangzhou Normal University, Hangzhou, PR China,4 Zhejiang Key Laboratory for Research in Assessment of Cognitive Impairments, Hangzhou, PR China
☯These authors contributed equally to this work.
*[email protected](JZT); [email protected](YKX)
Abstract
Purpose
This study aimed to investigate the topological organization of intrinsic functional brain net-works in patients with end-stage renal disease (ESRD).
Materials and Methods
Resting-state functional MRI data were collected from 22 patients with ESRD (16 men, 18–
61 years) and 29age- and gender-matched healthy controls (HCs, 19 men, 32–61 years). Whole-brain functional networks were obtained by calculating the interregional correlation of low-frequency fluctuations in spontaneous brain activity among 1,024 parcels that cover the entire cerebrum. Weighted graph-based models were then employed to topologically characterize these networks at different global, modular and nodal levels.
Results
Compared to HCs, the patients exhibited significant disruption in parallel information pro-cessing over the whole networks (P<0.05). The disruption was present in all the functional
modules (default mode, executive control, sensorimotor and visual networks) although de-creased functional connectivity was observed only within the default mode network. Region-al anRegion-alysis showed that the disease disproportionately weakened nodRegion-al efficiency of the default mode components and tended to preferentially affect central or hub-like regions. In-triguingly, the network abnormalities correlated with biochemical hemoglobin and serum calcium levels in the patients. Finally, the functional changes were substantively unchanged after correcting for gray matter atrophy in the patients.
OPEN ACCESS
Citation:Ma X, Jiang G, Li S, Wang J, Zhan W, Zeng S, et al. (2015) Aberrant Functional Connectome in Neurologically Asymptomatic Patients with End-Stage Renal Disease. PLoS ONE 10(3): e0121085. doi:10.1371/journal.pone.0121085
Academic Editor:Satoru Hayasaka, Wake Forest School of Medicine, UNITED STATES
Received:October 2, 2014
Accepted:January 28, 2015
Published:March 18, 2015
Copyright:© 2015 Ma et al. This is an open access article distributed under the terms of theCreative Commons Attribution License, which permits unrestricted use, distribution, and reproduction in any medium, provided the original author and source are credited.
Data Availability Statement:All relevant data are within the paper.
Funding:This research was supported by grants from National Natural Science Foundation of China (No. 81471639) and The Science and Technology Planning Project of Guangdong Province, China (No. 2011B031800044, 2012B031800170,
2012A030400019). The funders had no role in study design, data collection and analysis, decision to publish, or preparation of the manuscript.
Conclusion
Our findings provide evidence for the disconnection nature of ESRD’s brain and therefore have important implications for understanding the neuropathologic substrate of the disease from disrupted network organization perspective.
Introduction
The human brain operates essentially as an interconnected network that underscores cognition and behavior [1,2]. Mapping and characterization of such a brain network are thus vital for our understanding of the brain and have attracted great attention in recent years [1,3]. To date, sev-eral non-trivial features are consistently revealed in healthy brain, such as small-worldness [4],
modularity [5] and hubs [6]. Moreover, accumulating evidence indicates that disturbances in
these configurations are largely responsible for cognitive and behavior dysfunction in various brain disorders [7,8], therefore hastening conceptual onset of pathoconnectomics [9], the map-ping of abnormal brain networks under pathological conditions.
End-stage renal disease (ESRD) is a disease characterized by multi-organ dysfunction. It typically occurs when chronic renal failure progresses to a point where the kidneys are
perma-nently functioning at less than 10% of their capacity [10]. ESRD is often accompanied by
cen-tral nervous system abnormalities [11] and neurological problems [12]. More importantly,
ESRD significantly elevates the risk of developing cognitive impairments [13–15] and leads to
an increased death rate [16–18]. Therefore, understanding brain abnormalities in
neurological-ly asymptomatic patients with ESRD is crucialneurological-ly important for the earneurological-ly diagnosis, prognosis improvement and ultimate, reduction of death rate.
Non-invasive neuroimaging techniques provide promising avenues to achieve these goals and have been increasingly applied to this disease. For example, diffusion tensor imaging and structural MRI studies have found that patients with ESRD exhibit abnormal white matter in-tegrity [19–21] and gray matter (GM) atrophy [22], respectively. Additionally, metabolic or functional disturbances are also reported in the disease by single photon emission tomography,
magnetic resonance spectroscopy and arterial spin-labeling (ASL) studies [22–24]. More
re-cently, resting-state functional magnetic resonance imaging (R-fMRI), a technique to measure spontaneous brain activity, is utilized to study intrinsic functional architecture in ESRD. With this technique, decreased regional homogeneity [25] and functional connectivity [26] are found in the default mode network (DMN) in ESRD patients compared to healthy controls (HC). These pioneering studies greatly promote our understanding of the disease. Neverthe-less, the neuropathologic substrate underlying the ESRD is far from well-established, particu-larly at the system-level from a whole-brain network perspective.
configurations of network organization in all the three levels, which significantly advance our understanding of network-level disturbances in ESRD.
Materials and Methods
Participants
This study was approved by the Research Ethics Review Board of the Institute of Mental Health at the Southern Medical University, and written informed consent was obtained from each par-ticipant. A total of 25 patients with ESRD (all right-handed) were recruited from the renal transplantation department at Guangdong No. 2 Provincial People's Hospital, Guangzhou, China in this study from August 2011 to July 2012. Exclusion criteria included: (1) psychiatric disorders or major neurologic disorders (e.g., severe head injury, stroke, epilepsy or visible le-sions); (2) ischemic diseases including acute ischemic cerebrovascular disease, acute peripheral arterial occlusion, advanced liver or heart failure; (3) asymptomatic coronary ischemia by elec-trocardiogram testing; (4) a history of diabetes; and (5) substance abuse including drugs, alco-hol and cigarettes. Conventional MR images were examined by an experienced radiologist (W. L., with 20 years of experience in neuropathology) who was blinded to whether the images were from the patient or control group. Three patients were excluded due to abnormal hyper-intensities in their T2-FLAIR MR images. Therefore, the final study population included 22
pa-tients with ESRD (16 males, 6 females; mean age 38 ± 10.5 years, range 18–61 years).
All the patients completed biochemical tests, which included serum creatinine, urea level, hemoglobin level, cholesterol level, serum albumin level, serum kalium and serum calcium within 24 hours before the MR imaging. In our study, none of the patients were on erythropoi-esis-stimulating agents and none of them were treated with vitamin D, calcitriol and/or phos-phorus-chelating agents. We did not check the serum PTH level for the ESRD patients. The
serum calcium levels were corrected with serum albumin levels using the Payne's formula [27].
The dialysis modality and duration (7.4 ± 2.2 months) were also recorded from the patients’
medical history. Out of the 22 patients with ESRD, twenty had hypertension, and six had hy-perlipidemia. In this study, all the patients underwent a neuropsychological test involving a
mini-mental state examination (MMSE) [28] and scored>= 28, which indicated their
relative-ly intact global neurocognition.
Twenty-nine age- and gender-matched HCs (all right handed; 19 males, 10 females; mean
age 42.1 ± 8.4years, range 28–61years) were recruited from the local community. All the HCs
had normal renal function as determined by no abnormal findings in the abdominal MR imag-ing and had no physical diseases or history of psychiatric or neurologic diseases. All the
demo-graphic and clinical data are summarized inTable 1.
Data Acquisition
All participants were scanned using a 1.5-T MR scanner (Achieva Nova-Dual; Philips, Best, the
Netherlands) at the Department of Medical Imaging, Guangdong No. 2 Provincial People’s
Hospital. The conventional imaging sequences, which included T1-weighted images and T2-FLAIR images, were obtained for each participant to detect clinically silent lesions. During the R-fMRI data acquisition, the participants were asked to lie quietly with their eyes closed and to not think of anything specific while in the scanner. The scan lasted 8 minutes, and 160 volumes were obtained for each participant. The R-fMRI acquisition parameters were as follows: 33 axial slices; repetition time (TR) = 3,000 ms; echo time (TE) = 50 ms; flip angle = 90°; slice
thickness = 4.5 mm; no gap; matrix = 128×128; and field of view (FOV) = 230×230 mm2. After
T1-weighted three-dimensional volumetric magnetization-prepared rapidly acquired gradient-echo sequence: 160 axial slices; TR = 25 ms; TE = 4.1 ms; FA = 30°; slice thickness = 1.0 mm;
no gap; matrix = 256×256; and FOV = 230×230 mm2.
Data Preprocessing
The data preprocessing was performed using the SPM8 package (http://www.fil.ion.ucl.ac. uk/
spm/software/spm8)and included the following: i) removal of the first five volumes to allow T1 equilibration; ii) realignment to correct for spatial displacements due to head motion; iii) spa-tial normalization into the Montreal Neurological Institute space; iv) removal of linear trend; v) temporal band-pass filtering (0.01–0.1 Hz); and vi) regression of several nuisance signals of white matter signal, cerebrospinal fluid signal and head-motion profiles.
Recent studies indicate that there still are residual head motion effects on intrinsic function-al connectivity and network topology even after typicfunction-al refunction-alignment and regression procedures [29,30]. To minimize the head motion effects in the current study, we first excluded partici-pants with excessive head motion (>1.5 mm or>1.5° in any direction). We then examined several summary measures of head motion profiles including the maximum, root mean square and mean frame-wise displacement and found no significant between-group differences (all
Ps>0.15). Furthermore, instead of six head-motion parameters, we used24 head-motion
pa-rameters in the regression model [31] as proposed by a recent study [32], which is an efficiency strategy to control for head motion effects. Finally, we treated all the summary head-motion
measures as covariates for the group-level comparisons [33]. With these strategies, we believe
that head-motion effects were mitigated as much as possible for the current data.
Individual-level correlation matrix
We constructed individual brain networks similarly to previous studies [34,35]. Briefly, the
ce-rebrum were first parceled into 1,024 equal-sized regions of interest (ROIs) [36]. This random
parcellation method ensures higher functional homogeneity within the ROIs compared with
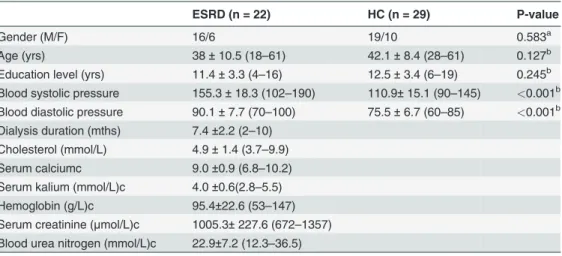
Table 1. Demographics and clinical characteristics of all participants.
ESRD (n = 22) HC (n = 29) P-value
Gender (M/F) 16/6 19/10 0.583a
Age (yrs) 38±10.5 (18–61) 42.1±8.4 (28–61) 0.127b
Education level (yrs) 11.4±3.3 (4–16) 12.5±3.4 (6–19) 0.245b
Blood systolic pressure 155.3±18.3 (102–190) 110.9±15.1 (90–145) <0.001b Blood diastolic pressure 90.1±7.7 (70–100) 75.5±6.7 (60–85) <0.001b Dialysis duration (mths) 7.4±2.2 (2–10)
Cholesterol (mmol/L) 4.9±1.4 (3.7–9.9)
Serum calciumc 9.0±0.9 (6.8–10.2)
Serum kalium (mmol/L)c 4.0±0.6(2.8–5.5) Hemoglobin (g/L)c 95.4±22.6 (53–147) Serum creatinine (μmol/L)c 1005.3±227.6 (672–1357)
Blood urea nitrogen (mmol/L)c 22.9±7.2 (12.3–36.5)
Values are represented as mean±SD (min—max). ESRD, end-stage renal disease; HC, healthy control.
aThe P-value was obtained by chi-square test.
bThe P-value was obtained by two-side two-sample t test. cData were missing for six patients.
anatomically defined atlases [37], and the spatial scale (i.e., 1,024 ROIs) is reasonable for an
ex-ploratory study of network properties [38]. Notably, the ROIs did not cover the cerebellum and
were restricted within a GM mask based on the probability map in SPM8 (threshold = 0.2). We then calculated the Pearson correlation coefficients of the mean regional time series between any pair of ROIs, which generated a 1,024×1,024 connectivity matrix for each participant. To further de-noise spurious interregional correlations, only those correlations whose correspond-ingP-values passed through a statistical threshold (P<0.05, Bonferroni-corrected over con-nections) were retained. Such a significance level-based thresholding procedure effectively
avoids erroneous evaluations of network topology [39]. Notably, negative correlations were
also excluded in this study due to their ambiguous interpretation [40–42] and detrimental ef-fects on test-retest reliability [43]. Finally, a sparse, positive and weighted network was ob-tained for each participant.
Group-level correlation matrix
All the individual sparse, positive and weighted correlation matrices of the control group were first converted to z-value matrices using a fisher r-to-z transformation to improve normality and then averaged across participants. The resultant z-value matrix was further inversely trans-formed to an r-value matrix, from which a backbone network was extracted to capture its
mul-tiscale structures using a nonparametric sparsification method [44]. The backbone network
was subsequently used to identify modular architecture that serves as a reference for between-group comparisons in intra- and inter-module connectivity and intra-module topological analyses.
Network Analysis
For the constructed brain networks, we calculated several graph-based metrics to characterize their topological organization from different levels: global small-world parameters (global effi-ciency and local effieffi-ciency), intermediate modular composition and local nodal effieffi-ciency. We
briefly explain these metrics below in the context of a weighted networkGwithNnodes andK
edges. Further details and interpretations of these network measures are described elsewhere [45].
Small-world parameters
Efficiency is a biologically relevant metric to describe brain networks from the perspective of parallel information flow [46,47] and can be calculated at both the global and local levels. Mathematically, the global efficiency is defined as:
EglobðGÞ ¼ 1
NðN 1Þ
P i6¼j2G
1
dij
ð1Þ
wheredijis the shortest path length between nodeiand nodejinGand is calculated as the
smallest sum of the edge lengths throughout all of the possible paths from nodeiand nodej.
The length of an edge was designated as the reciprocal of the edge weight (i.e., correlation
coef-ficient), which can be interpreted as a functional distance that a high correlation coefficient cor-responds to a short functional distance. Global efficiency measures the ability of parallel
information transmission over the network. The local efficiency ofGis measured as:
ElocðGÞ ¼ 1
N
P
i2GEglobðGiÞ ð2Þ
nodei(i.e., nodes linked directly to nodei). Local efficiency measures the fault tolerance of the network, indicating the capability of information exchange for each subgraph when the index node is eliminated.
To determine whether the constructed brain networks have a small-world organization, the local efficiency and global efficiency were normalized (i.e.,ẼlocandẼglob) by dividing them by the corresponding mean derived from 100 random networks that preserved the same number of nodes, edges and degree distributions as the real brain networks [48,49]. Typically, a network is said to be small-world if it has a normalized local efficiency larger than 1 and a normalized global efficiency approximately equal to 1 [50].
Modular composition
The modularityQ(p)for a given partitionpof a weighted network is defined as:
QðpÞ ¼PNM
s¼1 ws
W Ws
2W
2
" #
ð3Þ
whereNMis the number of modules,Wis the total weight of the network,wsis the sum of the
connectional weights between all the nodes in modulesandWsis the sum of the nodal strength
(see below for the definition of nodal strength) in modules. Modularity quantifies the differ-ence between the weight of the intra-module links of the actual network and those of random
networks in which connections are weighted randomly. The aim of the module identification
process is tofind a specific partitionpthat yields the largest network modularity. Here, we
de-tected modular structure using a spectral optimization algorithm [51].
Nodal efficiency
The nodal efficiency of a given nodeiis computed as [46]:
EnodalðiÞ ¼ 1
N 1
P j6¼i2G
1
dij ð4Þ
Nodal efficiency measures the information propagation ability of a node with the rest of the
nodes in the network. A node with a high nodal efficiency indicates high information
transmis-sion capability with other nodes and therefore can be categorized as a hub.
Statistical Analysis
Between-group differences in network/connectivity measures were inferred by nonparametric permutation tests. Briefly, for each metric, we initially calculated the between-group difference of the mean values. An empirical distribution of the difference was then obtained by randomly reallocating all of the values into two groups and recomputing the mean differences between the two randomized groups (10,000 permutations). The 95th percentile points of the empirical distribution were used as critical values in a one-tailed test of whether the observed group dif-ferences could occur by chance.
Brain Visualization
The brain results were visualized either in surface space using the BrainNet viewer [52] or in
volume space using MRIcron (http://www.mccauslandcenter.sc.edu/mricro/mricron/install.
html).
Results
Demographic and Clinical Characteristics
There were no significant differences in gender (P= 0.583), age (P= 0.127) or education level
(P= 0.245) between the ESRD and HC groups. Significantly lower blood systolic pressure and
diastolic pressure were observed in the patients compared with the HCs (bothPs<0.001).The
mean duration of hemodialysis for the patients was 7.4±2.2 months. The mean calcium, kalium, hemoglobin, creatinine, urea and cholesterol levels for the patients were 9.0±0.9, 4.03±
0.62 mmol/L, 95.4±22.6 g/L, 1005.3±227.6μmol/L 22.9±7.2 mmol/L and 4.9±1.4 mmol/L,
re-spectively (Table 1).
Global Network Organization
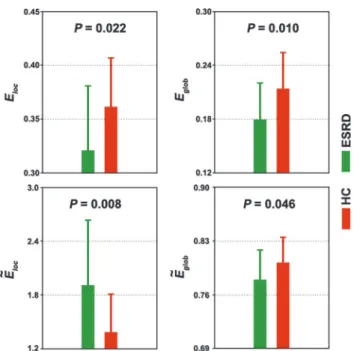
We constructed individual functional brain networks by calculating interregional functional connectivity among 1,024 ROIs. After applying a significance-based threshold, the number of survived connections and their associated weights showed no significant between-group differ-ences (allPs>0.05). A further graph-based network efficiency analysis revealed that all the networks obeyed small-world organizations characterized by larger local efficiency but
approx-imately equal global efficiency relative to matched random networks (HC:Ẽloc= 1.44 ± 0.47,
Ẽglob= 0.82 ± 0.03; ESRD:Ẽloc= 1.79 ± 0.79,Ẽglob= 0.80 ± 0.04). Nevertheless, statistical com-parisons revealed significant differences in the quantitative network measures between the two groups. Compared to the HC group, the ESRD patients showed significantly decreased local ef-ficiency (P= 0.022) and global efficiency (P= 0.010) in their functional brain networks (Fig. 1).
When normalized by random networks, local efficiency was increased (P= 0.008) and global
efficiency (P= 0.046) was decreased in the ESRD patients compared to the HCs (Fig. 1).
Modular Brain Organization
Four functional modules were identified in the mean network of the HC group (Q= 0.531,
P<10−3) including the DMN (317 ROIs), executive control network (ECN, 250 ROIs),
sensori-motor network (SMN, 289 ROIs) and visual network (VN, 168 ROIs) (Fig. 2A). Under the
framework of this modular architecture, we contrasted the intra- and inter-module connectivi-ty strength between the ESRD patients and the HCs. Compared with the HC group, the pa-tients with ESRD showed significantly (P<0.05, False Discovery Rate corrected) decreased
functional connectivity within the DMN (Fig. 2). There were no connectivity differences within
other modules or between any pair of modules.
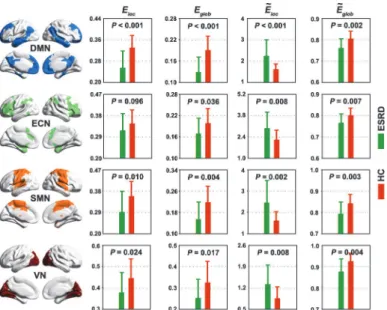
We further studied the topological architecture of each module. The results showed that all four modules exhibited significantly different topological organizations between the ESRD and the HC groups in highly similar patterns to those observed for the whole-brain network (Fig. 3).
Regional Network Organization
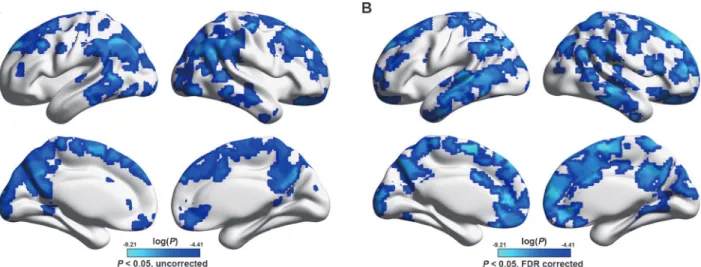
Rate corrected) decreased nodal efficiency in the patients compared to the HCs (Fig. 4B). These regions enclosed predominately the lateral and medial prefrontal cortex, motor cortex, anterior and middle cingulate gyri, precuneus, angular gurus, superior parietal lobule, lateral temporal lobe and occipital regions, bilaterally. When superimposed on the modular
architec-ture (Fig. 2A), the 221 ROIs were mainly located in the DMN (109/221, 49.3%), followed by
the SMN (56/221, 25.3%), ECN (36/221, 16.3%) and VN (20/221, 9.1%). Given the different sizes among modules, we further performed a statistical test to determine whether such a non-uniform distribution occurs by chance. We randomly selected 221 ROIs from the 1,024 ROIs and recorded their distribution over the four modules. This procedure was implemented 10,000 times to generate empirical distributions of frequency. Intriguingly, we found that the
ESRD-related ROIs were susceptible to specific modules of the DMN (P<0.001,Fig. 4C).
To further test whether the ESRD affects brain regions differentially, we divided the 1,024 ROIs into 8 equally spaced bins between the minimum and maximum values of nodal efficien-cy for each participant such that the first bin contained regions with low nodal efficienefficien-cy (i.e.,
Fig 2. Between-group differences in intra- and inter-module connectivity.A, four modules were identified in group-level functional network of healthy controls, including default mode network (DMN), executive control network (ECN), sensorimotor network (SMN) and visual network (VN). B, patients with ESRD only showed decreased functional connectivity within the DMN. Node size and line width are in proportion to mean intra- and inter-module connectivity strength, respectively. ESRD, end-stage renal disease; HC, healthy control.
doi:10.1371/journal.pone.0121085.g002
Fig 1. Between-group differences in whole-brain topology.Error bars denote standard deviations. ESRD, end-stage renal disease; HC, healthy control;Eloc, local efficiency;Eglob, global efficiency;Ẽloc, normalized local efficiency;Ẽglob, normalized global efficiency.
Fig 3. Between-group differences in module-level topology.Each functional module exhibited altered network organization in patients with ESRD compared to HCs in extremely similar patterns to those observed for the whole-brain networks (Fig. 1). Error bars denote standard deviations. ESRD, end-stage renal disease; HC, healthy control;Eloc, local efficiency;Eglob, global efficiency;Ẽloc, normalized local efficiency;Ẽglob, normalized global efficiency; DMN, default mode network; ECN, executive control network; SMN, sensorimotor network; VN, visual network.
doi:10.1371/journal.pone.0121085.g003
Fig 4. Between-group differences in regional nodal efficiency.A, histogram of mean nodal efficiency showed an evident shift towards overall decrease in patients with ESRD compared to HCs. B, statistical analysis revealed that the global decrease was driven by numerous regions that predominantly located in lateral and medial prefrontal cortex, motor cortex, posterior parietal cortex, lateral temporal lobe and occipital regions. C, empirical frequency distributions of 221 randomly selected ROIs (10,000 times) in each of the four modules inFig. 2A. ESRD, end-stage renal disease; HC, healthy control; ROIs, regions of interest; DMN, default mode network; ECN, executive control network; SMN, sensorimotor network; VN, visual network.
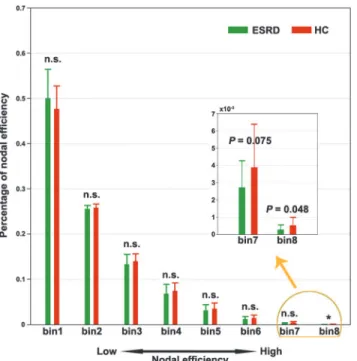
peripheral regions) and the eighth bin included regions with high nodal efficiency (i.e., central or hub regions). We then compared the percentage of regions that fell into each bin between the two groups. Here, the number of bins is chosen according to the following considerations: 1) 1,024 is divisible by the number of bins; 2) the number of bins should be small enough to avoid a severe multiple comparison issue; and 3) the number of bins should be large enough to group nodes into multiple sets with different nodal efficiency. Based on these criteria, we em-pirically set the number of bins to 8.The results revealed that the ESRD patients exhibited a sig-nificantly decreased percentage in the seventh and eighth bins (Fig. 5), which indicated a preferential susceptibility to hub regions in the disease.
Relationship between Brain Network Measures and Clinical Variables
Significant correlations were observed between the small-world parameters of whole-brain net-works and the clinical variables in the patients. Specifically, both local efficiency and global
effi-ciency positively correlated with the hemoglobin level (Fig. 6A). For modules, only the SMN
module exhibited significantly positive correlations with the hemoglobin level in the local effi-ciency and global effieffi-ciency and negative correlation with the hemoglobin level in the normal-ized local efficiency. No correlations were observed for the other three modules (Table 2). Additionally, significantly positive correlations (P<0.05, False Discovery Rate corrected) were observed for the nodal efficiency of the right medial superior frontal gyrus with the hemoglobin level (r = 0.965,P= 0.0001) (Fig. 6B).
Fig 5. Preferential susceptibility of ESRD to hub-like regions.All the 1,024 regions were equally divided into eight bins (128 nodes in each bin) in terms of their nodal strength for each participant. The percentage of regions falling in each bin was compared and only the seventh and eighth bins (corresponding to large nodal efficiency) were observed to show ESRD-related decreases compared to HCs. n.s., non-significant; ESRD, end-stage renal disease; HC, healthy control.
GM Volume
A voxel-based morphometry analysis revealed that multiple cortical and subcortical regions
ex-hibited GM atrophy in the patients compared to the HCs (P<0.05, corrected), which included
Fig 6. Relationship between network measures and biochemical parameters.Significant correlations were observed for both global network
organization and regional nodal efficiency with biochemical parameters in ESRD patients. SMA, supplemental motor area; SFGmed, medial superior frontal gyrus; R, right; ESRD, end-stage renal disease; HC, healthy control.
doi:10.1371/journal.pone.0121085.g006
Table 2. Partial correlation coefficients between network metrics and biochemical parameters.
Network efficiency of whole-brain network
Biochemical parameters Eloc Eglob Ẽloc Ẽglob
Hemoglobinlevel 0.821 0.804 -0.631 0.144
Network efficiency of DMN module
Biochemical parameters Eloc Eglob Ẽloc Ẽglob
Hemoglobinlevel 0.638 0.627 -0.524 0.269
Network efficiency of ECN module
Biochemical parameters Eloc Eglob Ẽloc Ẽglob
Hemoglobinlevel 0.629 0.667 -0.515 0.271
Network efficiency of SMN module
Biochemical parameters Eloc Eglob Ẽloc Ẽglob
Hemoglobinlevel 0.868 0.820 -0.604 0.426
Network efficiency of VN module
Biochemical parameters Eloc Eglob Ẽloc Ẽglob
Hemoglobinlevel 0.687 0.618 -0.504 0.398
The partial correlations were computed with age, gender and summary measures of head motion as the confounding covariates. Values in bold indicate significant correlations (P<0.05). No significant correlations were observed for dialysis duration, kalium level, creatinine level and urea level.
Eloc, local efficiency. DMN, default mode network. ECN, executive control network. SMN, sensorimotor network. VN, visual network.
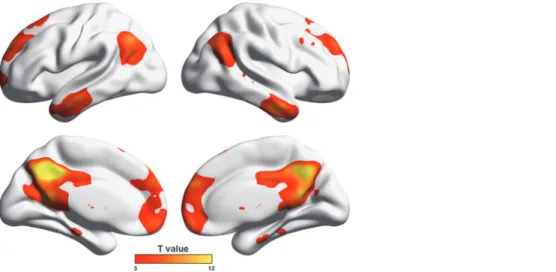
the bilateral medial prefrontal gyrus, anterior cingulate gyrus, superior temporal gyrus, middle temporal gyrus, lingual gyrus, parahippocampa gyrus, putamen, caudate, insula and right mid-dle cingulate gyrus (Fig. 7). There were no significant correlations between functional nodal
ef-ficiency and structural mean GM volume for any ROI (P>0.05, False Discovery Rate
corrected).
Reproducibility analyses
Frist, the current dataset were obtained using a relative low field strength (1.5 T), long TR (3s) and high in-plane resolution (128×128). These may lead to a low SNR for detecting resting-state networks. So we performed a seed-based functional connectivity analysis (seed = the left posterior cingulate cortex, MNI coordinate = [-5 -52 41]) to test whether our data could
repro-duce the putative default mode network. As shown in theFig. 8, the mapped connectivity
pat-tern from our data was highly comparable with numerous previous studies (e.g., [53]). Second,
the global signal removal is a controversial preprocessing step for resting-state fMRI studies
[54–59]. Thus, we re-constructed individual functional brain networks based on the data that
underwent global signal removal. Subsequent network analyses showed that the between-group differences became non-significant for global whole-brain network properties (i.e., local and global efficiency and their corresponding normalized versions). As for nodal efficiency,
Fig 7. Between-group differences in gray matter volume.Multiple cortical and subcortical regions were identified to show gray matter atrophy in ESRD patients compared to HCs. Of note, no significant correlations were observed between nodal efficiency decreases and GM gray matter atrophy in the patients (P>0.05, False Discovery Rate corrected). GM, gray matter; ESRD, end-stage renal disease.
doi:10.1371/journal.pone.0121085.g007
Fig 8. PCC-based functional connectivity.
although an overall similar pattern of decreased nodal efficiency was observed in patients with ESRD (Fig. 9A, dice coefficient = 0.45 with those reported inFig. 4B), the decreases were non-significant after multiple comparison correction. Third, we found that one patient had a very low hemoglobin value (53 g/L), suggesting severe anemia. Therefore, we reanalyzed our data after excluding this patient to test the extent to which our main findings were affected. We
found that the results were largely preserved for both whole-brain topology (P= 0.022 for local
efficiency;P= 0.011 for global efficiency;P= 0.009 for normalized local efficiency;P= 0.047 for normalized global efficiency) and local nodal efficiency (Fig. 9B, dice coefficient = 0.93 with those reported inFig. 4B).
Discussion
This study examined the topological organization of functional brain networks in patients with ESRD by combining R-fMRI and graph-based approaches. The results revealed that ESRD pa-tients had abnormally organized brain networks that were manifested at multiple levels of
net-work configurations. Moreover, the altered netnet-work architecture was related to the patients’
biochemical indicators. These findings provide direct evidence for network disorganization in ESRD.
The human brain is a complex, interconnected network that continuously integrates infor-mation across multiple sensory systems. Numerous studies suggest that the powerful perfor-mance of the brain originates from nontrivial small-world organization that confers a
capability for both modularprocessing in local neighborhoods (i.e., functional segregation) and integrated processing over distributed brain regions (i.e., functional integration) [1,60,61].
Using computation simulation approaches, Sporns et al. [62] found that small-world topology
emerges when networks are evolved into an optimal balance between local specialization and global integration. Here, we also found small-world organizations of functional brain networks in the both groups, consistent with these empirical and computational studies.
Nevertheless, the small-world parameters were quantitatively altered in the patients as char-acterized by decreased local and global efficiency compared to HCs. Local efficiency is predom-inantly associated with short-range connections between nearby regions and reflects modular information processing or fault-tolerance of a network [47]. Global efficiency is mainly
Fig 9. Decreased nodal efficiency in the patients when the global signals were removed (A) or when one patient with the lowest hemoglobin value was excluded (B).
associated with long-range connections and reflects integrative information processing be-tween and across remote regions of the brain that constitutes the basis of cognitive processing
[63]. The observed decreases thus suggest impaired functional segregation and integration in
the disease, which presumably are due to disrupted interregional coordination both among local neighbors and across distant regions. This was supported by the finding of decreased nodal efficiency in numerous regions caused by ESRD. When normalized by random networks, local efficiency was increased while global efficiency was decreased in the ESRD patients com-pared to HCs. This combination jointly suggests a shift towards regular configurations in
ESRD’s brain that favor higher modular processing but lower global coordination compared to
the small-world organization. Since the small-world model reflects an optimal balance between local specialization and global integration, these results indicate a disruption in the normal bal-ance of functional brain networks of ESRD. It should be noted that these abnormalities were sensitive to the global signal removal, indicating that the findings should be interpreted with caution.
We further examined the small-world parameters of each functional module motived by the
fact that different modules possess unique organizations [64,65]. Four modules were identified
in the HC group, largely consistent with those in a previous study [66]. In the modular
frame-work, all the modules were aberrantly organized in ESRD in a similar manner to that of whole-brain networks. These findings indicate that as a general change in ESRD, disrupted balances between local specialization and global integration are involved in all functional systems. This is consistent with previous findings that ESRD is associated with diffused gray matter atrophy [67] and white matter damage [19,20] over the cerebral mantle. Before any overt neurological manifestation, patients with ESRD are often accompanied with various cognitive deficits, such as attention, processing speed [68], executive function [13], motor function [69] and memory [70]. We speculate that the generality of cognitive disturbances in ESRD may (at least partly) be attributable to widespread disruptions in network organization. Notably, the patients in this
study were cognitively intact globally (MMSE>= 28). Therefore, altered network organization
may be an early predictive sign of cognitive dysfunction in the disease. Future studies are re-quired to determine the dynamic reconfiguration of network organization with the progress of the disease.
We found positive correlations between decreased efficiency and hemoglobin levels in pa-tients with ESRD. ESRD papa-tients usually have normocytic anemia and other complications of malnutrition and/or protein-energy wasting with different pathophysiology. Previous studies have shown that chronic malnutrition can result in insufficient nutrient supply to the brain that subsequently triggers a series of problems, including brain tissue hypoxia and blood
vis-cosity reduction and eventual hypoperfusion and/or hypometabolism [71,72].There is also
in-creasing evidence supporting that a long-term hemodialysis could lead to remarkable cerebral abnormalities of oxygenation [73] and cerebral blood flow [74–76] in ESRD, which can signifi-cantly affect the cerebral circulation and brain function [77–80]. In addition, vascular dementia
is reported much more common in ESRD [73,81]. These studies suggest a significant effect of
indicating unique contributions of this network to the observed global brain-biochemistry correlations.
We found decreased intra-module functional connectivity for the DMN in the ESRD pa-tients. Previous studies have suggested that the DMN components are structurally connected [84,85] and show coherent brain activity in both humans [53,86] and non-human animals [87,
88]. Thus, the decrease indicates a weaker coherence or coordination of spontaneous brain
ac-tivity in the DMN in ESRD. This is consistent with previous reports using regional
homogenei-ty [25] and independent component analysis [26] methods. These studies collectively suggest
that decoupling within the DMN is a robust change in ESRD against different analytic approaches.
At nodal level, numerous regions showed decreased nodal efficiency in the ESRD patients,
comparable with those showing hypoperfusion [89] or hypometabolism [90] in patients with
chronic kidney disease. Intriguingly, we observed that ESRD disproportionately affected the DMN components and preferentially targeted hub regions. This is consistent with the current
consensus that hubs are predominantly located in the DMN [91–93]. The DMN is engaged in
a wide spectrum of cognitive processing [94] and has high metabolism and oscillation power of
spontaneous neural activity [95,96]. The functional diversity and high-level activity of the DMN inevitably require a high energy intake. However, as we discussed above, patients with ESRD typically suffer from insufficient energy metabolism in their brain, which may disrupt
interregional connectivity [66]. Given the high connectivity of the DMN components, it is
rea-sonable to observe the most salient disruptions in these regions. This was further supported by the positive correlation between nodal efficiency of the medial superior frontal gyrus (a key node in the DMN) and hemoglobin levels in the patients. Additionally, we also found wide-spread gray matter atrophy in the patients with ESRD, which is consistent with a previous
mor-phological study in ESRD [67]. Furthermore, no correlations were detected between gray
matter atrophy and nodal efficiency decreases in the patients, suggesting the independence of functional abnormalities from morphological changes. As for structure-function relationship, we found no significant correlations between nodal efficiency and regional gray matter volume, suggesting that functional network abnormalities were largely independent of morphological alterations. Previous studies have shown that regional gray matter morphology is related to local functional organization (e.g., regional functional homogeneity and amplitude of low fre-quency fluctuation) under both healthy and pathological conditions [97,98], implying a tight coupling between regional brain morphology and local functional architecture. However, in the current study we did not detect significant correlations between regional gray matter vol-ume and nodal efficiency. Presumably, this may be because that instead of quantifying local functional architecture, nodal efficiency reflects the efficiency of interregional information pro-cessing for a given region with all the other regions in the brain. Therefore, the lack of signifi-cant correlations between regional gray matter volume and nodal efficiency sounds plausible because there is limited evidence for the effects of regional brain morphology on how a region interacts with all the other regions in the brain. Nevertheless, it should be noted that the struc-ture-function relationship is an ongoing filed [99] and is still not fully understood, especially at local brain organization. Future studies are warranted to provide more insights into this issue.
Limitation
optimized parameters. Second, there are numerous alternative methodologies used during complex brain network studies, such as brain parcellation schemes [37,100], functional con-nectivity measures [101,102], thresholding procedures [39,103] and null models [104–106]. How these factors affect the current findings should be tested in the future. Third, due to the cross-sectional design of the current study, we cannot address how functional brain networks adaptively reorganize in response to the progress of ESRD. Future longitudinal studies would provide insights into this issue. Fourth, consist with a recent R-fMRI study [26], several comor-bidities associated with ESRD (e.g., anemia, hypertension and hyperlipidemia) existed for the patients in the current study. Therefore, it is likely that the observed network abnormalities are a common consequence of both ESRD and these comorbidities. Future studies are needed to help clarify this issue by recruiting more homogeneous and purer samples. Finally, accumulat-ing evidence suggests that functional brain networks are largely shaped by underlyaccumulat-ing
structur-al pathways [107,108]. Although a recent diffusion tensor imaging study demonstrated
abnormalities in several specific neural tracts in neurologically asymptomatic patients with
ESRD [21], whole-brain structural networks still remain to be elucidated in ESRD to examine
whether the functional brain network changes observed here have a structural substrate.
Conclusion
The current study demonstrates the disconnectivity nature of ESRD’s brain that is evident in
global network organization, intra-module functional integration and regional nodal efficiency. Moreover, the disconnectivity is related to biochemical parameters in the patients. These find-ings provide novel insights in understanding ESRD from large-scale network perspective.
Acknowledgments
We thank all the patients and volunteers for participating in this study. Also, the authors are highly grateful to the anonymous reviewers for their significant and constructive comments and suggestions, which greatly improve the article.
Author Contributions
Conceived and designed the experiments: XFM GHJ JZT YKX. Performed the experiments: XFM GHJ SML WFZ SQZ. Analyzed the data: XFM JHW. Contributed reagents/materials/ analysis tools: XFM JHW. Wrote the paper: XFM.
References
1. Bullmore E, Sporns O. Complex brain networks: graph theoretical analysis of structural and functional systems. Nat Rev Neurosci. 2009; 10(3):186–98. doi:10.1038/nrn2575PMID:19190637
2. Park HJ, Friston K. Structural and functional brain networks: from connections to cognition. Science. 2013; 342(6158):1238411. doi:10.1126/science.1238411PMID:24179229
3. Xia M, He Y. Magnetic resonance imaging and graph theoretical analysis of complex brain networks in neuropsychiatric disorders. Brain Connect. 2011; 1(5):349–65. doi:10.1089/brain.2011.0062
PMID:22432450
4. Bassett DS, Bullmore E. Small-world brain networks. Neuroscientist. 2006; 12(6):512–23. PMID:
17079517
5. Meunier D, Lambiotte R, Bullmore ET. Modular and hierarchically modular organization of brain net-works. Front Neurosci. 2010; Dec 8, 4:200. doi:10.3389/fnins.2010.00200PMID:21151783
6. van den Heuvel MP, Sporns O. Network hubs in the human brain. Trends Cogn Sci. 2013; 17 (12):683–96. doi:10.1016/j.tics.2013.09.012PMID:24231140
8. He Y, Chen Z, Gong G, Evans A. Neuronal networks in Alzheimer's disease. Neuroscientist. 2009a; 15(4):333–50. doi:10.1177/1073858409334423PMID:19458383
9. Rubinov M, Bullmore E. Fledgling pathoconnectomics of psychiatric disorders. Trends Cogn Sci. 2013; 17(12):641–7. doi:10.1016/j.tics.2013.10.007PMID:24238779
10. Foley RN, Collins AJ. End-stage renal disease in the United States: an update from the United States Renal Data System. J Am Soc Nephrol. 2007; 18(10):2644–8. PMID:17656472
11. De Deyn PP, Saxena VK, Abts H, Borggreve F, D'Hooge R, Marescau B, et al. Clinical and patho-physiological aspects of neurological complications in renal failure. Acta Neurol Belg. 1992; 92 (4):191–206. PMID:1332359
12. Brouns R, De Deyn PP. Neurological complications in renal failure: a review. Clin Neurol Neurosurg. 2004; 107(1):1–16. PMID:15567546
13. Kurella M, Chertow GM, Luan J, Yaffe K. Cognitive impairment in chronic kidney disease. J Am Ger-iatr Soc. 2004; 52(11):1863–9. PMID:15507063
14. Kurella Tamura M, Yaffe K. Dementia and cognitive impairment in ESRD: diagnostic and therapeutic strategies. Kidney Int. 2011; 79(1):14–22. doi:10.1038/ki.2010.336PMID:20861818
15. Murray AM, Pederson SL, Tupper DE, Hochhalter AK, Miller WA, Li Q, et al. Acute variation in cogni-tive function in hemodialysis patients: a cohort study with repeated measures. Am J Kidney Dis. 2007; 50(2):270–8. PMID:17660028
16. Altmann P, Barnett ME, Finn WF. Cognitive function in Stage 5 chronic kidney disease patients on he-modialysis: no adverse effects of lanthanum carbonate compared with standard phosphate-binder therapy. Kidney Int. 2007; 71(3):252–9. PMID:17035945
17. Madero M, Gul A, Sarnak MJ. Cognitive function in chronic kidney disease. Semin Dial. 2008; 21 (1):29–37. doi:10.1111/j.1525-139X.2007.00384.xPMID:18251955
18. Raphael KL, Wei G, Greene T, Baird BC, Beddhu S. Cognitive function and the risk of death in chronic kidney disease. Am J Nephrol. 2012; 35(1):49–57. doi:10.1159/000334872PMID:22189005
19. Chou MC, Hsieh TJ, Lin YL, Hsieh YT, Li WZ, Chang JM, et al. Widespread white matter alterations in patients with end-stage renal disease: a voxel wise diffusion tensor imaging study. Am J Neuroradiol. 2013; 34(10):1945–51. doi:10.3174/ajnr.A3511PMID:23788598
20. Hsieh TJ, Chang JM, Chuang HY, Ko CH, Hsieh ML, Liu GC, et al. End-stage renal disease: in vivo diffusion-tensor imaging of silent white matter damage. Radiology. 2009; 252(2):518–25. doi:10. 1148/radiol.2523080484PMID:19528357
21. Kim HS, Park JW, Bai DS, Jeong JY, Hong JH, Son SM, et al. Diffusion tensor imaging findings in neu-rologically asymptomatic patients with end stage renal disease. NeuroRehabilitation. 2011; 29 (1):111–6. doi:10.3233/NRE-2011-0684PMID:21876303
22. Prohovnik I, Post J, Uribarri J, Lee H, Sandu O, Langhoff E. Cerebrovascular effects of hemodialysis in chronic kidney disease. J Cereb Blood Flow Metab. 2007; 27(11):1861–9. PMID:17406658
23. Fazekas G, Fazekas F, Schmidt R, Flooh E, Valetitsch H, Kapeller P, et al. Pattern of cerebral blood flow and cognition in patients undergoing chronic haemodialysis treatment. Nucl Med Commun. 1996; 17(7):603–8. PMID:8843120
24. Tryc AB, Alwan G, Bokemeyer M, Goldbecker A, Hecker H, Haubitz M, et al. Cerebral metabolic alter-ations and cognitive dysfunction in chronic kidney disease. Nephrol Dial Transplant 2011; 26 (8):2635–41. doi:10.1093/ndt/gfq729PMID:21216887
25. Liang X, Wen J, Ni L, Zhong J, Qi R, Zhang LJ, et al. Altered pattern of spontaneous brain activity in the patients with end-stage renal disease: a resting-state functional MRI study with regional homoge-neity analysis. PLOS One. 2013a; 8(8):e71507. doi:10.1371/journal.pone.0071507PMID:23990958
26. Ni L, Wen J, Zhang LJ, Zhu T, Qi R, Liang X, et al. Aberrant default-mode functional connectivity in pa-tients with end-stage renal disease: a resting-state functional MR imaging study. Radiology. 2014; 271(2):543–52. doi:10.1148/radiol.13130816PMID:24484062
27. Payne RB, Little AJ, Williams RB, Milner JR. Interpretation of serum calcium in patients with abnormal serum proteins. Br Med J. 1973; Dec, 4(5893):643–6. PMID:4758544
28. Schultz-Larsen K, Lomholt RK, Kreiner S. Mini-Mental Status Examination: a short form of MMSE was as accurate as the original MMSE in predicting dementia. J Clin Epidemiol. 2007; 60(3):260–7. PMID:
17292020
30. Van Dijk KR, Sabuncu MR, Buckner RL. The influence of head motion on intrinsic functional connec-tivity MRI. Neuroimage. 2012; 59(1):431–8. doi:10.1016/j.neuroimage.2011.07.044PMID:
21810475
31. Friston KJ, Williams S, Howard R, Frackowiak RS, Turner R. Movement-related effects in fMRI time-series. Magn Reson Med. 1996; 35(3):346–55. PMID:8699946
32. Yan CG, Craddock RC, He Y, Milham MP. Addressing head motion dependencies for small-world to-pologies in functional connectomics. Front Hum Neurosci. 2013; 7:910. doi:10.3389/fnhum.2013. 00910PMID:24421764
33. Damien A. Fair JTN, Iyer Swathi, Bathula Deepti, Mills Kathryn L, Dosenbach Nico U. F., Dosenbach NU, et al. Distinct neural signatures detected for ADHD subtypes after controlling for micro-move-ments in resting state functional connectivity MRI data. Front Syst Neurosci. 2012; 6(80):1–31. doi:
10.3389/fnsys.2012.00080PMID:23382713
34. Bassett DS, Wymbs NF, Porter MA, Mucha PJ, Carlson JM, Grafton ST. Dynamic reconfiguration of human brain networks during learning. Proc Natl Acad Sci USA. 2011; 108(18):7641–6. doi:10.1073/ pnas.1018985108PMID:21502525
35. Wang J, Zuo X, Dai Z, Xia M, Zhao Z, Zhao X, et al. Disrupted functional brain connectome in individu-als at risk for Alzheimer's disease. Biol Psychiatry. 2013; 73(5):472–81. doi:10.1016/j.biopsych. 2012.03.026PMID:22537793
36. Zalesky A, Fornito A, Harding IH, Cocchi L, Yucel M, Pantelis C, et al. Whole-brain anatomical net-works: does the choice of nodes matter? Neuroimage. 2010; 50(3):970–83. doi:10.1016/j. neuroimage.2009.12.027PMID:20035887
37. Craddock RC, James GA, Holtzheimer PE 3rd, Hu XP, Mayberg HS. A whole brain fMRI atlas gener-ated via spatially constrained spectral clustering. Hum Brain Mapp. 2012; 33 (8):1914–28. doi:10. 1002/hbm.21333PMID:21769991
38. Fornito A, Zalesky A, Bullmore ET. Network scaling effects in graph analytic studies of human resting-state FMRI data. Front Syst Neurosci. 2010; Jun 17, 4:22. doi:10.3389/fnsys.2010.00022PMID:
20592949
39. Toppi J, De Vico Fallani F, Vecchiato G, Maglione AG, Cincotti F, Mattia D, et al. How the statistical validation of functional connectivity patterns can prevent erroneous definition of small-world properties of a brain connectivity network. Comput Math Methods Med. 2012; 2012:130985. doi:10.1155/2012/ 130985PMID:22919427
40. Fox MD, Zhang D, Snyder AZ, Raichle ME. The global signal and observed anticorrelated resting state brain networks. J Neurophysiol. 2009; 101(6):3270–83. doi:10.1152/jn.90777.2008PMID:
19339462
41. Murphy K, Birn RM, Handwerker DA, Jones TB, Bandettini PA. The impact of global signal regression on resting state correlations: are anti-correlated networks introduced? Neuroimage. 2009; 44(3):893– 905. doi:10.1016/j.neuroimage.2008.09.036PMID:18976716
42. Weissenbacher A, Kasess C, Gerstl F, Lanzenberger R, Moser E, Windischberger C. Correlations and anticorrelations in resting-state functional connectivity MRI: a quantitative comparison of prepro-cessing strategies. Neuroimage. 2009; 47(4):1408–16. doi:10.1016/j.neuroimage.2009.05.005
PMID:19442749
43. Wang JH, Zuo XN, Gohel S, Milham MP, Biswal BB, He Y. Graph theoretical analysis of functional brain networks: test-retest evaluation on short- and long-term resting-state functional MRI data. PLOS One. 2011; 6(7):e21976. doi:10.1371/journal.pone.0021976PMID:21818285
44. Foti NJ, Hughes JM, Rockmore DN. Nonparametric sparsification of complex multiscale networks. PLOS One. 2011; 6(2):e16431. doi:10.1371/journal.pone.0016431PMID:21346815
45. Rubinov M, Sporns O. Complex network measures of brain connectivity: uses and interpretations. Neuroimage. 2010; 52(3):1059–69. doi:10.1016/j.neuroimage.2009.10.003PMID:19819337
46. Achard S, Bullmore E. Efficiency and cost of economical brain functional networks. PLOS Comput Biol. 2007; 3(2):e17. PMID:17274684
47. Latora V, Marchiori M. Efficient behavior of small-world networks. Phys Rev Lett. 2001; 87 (19):198701. PMID:11690461
48. Maslov S, Sneppen K. Specificity and stability in topology of protein networks. Science. 2002; 296 (5569):910–3. PMID:11988575
49. Milo R, Shen-Orr S, Itzkovitz S, Kashtan N, Chklovskii D, Alon U. Network motifs: simple building blocks of complex networks. Science. 2002; 298(5594):824–7. PMID:12399590
51. Newman ME. Finding community structure in networks using the eigenvectors of matrices. Phys Rev E Stat Nonlin Soft Matter Phys. 2006; 74(3Pt 2):036104. PMID:17025705
52. Xia M, Wang J, He Y. BrainNet Viewer: a network visualization tool for human brain connectomics. PLOS One. 2013; 8(7):e68910. doi:10.1371/journal.pone.0068910PMID:23861951
53. Fox MD, Snyder AZ, Vincent JL, Corbetta M, Van Essen DC, Raichle ME. The human brain is intrinsi-cally organized into dynamic, anticorrelated functional networks. Proc Natl Acad Sci USA. 2005; 102: 9673–9678. PMID:15976020
54. Birn RM, Diamond JB, Smith MA, Bandettini PA. Separating respiratory-variation-related fluctuations from neuronal-activity-related fluctuations in fMRI. Neuroimage. 2006; 31:1536–1548. PMID:
16632379
55. Chang C, Glover GH. Effects of model-based physiological noise correction on default mode network anti-correlations and correlations. Neuroimage. 2009; 47:1448–1459. doi:10.1016/j.neuroimage. 2009.05.012PMID:19446646
56. Fox MD, Zhang D, Snyder AZ, Raichle ME. The global signal and observed anticorrelated resting state brain networks. J Neurophysiol. 2009; 101:3270–3283. doi:10.1152/jn.90777.2008PMID:
19339462
57. Murphy K, Birn RM, Handwerker DA, Jones TB, Bandettini PA. The impact of global signal regression on resting state correlations: are anti-correlated networks introduced? Neuroimage. 2009; 44:893– 905. doi:10.1016/j.neuroimage.2008.09.036PMID:18976716
58. Schwarz AJ, McGonigle J. Negative edges and soft thresholding in complex network analysis of rest-ing state functional connectivity data. NeuroImage. 2011; 55(3):1132–1146. doi:10.1016/j. neuroimage.2010.12.047PMID:21194570
59. Weissenbacher A, Kasess C, Gerstl F, Lanzenberger R, Moser E, Windischberger C. Correlations and anticorrelations in resting-state functional connectivity MRI: a quantitative comparison of prepro-cessing strategies. Neuroimage. 2009; 47:1408–1416. doi:10.1016/j.neuroimage.2009.05.005
PMID:19442749
60. He Y, Evans A. Graph theoretical modeling of brain connectivity. Curr Opin Neurol. 2010; 23(4):341– 50. doi:10.1097/WCO.0b013e32833aa567PMID:20581686
61. Wang J, Zuo X, He Y. Graph-based network analysis of resting-state functional MRI. Front Syst Neu-rosci. 2010; Jun 7, 4:16. doi:10.3389/fnsys.2010.00016PMID:20589099
62. Sporns O, Tononi G, Edelman GM. Theoretical neuroanatomy: relating anatomical and functional connectivity in graphs and cortical connection matrices. Cereb Cortex. 2000, 10(2):127–41. PMID:
10667981
63. Sporns O, Zwi JD. The small world of the cerebral cortex. Neuroinformatics. 2004; 2 (2):145–62. PMID:15319512
64. Guimera R, Sales-Pardo M, Amaral LA. Classes of complex networks defined by role-to-role connec-tivity profiles. Nat Phys. 2007; 3(1):63–69. PMID:18618010
65. He Y, Wang J, Wang L, Chen ZJ, Yan C, Yang H, et al. Uncovering intrinsic modular organization of spontaneous brain activity in humans. PLOS One. 2009b; 4(4):e5226. doi:10.1371/journal.pone. 0005226PMID:19381298
66. Liang X, Zou Q, He Y, Yang Y. Coupling of functional connectivity and regional cerebral blood flow re-veals a physiological basis for network hubs of the human brain. Proc Natl Acad Sci USA. 2013b; 110 (5):1929–34. doi:10.1073/pnas.1214900110PMID:23319644
67. Zhang LJ, Wen J, Ni L, Zhong J, Liang X, Zheng G, et al. Predominant gray matter volume loss in pa-tients with end-stage renal disease: a voxel-based morphometry study. Metab Brain Dis. 2013; 28 (4):647–54. doi:10.1007/s11011-013-9438-7PMID:24065440
68. Jassal SV, Roscoe J, LeBlanc D, Devins GM, Rourke S. Differential impairment of psychomotor effi-ciency and processing speed in patients with chronic kidney disease. Int Urol Nephrol. 2008; 40 (3):849–54. doi:10.1007/s11255-008-9375-2PMID:18443915
69. Pliskin NH, Yurk HM, Ho LT, Umans JG. Neurocognitive function in chronic hemodialysis patients. Kidney Int. 1996; 49(5):1435–40. PMID:8731111
70. Williams MA, Sklar AH, Burright RG, Donovick PJ. Temporal effects of dialysis on cognitive function-ing in patients with ESRD. Am J Kidney Dis. 2004; 43(4):705–11. PMID:15042548
71. Bornivelli C, Aperis G, Giannikouris I, Paliouras C, Alivanis P. Relationship between depression, clini-cal and biochemiclini-cal parameters in patients undergoing haemodialysis. J Ren Care. 2012; 38(2):93– 7. doi:10.1111/j.1755-6686.2012.00259.xPMID:22429274
73. Prohovnik IL, Post J, Uribarri J, Lee H, Sandu O, Langhoff E. Cerebrovascular effects of hemodialysis in chronic kidney disease. J Cereb Blood Flow Metab. 2007; 27(11):1861–9. PMID:17406658
74. Holzer H, Marguc K, Pogglitsch H, Ott E, Katschnig H. The effects of haemodialysis on cerebral blood flow. Proc Eur Dial Transplant Assoc. 1981; 18:126–32. PMID:7329959
75. Bach R, Mertens PR, Liakopoulos V, Liapi G, Mann H, et al. Influence of hemodialysis on the mean blood flow velocity in the middle cerebral artery. Clin Nephrol. 2005; 64(2):129–37. PMID:16114789
76. Maggiore U, Cademartiri C, Cabassi A, Caiazza A, Tedeschi S, et al. Cerebral blood flow decreases during intermittent hemodialysis in patients with acute kidney injury, but not in patients with end-stage renal disease. Nephrol Dial Transplant. 2013; 28(1):79–85. doi:10.1093/ndt/gfs182PMID:22711517
77. Mildworf B, Rubinger D, Melamed E. The regional cerebral blood flow in patients under chronic hemo-dialytic treatment. J Cereb Blood Flow Metab. 1987; 7(5):659–61. PMID:3654805
78. Lundar T, Wiberg J, Sjøberg D, Aaslid R, Nornes H. Variations in middle cerebral artery blood flow
in-vestigated with noninvasive transcranial blood velocity measurements. Stroke. 1987; 18(6):1025–30. PMID:2961104
79. Faccenda F, Gallotta G, Rubba P, Federico S. Changes in middle cerebral artery blood velocity in ure-mic patients after hemodialysis. Stroke. 1991; 22(12):1508–11. PMID:1962325
80. Matsumoto M, Handa N, Terakawa H, Sugitani Y, Kamada T. Effects of hemodialysis on cerebral cir-culation evaluated by transcranial Doppler ultrasonography. Stroke. 1994; 25(2):408–12. PMID:
7905681
81. Mackaness C, Bedforth N, Mahajan R. Cerebral haemodynamics in patients with chronic renal failure: effects of hemodialysis. Br J Anaesth. 2005; 94(2):203–5. PMID:15531623
82. Tomasi D, Wang GJ, Volkow ND. Energetic cost of brain functional connectivity. Proc Natl Acad Sci USA. 2013; 110(33):13642–7. doi:10.1073/pnas.1303346110PMID:23898179
83. Kalender B, Ozdemir AC, Koroglu G. Association of depression with markers of nutrition and inflam-mation in chronic kidney disease and end-stage renal disease. Nephron Clin Pract. 2006; 102(3–4): c115–21. PMID:16286785
84. Greicius MD, Supekar K, Menon V, Dougherty RF. Resting-state functional connectivity reflects struc-tural connectivity in the default mode network. Cereb Cortex. 2009; 19(1):72–8. doi:10.1093/cercor/ bhn059PMID:18403396
85. Teipel SJ, Bokde AL, Meindl T, Amaro E Jr., Soldner J, Reiser MF, et al. White matter microstructure underlying default mode network connectivity in the human brain. Neuroimage. 2010; 49(3):2021–32. doi:10.1016/j.neuroimage.2009.10.067PMID:19878723
86. Greicius MD, Krasnow B, Reiss AL, Menon V. Functional connectivity in the resting brain: a network analysis of the default mode hypothesis. Proc Natl Acad Sci USA. 2003; 100(1):253–8. PMID:
12506194
87. Lu H, Zou Q, Gu H, Raichle ME, Stein EA, Yang Y. Rat brains also have a default mode network. Proc Natl Acad Sci USA. 2012; 109(10):3979–84. doi:10.1073/pnas.1200506109PMID:22355129
88. Vincent JL, Patel GH, Fox MD, Snyder AZ, Baker JT, Van Essen DC, et al. Intrinsic functional archi-tecture in the anaesthetized monkey brain. Nature. 2007; 447(7140):83–6. PMID:17476267
89. Song SH, Kwak IS, Kim SJ, Kim YK, Kim IJ. Depressive mood in pre-dialytic chronic kidney disease: Statistical parametric mapping analysis of Tc-99m ECD brain SPECT. Psychiatry Res. 2009; 173 (3):243–7. doi:10.1016/j.pscychresns.2008.08.007PMID:19682866
90. Song SH, Kim IJ, Kim SJ, Kwak IS, Kim YK. Cerebral glucose metabolism abnormalities in patients with major depressive symptoms in pre-dialytic chronic kidney disease: statistical parametric mapping analysis of F-18-FDG PET, a preliminary study. Psychiatry Clin Neurosci. 2008; 62(5):554–61. doi:
10.1111/j.1440-1819.2008.01849.xPMID:18950375
91. Buckner RL, Sepulcre J, Talukdar T, Krienen FM, Liu H, Hedden T, et al. Cortical hubs revealed by in-trinsic functional connectivity: mapping, assessment of stability, and relation to Alzheimer's disease. J Neurosci. 2009; 29(6):1860–73. doi:10.1523/JNEUROSCI.5062-08.2009PMID:19211893
92. Hagmann P, Cammoun L, Gigandet X, Meuli R, Honey CJ, Wedeen VJ, et al. Mapping the structural core of human cerebral cortex. PLOS Biol. 2008; 6(7):e159. doi:10.1371/journal.pbio.0060159
PMID:18597554
93. Tomasi D, Volkow ND. Functional connectivity density mapping. Proc Natl Acad Sci USA. 2010; 107 (21):9885–90. doi:10.1073/pnas.1001414107PMID:20457896
94. Buckner RL, Andrews-Hanna JR, Schacter DL. The brain's default network: anatomy, function, and relevance to disease. Ann N Y Acad Sci. 2008; 1124:1–38. doi:10.1196/annals.1440.011PMID:
95. Raichle ME, MacLeod AM, Snyder AZ, Powers WJ, Gusnard DA, Shulman GL. A default mode of brain function. Proc Natl Acad Sci USA. 2001; 98(2):676–82. PMID:11209064
96. Zang YF, He Y, Zhu CZ, Cao QJ, Sui MQ, Liang M, et al. Altered baseline brain activity in children with ADHD revealed by resting-state functional MRI. Brain Dev. 2007; 29(2):83–91. PMID:16919409
97. He Y, Wang L, Zang Y, Tian L, Zhang X, Li K, et al. Regional coherence changes in the early stages of Alzheimer's disease: a combined structural and resting-state functional MRI study. Neuroimage. 2007; 35: 488–500. PMID:17254803
98. Jiang L, Xu T, He Y, Hou XH, Wang J, Cao XY, et al. Toward neurobiological characterization of func-tional homogeneity in the human cortex: regional variation, morphological association and funcfunc-tional covariance network organization. Brain Struct Funct. 2014; Jun 6
99. Wang Z, Dai Z, Gong G, Zhou C, He Y. Understanding Structural-Functional Relationships in the Human Brain: A Large-Scale Network Perspective. Neuroscientist. 2014 Jun 24.
100. Wang J, Wang L, Zang Y, Yang H, Tang H, Gong Q, et al. Parcellation-dependent small-world brain functional networks: a resting-state fMRI study. Hum Brain Mapp. 2009; 30(5):1511–23. doi:10.1002/ hbm.20623PMID:18649353
101. Hlinka J, Palus M, Vejmelka M, Mantini D, Corbetta M. Functional connectivity in resting-state fMRI: is linear correlation sufficient? Neuroimage. 2011; 54(3):2218–25. doi:10.1016/j.neuroimage.2010.08. 042PMID:20800096
102. Liang X, Wang J, Yan C, Shu N, Xu K, Gong G, et al. Effects of different correlation metrics and pre-processing factors on small-world brain functional networks: a resting-state functional MRI study. PLOS One. 2012; 7(3):e32766. doi:10.1371/journal.pone.0032766PMID:22412922
103. van Wijk BC, Stam CJ, Daffertshofer A. Comparing brain networks of different size and connectivity density using graph theory. PLOS One. 2010; 5(10):e13701. doi:10.1371/journal.pone.0013701
PMID:21060892
104. Bialonski S, Wendler M, Lehnertz K. Unraveling spurious properties of interaction networks with tai-lored random networks. PLOS One. 2011; 6(8):e22826. doi:10.1371/journal.pone.0022826PMID:
21850239
105. Hosseini SM, Kesler SR. Influence of choice of null network on small-world parameters of structural correlation networks. PLOS One. 2013; 8(6):e67354. doi:10.1371/journal.pone.0067354PMID:
23840672
106. Zalesky A, Fornito A, Bullmore E. On the use of correlation as a measure of network connectivity. Neuroimage. 2012; 60(4):2096–106. doi:10.1016/j.neuroimage.2012.02.001PMID:22343126
107. Hermundstad AM, Bassett DS, Brown KS, Aminoff EM, Clewett D, Freeman S, et al. Structural foun-dations of resting-state and task-based functional connectivity in the human brain. Proc Natl Acad Sci USA. 2013; 110(15):6169–74. doi:10.1073/pnas.1219562110PMID:23530246