ENVIRONMENTAL ASSESSMENT OF MANGROVE COMMUNITIES IN TARUT BAY,
EASTERN ARABIAN PENINSULA, BASED ON MULTIDISCIPLINARY APPROACH
Ali Madan Al-Ali*, Dr Ainhoa González Del Campo, Prof Carlos Rocha
Centre for the Environment, University of Dublin, Trinity College, Dublin 2, Ireland ([email protected], [email protected], [email protected])
KEY WORDS: Mangrove, Pollution, Vegetation, Tarut, Multidisciplinary
ABSTRACT:
Tarut Bay contains some of the most important mangrove forests in the Arabian Gulf countries, which are facing significant anthropogenic pressures. A multidisciplinary approach based on remote sensing, fieldwork, and chemical analysis was adopted in order to identify the pressures facing the mangrove communities in Tarut Bay and subsequently evaluate its current environmental condition. The analysis focused on the 2011 to 2014 timeframe in particular. The results indicate that the mangrove communities in Tarut Bay cover currently around 11.32 square km. Two major mangrove cover changes were identified in the area during the studied period, with a net loss of around 0.675 square km happening in the interim. The analysis adopted the Normalized Difference Vegetation Index (NDVI) to evaluate the temporal change in vegetation concentration. Moreover, the study evaluated the overall pollution condition of 19 mangrove communities in Tarut Bay to be medium based on the Pollution Load Index (PLI). Nevertheless, some of the mangrove communities in Tarut Bay are very healthy while others are very polluted and require immediate action to improve their pollution status. The findings of this work led to recommending mangrove improvement measures to address further deterioration and disappearance of mangrove communities, including the re-opening of natural inlets and avoiding residential developments on the mangrove coast.
*
Corresponding author. Tel. +966506840096. E-mail address: [email protected] (A. M. Al-Ali) 1. INTRODUCTION
1.1 Importance of Mangrove Ecosystems
Mangrove wetlands usually develop and grow in intertidal zones, which are vulnerable ecosystems in most areas due to pressures exerted by human residential and industrial development needs. The mangrove ecosystem represents one of the most productive natural communities in the world (KFUPM, 1990) with high gross litter production that can reach up to 16.38 ha/yr (Nordhaus et al., 2006). Globally, the ecological significance of the mangrove is very well recognised. Mangrove wetlands provide critical ecosystem services, as they are important nursery habitats for small fishes and shrimps. Additionally, mangroves help in stabilising and protecting the coastal lands from erosion (Walters et al., 2008). The economic value of ecosystem services provided by mangrove communities comes from either direct uses such as provision of timber, honey, medicine and chemicals, or indirect uses such as water cleansing ability and carbon sequestration (Kuenzer & Tuan, 2013). Mangrove forests represent important ecological resources for the Arabian Gulf countries, as well as worldwide. Ten mangrove sites in the Arabian Gulf were studied by Kumar (2011) who found that the mangrove cover decreased at six sites during the period 1972 to 2001. One of these ten locations is Tarut Bay with -37% temporal change in mangrove cover during these 30 years (Kumar, 2011). This paper investigates in more details the historical changes in the mangrove communities in Tarut Bay, providing an update on their current status by focusing on the 2011 to 2014 period and looking for potential causes and consequences of mangrove change since 1970.
1.2 Aims and Objectives
The research leading to this paper aimed at answering questions related to the role of anthropogenic pressures (e.g. economic and social activities) in the recent changes and status of the mangrove communities. The analysis applied Remote Sensing (RS) to map and estimate the size and concentration of the mangrove communities in the bay and aims to identify the environmental quality differences between existing mangrove communities. In doing so, the analysis tries to determine the factors that have potentially affected the pollution status in each of the mangrove areas in the bay through understanding the quality of sediments in them. The ultimate objective is to infer any significant pressure in order to suggest or recommend solutions that help improve their status. This paper focuses on addressing the following main objectives:
• Map the current mangrove communities and calculate their total areas.
• Identify the historical changes in the presence of mangroves in Tarut Bay.
• Use RS Normalized Difference Vegetation Index (NDVI) to evaluate the concentration and health of each of the main mangrove communities in the bay. • Calculate the Pollution Load Index (PLI) using 20
field samples in the bay as an indicator of plant stress and pollution status of each mangrove community. • Identify the correlation between the RS and field
findings of the mangrove communities with chemical measures of the sediment samples.
• Based on achieving previous objectives, make recommendations to improve deterioration status.
1.3 Background and Rationale
Rabiayah, Snabis, Zor, Awamia, Safwa, and Ras Tanura (Figure 1). Tarut Bay contains one of the most important oil and gas infrastructures in Saudi Arabia where main fields, many wells and some refinery projects are located. The mangrove in Tarut Bay consists mainly of the black mangrove species (Avicenna marina), which are capable of enduring extreme environmental conditions. These species are present in Tarut Bay in relatively higher density when compared to elsewhere in the world. The earliest scientific work on the mangrove areas of Tarut Bay dates back to 1984. The study used 8 stations along the bay in order to obtain quantitative data on the mangrove communities’ ecosystem. The data included plant traits such as plant height, plant width, and branch diameter measurements. Additionally, the mangrove leaves and sediments were analysed for metals, grain size and hydrocarbon content (KFUPM, 1990).
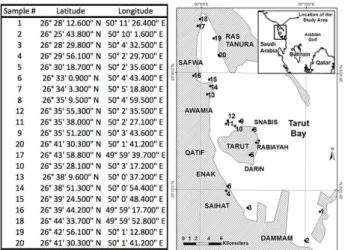
Figure 1: Map of the study area (Tarut Bay) with the names of the main coastal cities / villages along the bay and locations and coordinates of the 20 sampling locations. Coordinates are based
on WGS84 reference system.
Later studies utilised RS data in order to estimate temporal changes in the mangrove communities. For example, Almahasheer et al. (2013) estimated the change in total area of the mangrove in the bay during 6 years (1972, 1985, 1991, 1998, 2006 and 2011). They calculated the total area of the mangrove to be 12.3 km2 in 1972, of which only 44% coverage remained by 2011. Other studies also utilised RS methods and Landsat datasets to assess the mangrove changes in Tarut Bay, such as Qasem et al. (2005) for three years (1973, 1990 and 1999) and Kumar (2011) for two years (1972 and 1999) as discussed in the next section.
1.3.2 Mangrove Cover in Tarut Bay: An analysis of the RS findings from previous studies (Almahasheer et al., 2013; Kumar, 2011; Qasem et al., 2005) shows both agreements and contradictions in the results (Figure 2). For example, Qasem et al. (2005) largely underestimated the area size in 1973 when compared to Kumar´s (2011) results for that same year. Although both of them used Landsat-MSS, this difference can be attributed to reasons such as data acquisition date or applicability of the different estimation algorithm method used by Qasem et al. (2005) who adopted the Spectral Angle Mapper (SAM) algorithm and not the Normalized Difference Vegetation Index (NDVI) applied by Kumar (2011) and Almahasheer et al.
(2013). However, comparing the estimation by Almahasheer et al. (2013) in 1972 with that of Kumar (2011) for 1973, suggests a 49% decline during one year period (1972 to 1973). This could be a long-term effect of the oil spill pollution incident that happened on 1970. KFUPM (1990) reported that
more mangrove trees died because of the spill than were originally reported by Spooner (1970), and many more mangrove trees failed to reproduce (KFUPM, 1990). It has been noticed that both Kumar (2011) and Almahasheer et al. (2013) applied the same estimation algorithms (NDVI) to the Landsat data during the 1972 and 1973 years. However, the large decline in mangrove cover observed during this period could also have been affected by the differences in the satellite data themselves as well as the differences in the procedures used by the authors in processing the satellite data. For example, Almahasheer et al.
(2013) used a Landsat-MSS (acquired on 24/08/1972) with 60m spatial resolution, while Kumar (2011) used a Landsat-MSS (acquired on 08/01/1973) with 79m spatial resolution. Additionally, Kumar (2011) resampled his data to 30m resolution in order to make it compatible with the 1999 Landsat-ETM data. Furthermore, Kumar (2011) also employed region masks to isolate the unwanted areas from the image. It is considered that these differences in approaches when handling similar RS data may have affected the results.
Figure 2: Total area of the mangroves (km2) in Tarut Bay during 9 years in the period 1972 to 2011, as estimated by three studies: S1: Qasem et al. (2005); S2: Kumar (2011) and S3: Almahasheer et al. (2013) using two estimation algorithms:
NDVI and SAM.
Other data from the three studies provide a logical sequence of fluctuations in areal cover, starting with a decline after 1985 until a low presence of mangrove in 1991 was reached due to the pollution effect from a large oil spillage associated with the Gulf War of 1991 (Almahasheer et al., 2013). After that, a recovery of the mangrove happened, with an approximate 119% increase during the 1991 to 1998 period. Both Qasem et al.
(2005) and Kumar (2011) agreed that the next decline happened in 1999. However, Almahasheer et al. (2013) estimated that another recovery period happened 7 years later, in 2006. This recovery was followed by another decline of approximately 40% that left only 5.42 km2 of mangrove area by 2011 (Almahasheer et al., 2013).
1.3.3 Anthropogenic Pressures: The anthropogenic pressures have led to dredging and burying imrportant mangroves such as Enak, South of Tarut, and Awamia (Figure 1). Large industrial and residential developments have happened in this region during the last 40 years, affecting the mangrove communities. One of the earliest documented impacts on mangroves was the oil spill resulting from a pipeline breaking near the north-west shore of Tarut bay during a storm in April 1970 (Spooner, 1970). Currently, the effects of anthropogenic pressures and impacts differ from one location to another. For example, the mangrove community in Dammam is located near to the main sea port in the Eastern province which includes many industrial and commercial activities. On the other hand, the mangrove communities in Saihat and Tarut Island mainly face the pressure of residential developments and sewage discharge. Defew et al. (2005) determined that high volume of untreated domestic sewage discharge is harmful to mangrove forests. Awamia mangrove is located in an oil and gas pipelines area and, as a result, it faces oil spillage risk, while Safwa
This contribution has been peer-reviewed.
mangrove is additionally at rik due to the currently on-going causeway development over the sea to connect Safwa with the Ras Tanura terminal. Finally, the Ras Tanura mangrove is located near an industrial city containing oil refinery facilities in addition to residential development.
1.3.4 Heavy Metal Pollution in the Mangrove: Heavy metals represent potential threat to the mangrove ecosystem (Agoramoorthy et al., 2008). There are some strong indications that metal stress is a direct cause of tree damage (Gawel et al., 1996). Sediments represent an important sink for heavy metals in aquatic environments (Mountouris et al., 2002). Findings on the Western side of Saudi Arabia based on mangrove sediments in the Red Sea indicated that contamination from heavy metals such as Zn, Cu, Cd and Pb come from anthropogenic sources (Usman et al., 2013). International literature identifies many factors or indices to understand toxicity or polution levels associated with these heavy metals such as bioconcentration factors (BCF), pollution index (PI), integrated pollution index (IPI), and geo-accumulation index (Igeo) (Usman et al., 2013; Agoramoorthy et al., 2008). However, the PLI is one of the good established pollution indicators that has been commonly used to evaluate the quality of coastal sediment in Saudi Arabia (Badr et al., 2009) and other parts of the world such as France, USA and Ireland since 1979 (Wilson, 2003).
2. MATERIALS AND METHODS
The methods used to address the aims and objectives of this research can be classified into three categories as follows: Mapping / RS, fieldwork and chemical analysis methods. The vegetation index (NDVI) was calculated from SPOT-5 images to understand the spatial extent of mangrove communities’ health and concentration in Tarut Bay for the years 2011 and 2014. Based on these results, fieldwork plans and sampling locations were selected. Digitisation of high-resolution optical satellite imageries (GeoEye-1) was adopted in order to identify the accurate borders of the mangrove communities, identify their densities and calculate their areas in 2014. Based on these borders and the produced vegetation indices, statistics of the NDVI were calculated for each mangrove community in Tarut Bay. The mangrove sediment samples were collected and the laboratory chemical analysis followed by calculating the stress / pollution indicator (PLI) based on these samples. The analysis then tried to relate mapping / RS and fieldworks findings with PLI results and/or metals concentrations. This was done in order to identify practical solutions to improve the environmental status of Tarut Bay. The methodological aspects are further described next.
2.1 Mapping / Remote Sensing
RS data from two different satellite missions with different spatial resolutions were utilised in this study: SPOT-5 and GeoEye-1. SPOT-5 was used to calculate the RS vegetation indices for the years 2011 and 2014, as this satellite mission has recent imageries for the study area with the required bands (Red and Infrared) for this purpose. Higher resolution RS images, i.e. GeoEye-1, were also used for more accurate mapping of mangrove communities in 2014.
2.1.1 Calculation of RS Indices: NDVI was used in previous mangrove research in Tarut Bay (Almahasheer et al., 2013; Kumar, 2011). The NDVI algorithm is based on the reflective Infrared (IR) and red bands, where the IR band is considered as the most useful RS method for vegetation stress
determination (Genderen, 1974). Furthermore, NDVI of RS data showed very good ability to predict types of vegetation studied by Meneses-Tavar (2011) who used 980 mangrove sites in the research. NDVI values in the resulting raster surface ranged from -1.0 to 1.0 where higher values indicate more vegetation concentration and the lower values related to non-vegetated areas such as water features and bare soil (Khan & Kumar, 2009). The adopted algorithm is defined as in equation (1).
NDVI= (RIR-R) / (RIR+R) (1)
where NDVI = Normalized Difference Vegetation Index RIR = Reflective Infrared band
R = Red band.
NDVI for the years 2011 and 2014 was calculated using the ERDAS Imagine NDVI tool, based on SPOT-5 satellite imagery (acquisition dates: 11-May-2011 and 23-February-2014, spatial resolution =2.50m). Based on these data, the NDVI surfaces of the mangrove communities and the NDVI values of the sampling locations were obtained.
2.1.2 Digitisation of GeoEye-1 and SPOT-5 Images: Accurate mapping of the mangrove communities was based on digitisation of satellite imagery and identification of possible drivers of change to understand the environmental context of each mangrove area. The GeoEye-1 images (pixel size= 0.5 metres) were acquired during 2014 (February and June) through Digital Globe, Colorado, U.S.A. The processing level of the GeoEye-1 products was standard geometrically corrected true colour imagery, free from any cloud cover. The manual digitisation process with intensive field validation resulted in getting accurate borders of mangrove communities in polygon format. Finally, SPOT-5 images with a 2.5m resolution (acquired in May 2011) were used to digitise some of the mangrove communities in Tarut Bay in order to estimate the major landfilling change in the Dammam area.
data about vegetation health, which can be used as an additional explanatory variable in future statistical analysis.
2.2 Fieldwork Methods
The fieldwork included recording visual observations regarding each of the visited mangrove communities in relation to tree density, approximate height of the mangrove trees, and sampling location. The fieldwork also included observing the distribution of the mangrove trees in comparison with other types of vegetation, in addition to the location of nearby infrastructure (e.g. roads, buildings, factories, etc.). The handheld GPS was used to validate and improve the accuracy of the digitisation of mangrove boundaries that were created based on RS data. The fieldwork also included observing potential drivers that could affect mangrove communities, such as potential pollution sources and location of inlets or discharge points. The fieldwork also facilitated identification of suitable sampling locations, and collecting surface sediment samples from each mangrove community. The fieldwork targeted sampling from a high-density location at the centre of each mangrove community but this was subject to accessibility. An access permit was required in order to enter most of the mangrove areas in Tarut Bay, as most of the locations were security restricted.
2.3 Chemical Analysis Methods
Three laboratory chemical methods were applied for the analysis of the sediment samples collected from 20 different locations along Tarut Bay. The chemical analysis methods relate to the following: Metals and P, Loss-on-ignition, and Total Nitrogen. Results from these three methods were used to calculate PLI values for each site. The laboratory work started immediately after collection with stabilisation of the samples. This was achieved by air-drying the sediments in the open air at the base location (Saihat city). The maximum temperature in the base location during the drying period ranged from 42°C to 48°C during the daytime while the minimum temperature ranged between 22°C and 30°C at night. The wind speed ranged from 2 km/h up to 44 km/h during that period. The relative humidity was also variable, ranging from 5% to 84%; with no rain during the period of air-drying. Given these weather conditions, at least 48 hours were required to completely air-dry any of the sediment samples including mixing the samples from time to time. A backup for each sample was prepared and kept in the study area base location. In addition, a duplicate analysis for each sediment sample was carried out resulting in 40 measurements for the chemical analysis produced by each method for each parameter. Break-up of the air-dried sediments was performed using a pestle and mortar, and fractions with size > 2 mm were discarded using a 2 mm stainless steel sieve. The sieved samples were dried again in the oven at 100°C over the weekend before starting the procedures for the three chemical analysis.
2.3.1 Analysis for Metals and P: Each one of the 20 sediment samples was analysed twice for metals and P using a nitric acid (HNO3) digestion method. The method started by cooling the samples for at least half an hour in a dessicator, after removing them from the oven. Subsequently, approximately 2.0 g of each sediment sample was weighed to 4 decimal places into a digestion tube. Anti-bumping granules were added to each of the digestion tubes. The 40 tubes were prepared in the fume cupboard and 10 ml of AnalaR grade nitric acid were added to each tube. Due to the reactive nature of the samples, this was carried out in stages. Three ml of HNO3 were added in the first
place, followed by another 3 ml three hours later the same day after the main reaction had taken place. It was necessary to replace 4 tubes that were very reactive and that overflowed when adding the acid aliquot. This occurred with samples S6, S6d, S14 and S18. The digestion tubes were then left in the fume cupboard overnight. The remaining 4 ml of HNO3 were added to the 40 digestion tubes the next day. An additional two blank tubes with AnalaR nitric acid only were also digested as control tubes. The 42 tubes were then transferred to the digester and allowed to digest at 120°C for one hour, and then at 140°C for two hours. The tubes were cooled, and distilled water was added. The samples were left to stand overnight. The following day these samples were filtered through Whatman No. 1 filter papers and made up with distilled water to 50 ml. The digested samples were analysed by ICP-OES in order to obtain the concentrations of metals and P, reported in mg/l. After analysing the 42 tubes for metals and P by ICP-OES, average results of the two control tubes were used to correct the actual results of the 40 samples. It was assumed that the values obtained from these two tubes acting as control were due to local environmental contamination, so the correction was done using the average concentrations of metals and P reported by control tubes. After performing the correction of values of metals and P for each sample, conversion of the metals and P concentrations from mg/l in the digestion into ug/g was done through applying equation (2).
Metals concentration (ug/g) = mg/l in digest (reported by ICP-OES after correction) X 50 / Digested Mass (g) (2)
2.3.2 Organic Matter content by Loss-On-Ignition (LOI): The LOI method at 500°C was used to estimate the organic content of the solid substrates in the sediments (Allen, 1989). This was done by weighing two dry clean crucibles to four decimal places of a gram for each of the 20 samples. Two to three grams of sediment were added to each one of the 40 crucibles and the weight of the dry sample with the crucible was noted, and the difference calculated, to four decimal places. The crucibles were placed in the muffle furnace at 500°C for four hours. After that, the crucibles were removed from the muffle furnace when cool, and placed in the dessicators before re-weighing them. The weight loss of the sample was calculated by subtracting the weight of the ashed sample (at 500°C) from the original weight of the dry sample. Finally, the result was expressed as a percentage (%) of the original sample mass.
2.3.3 Total Nitrogen: Total nitrogen in the sediment was determined using an elemental analyser (Elementar EL Cube). First, a Fritsch Pulverisette ball mill was used to grind some of each sample to a fine powder at rotational speed of 600 rpm during two minutes. The samples were then placed in the oven at 100°C overnight. The micro-balance was then used to accurately weigh around 30 mg of the dried and ground sediments into 40 tin cups (two for each site sample). The cups were carefully closed to expel as much air as possible and placed in the auto-sampler of the elemental analyser. The samples were then combusted under oxygen at 950°C and the combustion gases were subsequently analysed by thermal conductivity. Results were produced as % by weight of nitrogen in the sample. The values for Nitrogen (N) were converted from % to ug/g.
This contribution has been peer-reviewed.
2.3.4 Calculating the Pollution Indicator (PLI): The concentration results of metals, P, N and LOI obtained, using the methods described, were used to calculate the PLI for each sampling site. In order to calculate the pollutant load (PL) for each one of the parameters, the baseline and threshold values for each pollutant were adopted after Jeffrey et al. (1985) as indicated in Table 1. Detrimental environmental change can be observed beyond these threshold values of the pollutant concentrations (Jeffrey et al. 1985). Then, the PL of each pollutant in each site was calculated using equation (3).
(3)
Table 1: Baseline and threshold values for calculation of pollutant loads adopted from Jeffrey et al. (1985).
The PLI of each site was then calculated using equation (4).
PLIsite = ( PLCd X PLCr X PLCu X PLFe X PLNi X PLP X PLPb X PLZn X PLN X PLLOI ) ^ (1/10) (4)
Finally, the PLI of the whole Tarut bay was then calculated by averaging out the results from all sites, according to equation (5).
PLIbay = ( PLIsite1 X PLIsite2 X PLIsite3 X ………… X
PLIsite20 ) ^ (1/20) (5)
3. RESULTS AND FINDINGS 3.1 Mangrove Communities of Tarut Bay
The fieldwork findings were based on observations and sampling in the study area during the period 5th to 22nd July 2014, and the RS results were based on digitising the GeoEye-1 satellite dataacquired during 2014. The mangrove communities in this study are defined as any group of mangrove trees that are isolated by an artificial or natural barrier or separated by distance from the other group of mangrove trees regardless of the area size or density of the community. The RS work identified 39 mangrove communities within Tarut Bay. 29 of these communities were visited during the fieldwork, and 20 samples were taken from the largest accessible communities. The area sizes of these communities range from as small as 1,249 square metres up to 3.42 square km. Based on recent and high resolution imagery and field validation, the current total area of all mangrove communities was estimated to be 11.32 square km (regardless of the variety of the levels of density in these communities). These communities were distributed along the coast of 6 main cities in Tarut Bay: Dammam, Saihat, Tarut, Awamia, Safwa, and Ras Tanura (Figure 1).
3.2 NDVI Measures
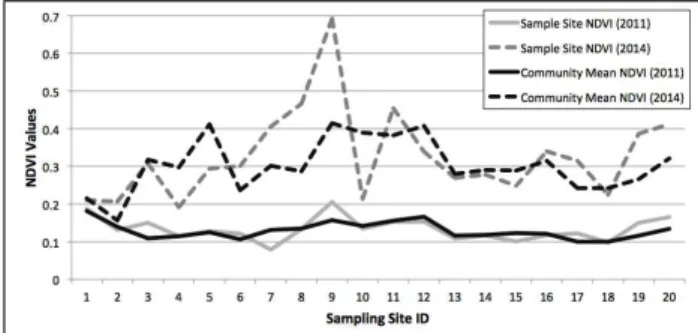
The vegetation index (NDVI) was calculated using recent RS data from SPOT-5 mission. The NDVI values of the 20 sampling locations were calculated after producing the NDVI raster surfaces for the years 2011 and 2014. Figure 3 illustrates the resulting NDVI measures of each sampling location and the mean NDVI of the associated mangrove communities in Tarut Bay. The mean NDVI ranges from 0.099 to 0.181 for the 2011 RS data, while it ranges from 0.156 to 0.414 for the 2014 data.
However, distinguishing and extracting the NDVI of the mangrove communities alone was difficult because of the nearby farms or salt marshes which gave similar reflectance and high NDVI values. In order to isolate mangroves from other vegetation, high resolution imagery (GeoEye-1) were applied, to facilitate the creation of accurate manrgove community boundaries and get other NDVI statistics.
Figure 3: NDVI values of the 20 sampling locations and the NDVI means in each related mangrove community.
3.3 Chemical Analysis Results
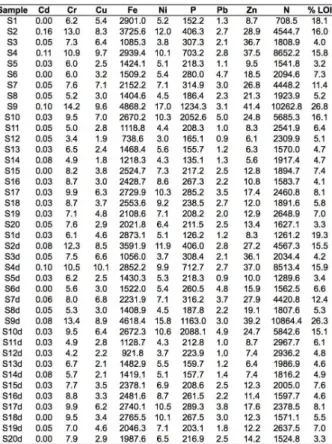
Table 2 shows the concentrations (ug/g) reported twice for each sampling site - once these were corrected using the control tubes average and unit conversion by equation (2), for the following contents: Cadmium (Cd), Chromium (Cr), Copper (Cu), Iron (Fe), Nickel (Ni), Lead (Pb), Zinc (Zn), and Phosphorus (P). Nitrogen (N) is also reported as (ug/g), while the result of LOI is expressed as percentage (%) of the original sample mass. The sample IDs with the letter “d” are the duplicate measurements of the same sediments samples. The PLI values range from zero to 10, where 10 indicates the natural unpolluted status and the low values approaching zero indicate highly polluted and degraded conditions (Jeffrey et al., 1985). In addition to the site PLI, the PL of each parameter for each of the original or duplicate samples were calculated using equation (3). The absolute difference in the PLI of sampling sites between the original samples and the duplicates were always less than 1 (avg=0.22, max=0.95, min=0.006). In other words, the average agreement of PLI values between originals and duplicates was 96% and always more than 89%. This indicates good precision of the analysis.
The average Site PLI measures using the original and duplicate results are illustrated for the 20 sites in Figure 4. For the overall Tarut Bay, the results gave two PLIbay values as following: original samples PLIbay = 5.139 and duplicate samples PLIbay = 5.100.
Table 2: The concentrations of metals, P and N in ug/g and LOI in % for the 20 original samples and the 20 duplicates.
4. DISCUSSION 4.1 Mangrove Cover Changes (2011 to 2014)
Careful review of the 2011 RS map produced by Almahasheer
et al. (2013) can help to infer some important information about major changes in the presence of mangrove communities in Tarut Bay during a three years period (i.e. April 2011 to July 2014). In particular, two major changes in the mangrove areas were noticed at the two ends of Tarut Bay. The first major change is the disappearance of large mangrove communities in the Dammam port area at the Southern end of Tarut Bay. These communities were observed by RS data on 20 April 2011 (Almahasheer et al., 2013). However, the recent satellite imagery (2 June 2014) and the fieldwork visit (in July 2014) both confirmed the loss of most of these communities in the Dammam port area, except for a very small remain of mangrove trees which represents only 0.27% of the original communities in the same area in 2011. The second major change that was not reported during 2011, which is a positive change, occurred at the Northern edge of the bay - near to the oil and gas refinery in Ras Tanura. The new Saudi Aramco planting project with a target of 1.2 million mangrove trees planted by 2016 in different locations in the Saudi coast (Aramco, 2011), was not detected using 2011 data by Almahasheer et al. (2013) as the planting was at the initial stages. This research was able to detect seven new mangrove communities in 2014, with an estimated total area of 0.644 square km. Consequently, the addition of mangroves to the bay is now known. However, the lost mangrove in Dammam port area in 2011, as verified in this study, was even larger, accounting for 1.31 square km.
There was no other major cover change observed based on 2011 and 2014 RS images in the mangrove communities in the bay. However, when comparing the total mangrove cover area of 2011 (5.42 square km) reported by Almahasheer et al. (2013) with the results obtained in this research for 2014 (11.32 square km), it can be observed that the area doubled in size in this short period. Such a rapid growth during only three years can be contested given the growth in Aramco planting areas in Ras Tanura being overtaken by the larger loss in Dammam port area. However, findings from previous research work (KFUPM, 1990) provide justification of the double growth increments of the mangrove trees in two years only. The same research found that the horizontal growth of the mangrove communities in Tarut Bay was even greater than the vertical or height growth of the mangrove trees (KFUPM, 1990). This suggests that the double growth during the 3 years (2011 to 2014) is possible. However, there was no major natural growth of the mangrove cover in the other areas in Tarut Bay, to add to the new 0.644 square km of Saudi Aramco planting. Therefore, the only possible explanation to the estimation difference between 2011 and 2014 is consideration of the fact that the total area size on 2011 was calculated by Almahasheer et al. (2013) based on a 10m resolution SPOT-4 imageries while the mangrove extent calculation in this research was based on digitising 0.5m resolution GeoEye-1 imagery acquired during 2014. Almahasheer et al. (2013) used the coast mask and were not able to detect mangrove communities smaller than 10m wide using an automatic NDVI extraction. In contrast, this study was able to include area calculations of many of the small mangrove communities due to manual corrections of the communities’ borders in conjunction with intensive validation during fieldwork. The intensive fieldwork combined with using very high resolution RS data increased the mapping accuracy in this study. Finally, this study considered even the low-density mangrove communities despite the limitation that these could sometimes include more marshes. So, the difference in the total area calculation between the two studies may have been affected by factors such as processing procedures, types and accuracy of RS data, and mangrove community definitions adopted in each study.
4.2 Vegetation Indices of the Mangrove
Analysis of the NDVI statistics can provide a good idea about the mangrove plant concentration in the vegetation communities. Previous research in Tarut Bay mangroves (Khan & Kumar, 2009) used the 0.1 thresholds of NDVI values to recognise mangrove trees after the shoreline; where the higher values indicated the better-established vegetation. Review of the NDVI values of the 20 sampling locations shows that all locations in both 2011 and 2014 recorded NDVI values above this 0.1 threshold, except for two locations in 2011 (samples 7 and 18) which recorded 0.07 and 0.09 respectively. The mean NDVI of the community of sample 18 (in Khurey West) was also lower than this threshold in 2011 (recorded as 0.09). This can be attributed to the low density of mangrove trees in the Northern side of Khurey West, as the other sampling location at the South of this site, the same community but higher tree density portion, recorded a higher NDVI value (i.e. 0.12 at site 17) on 2011. Based on the NDVI means of the 19 communities, the overall NDVI mean was calculated to be 0.131 in 2011 and 0.306 in 2014. Figure 3 illustrates the trend of NDVI means of the mangrove communities and compares them with the NDVI values of the 20 sampling locations for the years 2011 and 2014. The general increase in the NDVI values during the last 3 years (2011 to 2014) indicate higher vegetation concentration in Tarut Bay. This fact should not ignore the effect of different
This contribution has been peer-reviewed.
seasons of the data acquistion, as 2011 data were acquired in May while 2014 data were acquired in February. Although the mangrove is an evergreen tree, the NDVI values could be affected by the fact that 2011 data were acquired in the spring season while the 2014 data were acquired in the winter season.
4.3 Pollution Status of the Mangrove
Initially, PLI results of both the original 20 and the 20 duplicate samples correlated, as the average absolute difference between the two samples of each site was only 0.22 out of 10. This was reflected in the overall average PLI for the entire Tarut Bay which can be considered to have medium pollution status (Bay PLI = 5.12 out of 10). However, the results showed wide variability in the levels of pollution across the 20 sampling locations, ranging from PLI values as low as 0.5 up to 9.3. This indicates that some of the mangrove communities in Tarut Bay are very healthy and in excellent condition (such as site 5) while others are in real danger of death as result of their highly polluted status (such as sites 9 and 10). Few sites are within the range of the bay average with PLI values between 4 and 6.7 such as sites 1, 7, 17, and 19. Six locations are healthier with higher PLI values in the range of 7.2 to 7.8 such as sites 3, 6, 11 and other three sites in Safwa and Ras Tanura cities. The remainig six sites recorded the highest PLI values (8.2 to 9.3) in the following locations: Saihat Fayhaa, Snabis, Turkeyah North, Ramis South, Ramis North, and Ras Tanura Cornish. Some of the best six locations, with highest PLI values, have sandy sediments such as Awamia mangrove communities in sites 13 and 14. However, four sites in Tarut bay can be considered under real risk of deterioration with recorded PLI values between 0.5 to 2.8. These four sites are located in Dammam opposite to National Feed Mill, Saihat Naseem, Inner Zor and Jamaeen in Northern of Tarut Island.
4.4 Correlation of the Findings
Review of the deterioration status of the mangrove communities as identified through PLI records leads to a number of insights. For instance, three sites in the pipelines area (sites 13, 14 and 15) in Awamia and Safwa recorded high PLI values indicating that the environmental measures applied in the oil and gas industry are working fine there. On the other hand, the four sites nearest to Ras Tanura (sites 17, 18, 19 and 20) recorded lower PLI values indicating that measures in Ras Tanura should also be further improved. On the other side, site 2 in Dammam recorded PLI value of 2.8 out of 10. This high pollution condition can be attributed to the fact of the ongoing landfilling and construction activities which resulted in removing large mangrove communities in this area. The research found that site 2 had the highest concentration of Cd among the 20 locations. On the other hand, site 4 in Naseem is also in a deteriorated condition as indicated by its low PLI value of 1.5. This site recorded the highest concentration of Cu metal. Although only a 25m wide manmade barrier separates the two communities Naseem and Fayhaa, sample 5 in the Fayhaa mangrove community recorded the best PLI value (9.3) among the 20 samples. This contradiction in the pollution condition between two adjacent communities is caused by the different pressures facing each community. For example, an untreated sewage discharge from the nearby homes was continuously pouring into the currently closed Naseem lake for at least 25 years. This direct sewage discharge into Naseem stopped in 2009 after completion of the sewage network for the residential area. So, high pollution status would be expected in this case as the mangrove trees are being located in a closed lake with sewage discharge. In contrast, the adjacent Fayhaa mangrove reported
the best unpolluted condition in the bay because it is located in open sea while fresh water from an agricultural discharge channel provides a continuous influx into the community. The two sites (9 and 10) which recorded the lowest PLI values (0.5 and 0.9) in the bay (Zor and Jamaeen) are also characterised by being closed communities but of much larger area (1.01 square km). These two communities with current worst pollution status in Tarut Bay is also facing pressures similar to Naseem community where only 4 sets of pipes from the northern side are available for the water influx from the sea to the closed mangrove communities and a continuous discharge of sewage from the southern side. Additionally, residential developments are also progressing on the Southern side of the Jamaeen mangrove community. These two sites recorded the highest concentrations of several pollutants. For example, site 9 not only recorded the most polluted location in the bay based on PLI results but also the highest concentrations of Cr, Fe, Ni, Zn and LOI. Similarly, site 10 recorded the highest concentrations of P and Pb. Also, visual symptoms of the stands affected by metal stress was noticed as the trees started to dry at the bottom in these two communities (i.e. Zor and Jamaeen). Despite of this deteriorated condition, the RS vegetation indices indicate that the trees are still growing in the two locations, where the NDVI values increased during the (2011 to 2014) period from 0.21 to 0.44 in site 9 and from 0.13 to 0.18 in site 10. This confirms the enormous ability of mangrove species, Avicenna marina to survive in extreme condition.
5. CONCLUSION
the overall health of the mangroves in Tarut Bay. Sewage discharge plays an important role in mangrove deterioration and remedial action should be implemented to avoid this in the future. In contrast, the study found that the agricultural discharge channels potentially improve the status of mangrove communities in Tarut Bay but the ministry of agriculture is currently working on project that is changing the irrigation system. So, it is recommended that future studies also monitor the pollution status of the currently healthy mangrove communities to identify any effect of changing the agricultural irrigation system. RS vegetation indices indicated that mangrove trees are able to grow and adapt even in very difficult and polluted conditions. Finally, the methodology applied in this study indicates that combining RS with field observations and chemical analysis presents a more successful way to understand and evaluate the environmental patterns of the mangrove communities in a multidisciplinary and sustainable approach. Then, it is recommended that such an environmental assessment based on three methods to be implemented on a regular basis on the mangrove communities of Tarut Bay in order monitor their status more closely.
ACKNOWLEDGEMENTS
The author is pleased to give special acknowledgements to the Saudi Wildlife Authority, Leadership of Security Guards and King Abdulaziz City for Science and Technology who facilitated and supported the fieldworks and RS. Also, special thanks to Mr. Mark Kavanagh for his essential support in the chemical laboratory work and Mr. Ja’afar Al-Safwani for sharing useful local knowledge with the author.
REFERENCES
Agoramoorthy, G., Chen, F.-A. & Hsu, M. J., 2008. Threat of heavy metal pollution in halophytic and mangrove plants of Tamil Nadu, India. Environmental Pollution, 155, 320-326.
Allen, S. E., 1989. Chemical Analysis of Ecological Materials. 2nd ed. Oxford: Blackwell Scientific Publications.
Almahasheer, H., Al-Taisan, W. & Mohamed, M. K., 2013. Mangrove Deterioration in Tarut Bay on the Eastern Province of the Kingdom of Saudi Arabia. Pakhtunkhwa Journal of Life Science, 1, 49-59.
Aramco, S., 2011. Mega plan to cultivate the coast of the Kingdom. Saudi Aramco Weekly Newspaper, 7(6), 6-7.
Badr, N., El-Fikry, A., Mostafa, A. & Al-Mur, B., 2009. Metal pollution records in core sediments of some Red Sea coastal areas, Kingdom of Saudi Arabia. Environmental Monitoring and Assessment, 155(1-4), 509-526.
Defew, L. H., Mair, J. M. & Guzman, H. M., 2005. An assessment of metal contamination in mangrove sediments and leaves from Punta Mala Bay, Pacific Panama. Marine Pollution Bulletin, 50, 547-552.
Gawel, J. E., Ahner, B. A., Friedland, A. J. & Morel, F. M., 1996. Role of heavy metals in forest decline indicated by phytochelatin measurements. Letters to Nature, 381, 64-65.
Genderen, J. L., 1974. Remote Sensing of Environmental Pollution on Teesside. Environmental Pollution, 6, 221-234.
Jeffrey, D. W., Wilson, J. G., Harris, C. R. & Tomlinson, D. L., 1985. A Manual for the evaluation of estuarine quality, Dublin: The Irish Estuarine Research Programme.
KFUPM, 1990. Tarut Bay biotopes investigation mangrove communities, Dhahran: Water Resources and Environment Division: Aramco Sustaining Research Project Environmental Studies.
Khan, M. A. & Kumar, A., 2009. Impact of “urban development” on mangrove forests along the west coast of the Arabian Gulf. e-Journal Earth Science India, 2(3), 159- 173.
Kuenzer, C. & Tuan, V. Q., 2013. Assessing the ecosystem services value of Can Gio Mangrove Biosphere Reserve: Combining earth-observation- and household-survey-based analyses. Applied Geography, 45, 167-184.
Kumar, A., 2011. Temporal changes in mangrove cover between 1972 and 2001 along the south coast of the Arabian Gulf. Dhahran, King Fahd University of Petroleum and Minerals.
Meneses-Tovar, C.L., 2011/12. NDVI as indicator of degradation. Unasylva 238, 62, 39-46.
Mountouris, A., Voutsas, E. & Tassios, D., 2002. Bioconcentration of heavy metals in aquatic environments: the importance of bioavailability. Marine Pollution Bulletin, 44, 1136-1141.
Nordhaus, I., Wolff, M. & Diele, K., 2006. Litter processing and population food intake of the mangrove crab Ucides cordatus in a high intertidal forest in northern Brazil. Estuarine, Coastal and Shelf Science, 67, 239-50.
Qasem, A. M., Fadlalla, Y. H., Mah, A. X., Burwell, B. O. & Abdullatif, A. M., 2005. Detecting mangrove changes using Landsat imagery: Tarut Bay pilot project. Khobar, Saudi Aramco.
Spooner, M., 1970. Oil spill in Tarut Bay, Saudi Arabia. Marine Pollution Bulletin, 1(11), 166-167.
Usman, A. R., Alkredaaa, R. S. & Al-Wabela, M. I., 2013. Heavy metal contamination in sediments and mangroves from the coast of Red Sea: Avicennia marina as potential metal bioaccumulator. Ecotoxicology and Environmental Safety, 97, 263-270.
Walters, B., Ronnback, P., Kovacs, J., Crona, B., Hussain, S., Badola, R., Primavera, J., Barbier, E. & Dahdouh-Guebas, F., 2008. Ethnobiology, socio-economics and management of mangrove forests: A review. Aquatic Botany, 89, 220-236.
Wilson, J. G., 2003. Evaluation of esturine quality status at system level using the biological quality index and the pollution load index. Biology and Environment: Proceeding of the Royal Irish academy, 103B(2), 49-57.
This contribution has been peer-reviewed.