Acidification on a Reef Building Coral
Paulina Kaniewska1*¤, Paul R. Campbell2, David I. Kline1, Mauricio Rodriguez-Lanetty3, David J. Miller4, Sophie Dove1,4., Ove Hoegh-Guldberg4,5.
1School of Biological Sciences, The University of Queensland, St Lucia, Queensland, Australia,2Agri-Science Queensland, Department of Employment, Economic Development and Innovation, Dutton Park, Queensland, Australia,3Department of Biology, University of Louisiana at Lafayette, Lafayette, Louisiana, United States of America,4ARC Centre of Excellence for Coral Reef Studies and Coral Genomics Group, School of Pharmacy and Molecular Sciences, James Cook University, Townsville, Queensland, Australia,5Global Change Institute, The University of Queensland, St Lucia, Queensland, Australia
Abstract
As atmospheric levels of CO2 increase, reef-building corals are under greater stress from both increased sea surface
temperatures and declining sea water pH. To date, most studies have focused on either coral bleaching due to warming oceans or declining calcification due to decreasing oceanic carbonate ion concentrations. Here, through the use of physiology measurements and cDNA microarrays, we show that changes in pH and ocean chemistry consistent with two scenarios put forward by the Intergovernmental Panel on Climate Change (IPCC) drive major changes in gene expression, respiration, photosynthesis and symbiosis of the coral,Acropora millepora, before affects on biomineralisation are apparent at the phenotype level. Under high CO2 conditions corals at the phenotype level lost over half their Symbiodinium
populations, and had a decrease in both photosynthesis and respiration. Changes in gene expression were consistent with metabolic suppression, an increase in oxidative stress, apoptosis and symbiont loss. Other expression patterns demonstrate upregulation of membrane transporters, as well as the regulation of genes involved in membrane cytoskeletal interactions and cytoskeletal remodeling. These widespread changes in gene expression emphasize the need to expand future studies of ocean acidification to include a wider spectrum of cellular processes, many of which may occur before impacts on calcification.
Citation:Kaniewska P, Campbell PR, Kline DI, Rodriguez-Lanetty M, Miller DJ, et al. (2012) Major Cellular and Physiological Impacts of Ocean Acidification on a Reef Building Coral. PLoS ONE 7(4): e34659. doi:10.1371/journal.pone.0034659
Editor:Wei-Chun Chin, University of California, Merced, United States of America
ReceivedSeptember 19, 2011;AcceptedMarch 6, 2012;PublishedApril 11, 2012
Copyright:ß2012 Kaniewska et al. This is an open-access article distributed under the terms of the Creative Commons Attribution License, which permits unrestricted use, distribution, and reproduction in any medium, provided the original author and source are credited.
Funding:This work was supported by the Australian Research Council Centre for Excellence for Coral Reef Studies. The funders had no role in study design, data collection and analysis, decision to publish, or preparation of the manuscript.
Competing Interests:The authors have declared that no competing interests exist.
* E-mail: [email protected]
.These authors contributed equally to this work.
¤ Current address: Australian Institute of Marine Science, Townsville MC, Queensland, Australia
Introduction
Coral reefs are highly productive and biologically diverse ecosystems despite the oligotrophic waters that surround them [1]. They are important to millions of coastal dwelling people across the planet, underpinning industries such as fishing and tourism [2]. Coral reefs appear to be facing a significant increase in local and global stressors [1,3]. Global warming and ocean acidification have recently emerged as key threats to the long-term survival of coral reefs. Rapidly warming oceans are driving an increase in the frequency and intensity of mass bleaching events [3], while steadily acidifying oceans have caused large decreases in the concentration of carbonate ions and potentially the ability of marine calcifiers to precipitate calcium carbonate [4].
High levels of atmospheric CO2 ([CO2]atm) and subsequent ocean acidification have been implied as a major factor in several extinction events on coral reefs in geological time [5]. The ocean uptake of [CO2]atm produces carbonic acid (HCO3 2) as the carbon dioxide reacts with water. Protons (H+
), which are formed due to the resulting dissociation of carbonic acid to bicarbonate ions (CO322), react with carbonate ions, forming more HCO32
and thus reducing carbonate ions available for marine organisms
[6]. This decrease in [CO322] leads to a reduction in the
understand the full ramifications of rapid ocean acidification for coral reefs. Here, we investigate what physiological processes in Acropora milleporaare affected by changes in ocean pH, both at the level of the phenotype and gene expression level and show that
exposure to high CO2 drive major changes in gene expression,
respiration, photosynthesis and symbiosis for the reef building coral.
Results and Discussion
In a study of 8606 unigenes from the coralAcropora millepora exposed to ambient, mid and high CO2conditions as predicted by the IPCC (Table 1), we report that increases in dissolved CO2after 1 and 28 days affected processes including: metabolism, mem-brane-cytoskeleton interactions, signaling, translation, transport, calcification, protein folding and apoptosis (Figure 1, Table S1). In total, acidification resulted in 643 differentially expressed tran-scripts (FDR, 5%); the largest number of these differentially
expressed genes are up or down regulated in the high CO2
treatment compared to the control at day 28. This was also reflected in principal component analysis which showed that high
CO2 corals at day 28 where separated from the other samples
implying the greatest variation (Figure S1). Differentially expressed genes were subjected to K-means clustering in order to group genes with similar temporal expression patterns and we identified 6 major synexpression clusters (I–VI) (Figure 1). Transcripts with homology to known genes (352 transcripts, Blastx, E-score cutoff
1026) were assigned to gene ontology (GO) categories and
subjected to classification analysis to identify enriched GO groups (Figure 2). From the pie charts in Figure 1 which show what major GO categories genes in the synexpression clusters belong to, it is apparent that more changes in cytoskeleton interactions occur in cluster IV, more changes in signaling and catalysis occur in clusters I–III and large changes in transport occur in cluster II. Quantitative real-time PCR of ten representative genes supported the results, where each candidate gene in the qPCR followed the trends found in the microarray data with expression levels either
increasing or decreasing in response to high CO2 conditions
(Figure 3, Table S2, S3) compared to control corals at day 28. Changes in response to high and mid CO2conditions for day 1, where less gene expression changes occurred, contained many changes in heat shock proteins and signaling which differed from changes at day 28 (Table S1). However, this study only had a single time point at a shorter time scale. It would be useful in future studies to better define changes in gene expression levels within the first few days of exposure, which would require an experiment with several time points within these first few days. It should be noted that this study used small sample sizes (n = 3 for microarray analysis and n = 4 for physiology and qPCR) and that future studies would benefit from greater sample sizes, perhaps a
greater range of differentially expressed genes would be detected, and more robust conclusions drawn from the physiological data.
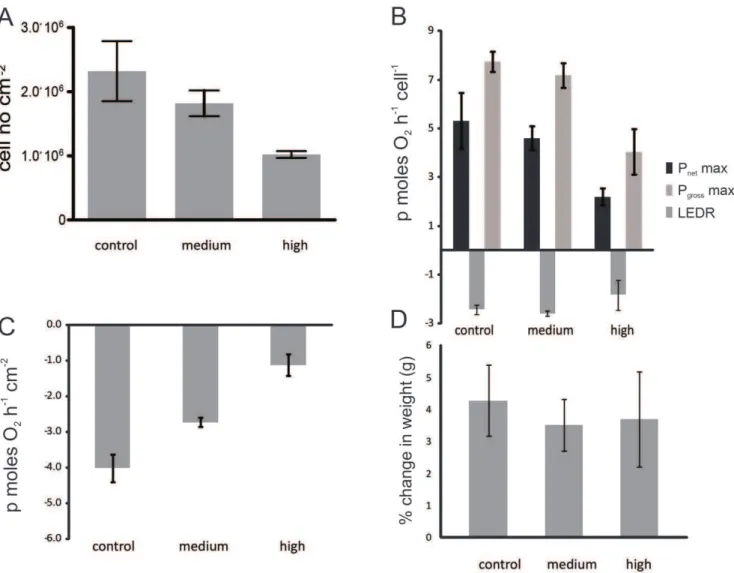
Changes at the mRNA level, where the majority of differentially expressed genes were found at day 28 in the high CO2treatment, were confirmed by physiological measurements (Fig. 4).Acropora milleporabranches lostSymbiodiniumcells in response to changes in
ocean chemistry, (Figure 4A; Kruskal Wallis test, H
2,12= 7.54,p = 0.023), where after a 28 day exposure,Symbiodinium
populations in the high CO2 treatment were reduced
(1.02610665.346104) to less than half the density compared to
control branches (2.3610664.686105) (Figure 4A). The
remain-ing symbiont cells also became less productive and the photosyn-thetic capacity (as measured by Pnetmax cell2
1
and Pgross max cell21) was reduced. There was a 60% reduction (Kruskal Wallis test, H 2,12= 8.34, p = 0.015) in Pnet max cell2
1
and a 50% reduction (Kruskal Wallis test, H2,12= 7.73, p = 0.021) in Pgross
max cell21 (Pnet max2LEDR) in the high CO2 treatment
compared to the control (Figure 4B). Decreasing rates of gross
photosynthesis per Symbiodinium cell, compounded by reduced
Symbiodiniumpopulations, may lead to a reduction in photoassimi-lates translocated to the host coral. These changes are likely to have long-term negative effects on host growth and fecundity, with the prospect of increased susceptibility to disease and mortality, especially ifSymbiodinium populations fail to recover rapidly [14]. The observed decrease in Pgross max is consistent with previous acidification studies [11,15]; however, in our study there was no
change in LEDR per remnant Symbiodinium cell among CO2
conditions (Kruskal Wallis test, H2,12= 1.65, p = 0.437). This may be due to the application of very different light conditions to Crawley et al [15] which exposed coral to sub-saturation light intensities and only had a short experimental time scale. More importantly, there was a 3-fold downturn in dark respiration per coral surface area (Figure 4C), (Kruskal-Wallis test, H2, 12= 6.71, p = 0.035), which is typically associated with a decline in host maintenance and/or growth [16]. Rapid growth, either as tissue growth or calcium carbonate deposition necessitates high respira-tion rates, but the observed reducrespira-tions in the rate of respirarespira-tion can suggest suppression of growth rates and/or metabolism. Physiological changes in this study preceded any observable changes in calcification/growth as determined by changes in buoyant weight, as there was no difference in branch calcification/ growth rates between the 3 treatments after the 28 day incubation (Kruskal Wallis test, H2,12= 0.50, p = 0.778) (Figure 4D), despite the downturn in both energy production and respiration observed in the high CO2treatment. This result may reflect that in this case, observable effects on calcification/growth rates require longer experimental incubation, as the buoyant weight technique may be too insensitive to measure the potential small changes in calcification/growth that may have occurred.
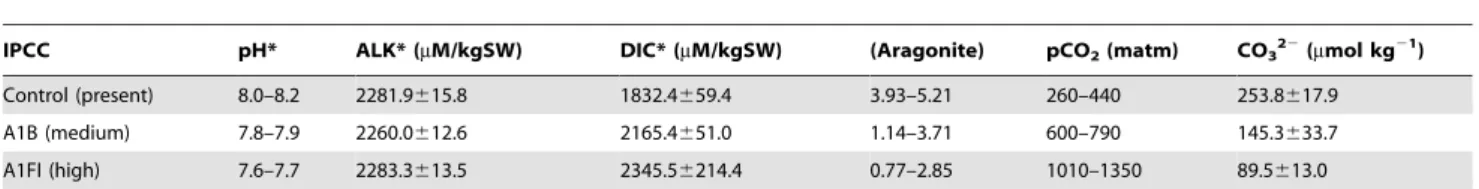
Table 1.Carbonate chemistry parametersaacross experimental conditions.
IPCC pH* ALK* (mM/kgSW) DIC* (mM/kgSW) (Aragonite) pCO2(matm) CO322(mmol kg21)
Control (present) 8.0–8.2 2281.9615.8 1832.4659.4 3.93–5.21 260–440 253.8617.9
A1B (medium) 7.8–7.9 2260.0612.6 2165.4651.0 1.14–3.71 600–790 145.3633.7
A1FI (high) 7.6–7.7 2283.3613.5 2345.56214.4 0.77–2.85 1010–1350 89.5613.0
*Measured values.
aParameters were calculated from measured values of pH, total alkalinity (ALK), dissolved inorganic carbon (DIC), temperature (25
6C) and salinity (35 ppm), using the program CO2SYS.
doi:10.1371/journal.pone.0034659.t001
Metabolism
Changes to metabolic rates are a common outcome of environmental stress [17]. Changes in gene expression suggest thatAcropora milleporamay have reduced its metabolism under high
CO2conditions at day 28 (Figure 1 cluster IV–VI, Figure 2, Table S1), mirroring the oxygen flux change (Figure 4). There was an overall down-regulation of genes involved in the tricarboxylic acid (TCA) cycle and the mitochondrial electron transport chain (Table
Figure 1. Graphical representation of differentially expressed genes inAcropora milleporaacross pCO2treatments (control, medium
and high) at day 1 and 28.K-means clustering was applied to group genes (synexpression clusters I–VI) by common temporal expression patterns. Yellow represents upregulation and blue represents downregulation, scale bar is on a log2ratio. Each row corresponds to a transcript and each column represents the mean expression (n = 3). For each cluster average log2fold changes (6SE) at day 28 are indicated and pie charts classify genes into major biological processes according to enriched GO categories.
S1), indicating reduced oxidative metabolism and capacity to generate ATP and NADPH. There was also an upregulation of triglyceride lipase and Acyl-CoA dehydrogenase (Figure 1 cluster I, II, Table S1), which may point to an increase in the breakdown of lipids for energy use [18,19]. Interestingly, there was an increase in mitochondrial transcripts for ATPase (Figure 1 cluster II, Table S1). Cellular apoptosis is often preceded by an increase in mitochondrial ATPase activity, resulting in an influx of potassium, the activation of caspases and ultimately cell death [20]. Metabolic suppression has
been shown in a range of marine organisms in response to CO2
fluctuations [13,21]. The majority of energy needs in tropical reef building corals are supplied by the photosynthetic endosymbionts [22], but host heterotrophy can occasionally meet host requirements [23]. Depressions in aerobic metabolic activity due to mitochondrial disruptions can undermine the viability of host cells regardless of the trophic source of organic carbon supplied into the TCA cycle. In this particular case, metabolic suppression due to acidosis is likely to have long-term fitness costs.
Acid-Base Regulation and Ion/Macromolecule Transport Maintaining pH homeostasis is critical to a range of cellular functions [24]. Studies of acid-base regulation and hypercapnia suggest significant physiological challenges for marine fish and worms [13,25]. There are cases where mitochondrial energy
production is tied to acid-base regulation through HCO32
transport [26], bi-direction H+ pumping by F
0F1 ATPase [20], or Na+/H+and Cl2/HCO
32transporters on the cell membrane [25]. Membrane proteins play an integral role in: pH homeostasis of the cell, membrane lipid composition and cell shape maintenance [27]. ForA. millepora, 28 days of high CO2conditions resulted in changes in membrane transporters (Figure 1, 2, Table
S1). Specifically, there was downregulation of proton channels (V-type proton ATPases), phosphate transport and protein transport at the cell membrane (Figure 1 cluster IV,V, Table S1). At the same time, sodium and potassium transporters, cell membrane receptors and an ABC transporter were upregulated (Figure 1 cluster I, Table S1). In eukaryotes, ABC type transporters are involved in the export of unwanted molecules, such as toxins [28] from the cell. V- type proton ATPases at the cell membrane serve to acidify the extracellular environment which in turn activates a series of signaling cascades [29]. In the cnidarian ectoderm,
plasma membrane proton ATPase activity has been tied to CO2
uptake [30]. A decrease in this transporter may indicate a decrease
in CO2 uptake under acidification stress. Due to concurrent
increases in energy saving ion gradient transporters such as Na+ / H+
exchangers, the decrease in V- type ATPases for proton transport may also be the result of an active suppression of the more costly ATP dependent ion transporters [31]. In addition, a lipid transporter was upregulated in the high CO2treated corals at day 28 (Figure 1 cluster II, Table S1), a change not found in acid base regulation of other marine organisms [13,21,25], perhaps implying changes to the lipid configuration of the cell membrane as a response to ocean acidification [32].
Stress Response Mechanisms
Abiotic changes are likely to elicit a cellular stress response (CSR), a universally conserved mechanism to protect macromol-ecules within cells from the potential damage that physical, chemical or biological stressors may cause. The CSR can increase the tolerance temporarily to the stressor, and remove already damaged cells through apoptosis [33]. Transcripts ofA. millepora that encode a number of cellular defenses, and transcripts involved
Figure 2. Classification analysis for Acropora millepora transcripts that were differentially expressed across pCO2 treatments
(control, medium and high) at day 1 and 28.Gene enrichments (P,0.05) across GO categories are shown. The program GOEAST was used to test for enriched GO categories among differentially expressed genes. Color scheme indicates parent categories (binding, actin cytoskeleton, catalytic activity, metabolic processes and transporter activity) and individual pie segments are annotated for more specific GO categories. The sizes of the pie segments are proportional to the total number of genes enriched. The proportion of differentially expressed genes which were assigned to gene ontology categories was 55%.
doi:10.1371/journal.pone.0034659.g002
in maintenance of protein integrity (molecular chaperones) were downregulated (Figure 1 cluster V, Table S1), whilst genes, protecting the cells against oxidative stress through oxidoreductase activity (eg. Catalase, FAD linked oxidase and selenoprotein [34,35,36]) and involved in apoptosis (caspase 3, TRAF3, p53 inducible protein 11 and programmed cell death protein 4 [37,38,39]), were upregulated in high CO2treated corals at day 28 (Figure 1 cluster I, II, III, Table S1). Bcl-2, MALT1 and API-5, potential inhibitors of apoptosis [40,41,42] were downregulated (Figure 1 cluster V, Table S1). The upregulation of apoptotic transcripts is consistent with the upregulation of mitochondrial ATPase described above, which together point to disruption in the mitochondrion leading to cell death [20]. An increase in apoptosis
may reflect that prolonged environmental stress, and either a lack of cell pH homeostasis or elevated maintenance costs, has resulted in cell damage. The loss ofSymbiodiniumcells and an increase in transcripts alleviating oxidative stress may point to impairment in the photosynthetic apparatus in the dinoflagellate symbiont or an impairment of the coral mitochondria [14]. This, in turn, would increase the presence of oxygen radicals in the host tissues and imply cell damage potential. The fact that high CO2 conditions resulted in overall downregulation of protein folding transcripts, may be a sign that the coral tissue may no longer have the capacity to maintain these integral services. Interestingly, at day one of the
high CO2 treatment there was an upregulation of Heat shock
protein 40, a change not found at Day 28 (Figure 1 cluster II,
Figure 3. Log2relative expression of selected genes using quantitative real-time PCR.Expression levels of genes are plotted as ratio of
relative expression of high CO2corals versus control corals at day 28. The relative expression for these selected genes was normalized to AdoHcyase and Rbl7. Bars represent standard error of the mean (n = 4).
Table S1). It must be noted however, that the two other main heat shock proteins (hsp) were not differentially expressed between treatments (hsp 70 and 90) but were maintained at a high expression levels, and their presence may be sufficient for the integrity of newly made proteins. Calnexin and alpha mannosidase transcripts were upregulated (Figure 1 cluster II, Table S1) which would increase the quality control and protein folding ability in the endoplastic reticulum for proteins that will then be further transported to the golgi complex [43,44]. It is possible that the other downregulated chaperones could be temporarily reduced while awaiting more favorable environmental conditions. A coral c-type lectin, which is involved in innate immunity in corals [45] was downregulated (Figure 1 cluster V, Table S1) under high CO2 conditions, indicating that this cell stress response may not be responding appropriately, and this decrease may compromise the coral further as in a stressed holobiont, susceptibility to pathogens may increase [46].
Ca2+Ion Binding/Transport and Cell Communication Several calcium (Ca+
) ion binding proteins were downregulated in high CO2treatments at day 28 (Figure 1 cluster IV, V, Table
S1). Transcripts for calcium-binding receptors that are potentially involved in innate immunity [47,48] were also suppressed, implying an adverse change in signaling potential at the cell membranes. Downregulation of calmodulin, FKBP12 and EGF-hand proteins also implies potential disruption in cell calcium homeostasis [49,50,51], as these calcium binding proteins control the Ca2+
release from ryanodine receptors (RyR) within the endoplasmic reticulum (ER), which is an intracellular Ca2+
storing organelle [49,50,51,52]. Calpain, an important Ca2+ activated protease that has roles in membrane-cytoskeleton interactions, signal transduction, cell differentiation and apoptosis [53], was upregulated. Changes in these calcium binding proteins indicate that certain signaling pathways may have been altered.
Membrane-Cytoskeleton Interactions
Exposure to high seawater CO2 concentrations for 28 days
resulted in several differentially expressed genes involved in membrane-cytoskeleton interactions and cytoskeletal remodeling (Figure 1, 2, Table S1). It is possible that the change in regulation of these transcripts reflects a change in proteins involved in cytoskeletal interactions, cytoskeletal organization, intracellular
Figure 4. The effect of increasing CO2 in seawater (control, medium and high) after 28 days on coral-algal physiology. (A) Symbiodiniumcell number in reef-building coral,Acropora millepora(B) photosynthetic capacity per symbiont cell measured as Pnet max, light enhanced dark respiration (LEDR), and Pgrossmax (Pnetmax2LEDR) (C) dark respiration(Rdark) and (D) relative calcification/growth as % change in weight (g) of coral branches over the 28 day experimental period. Error bars represent the standard error of the mean (n = 4).
doi:10.1371/journal.pone.0034659.g004
transport, cell shape integrity and cell motility [54,55] [55]. Specifically, there was downregulation of cytoskeletal actin 1, centractin, radixin and coatomer epsilon subunit and radixin (Figure 1 cluster IV, V, Table S1), whilst there was upregulation of tubilin and Lgl tumor suppressor unit (Figure 1 cluster I, II, Table S1). The actin cytoskeleton is important in a diverse range of processes such as cell motility, contractibility, mitosis and cytokinesis, intracellular transport, endocytosis and secretion. In addition, it has been suggested that actin is also involved in regulation of gene transcription through changes in the cytoskel-etal actin dynamics or assembly of transcriptional regulatory complexes [55]. Actin is also an important part of the nuclear complex being required for the transcription of RNA polymerases and is also involved in the export of RNAs and proteins from the nucleus [55]. It is possible that the downregulation of cytoskeletal actin in high CO2conditions reflects a change in the regulation of gene transcription of proteins involved in cytoskeletal interactions. In addition this downregulation can imply changes in the intracellular transport, plasma membrane interactions and cell shape/integrity. There was also an upregulation of alpha tubilin, which forms a constituent of the microtubule filaments, involved in cytoskeletal organization and vesicle transport. Downregulation of coatomer epsilon subunit implies changes in protein trafficking between the endoplasmic reticulum and the Golgi complex, while upregulation of Lgl tumor suppressor unit indicates changes to events controlling cell polarity [56,57]. Cell volume control changes have been recorded in other marine organisms such as crabs in response to hypercapnia [58], and similar changes may be occurring in the stressed coral cells. The downregulation of Radixin, an important protein involved in linking the plasma membrane to the cytoskeleton using actin rich surfaces [59], supports the downregulation of cytoskeletal actin. Centractin, or Actin Related Protein 1 (ARP1), was also downregulated under
higher CO2 stress, and this is an important activator of
cytoplasmic vesicle movement [60]. In contrast, at day one in high CO2 stressed corals, there was an upregulation of Radixin and Centractin, or Actin Related Protein 1 (ARP1) (Figure 1 cluster VI, Table S1), indicating that different changes in cytoskeletal interactions were occurring at this stage. The cytoskeleton has profound effects on the plasma membrane. At times, there may be uninhibited lateral diffusion of lipids and proteins across the plasma membrane; the influx of these molecules can be regulated by the membrane-cytoskeleton links. These become obstacles to free diffusion through diffusion-limited lipid domains [54]. It may be that changes in these membrane-cytoskeleton links in this study reflect changes in transport across the membrane.
Rab/Ras GTPases
Exposure to increased CO2concentrations for 28 days lead to an up (Figure 1 cluster II, Table S1) and downregulation (Figure 1 cluster V, Table S1) of transcripts that resemble members of the Rab/Ras GTPases families (small G-proteins). The Ras GTPase superfamily is a small monomeric group of GTPases, which are involved in cell proliferation and cell signaling events in response to external stimuli. Disruption of the Ras signaling pathway is a key component in the progression of tumor growth [61]. The Rab GTPase family is part of the Ras GTPase superfamily and plays a key role in many membrane-trafficking events in eukaryotic cells, such as exocytosis. This group of proteins which tightly associates with the cell membrane is involved in transport vesicle formation, actin and tubilin motility, docking and membrane fusion. Rab proteins are active when bound to GTP and are inactive when bound to GDP [62,63]. In its active state, the Rab protein
regulates the transport of lipids and proteins between distinct membrane bound organelles through interactions with down-stream effector proteins which are recruited onto the membranes [63]. Small G-proteins are implicated in most cellular events where plasma membrane-cytoskeleton interactions or plasma membrane shape changes (plasma membrane deformations) occur. The observed upregulation in members of these small monmeric GTPases most likely reflects changes in the cell membrane and cytoskeletal interactions to accommodate changes in external seawater chemistry.
Extracellular matrix
Changes in the extracellular matrix (ECM) have previously been implied to potentially affect calcification [34,36]. Our expression patterns indicate that only two transcripts encoding previously described ECM proteins changed after 28 days under
mid CO2exposure. SEC13L1 was upregulated (Figure 1 cluster
III, Table S1) while peroxidasin was downregulated (Figure 1 cluster IV, Table S1). At day 28 under high CO2exposure, there was also a downregulation to a predicted protein in the extracellular matrix (Table S1). This implies that small changes to calcification may have started occurring and that perhaps with a longer experimental incubation time more ECM and calcification related transcripts would have been differentially expressed. This overall supports our findings at the phenotype level where no change in calcification/growth was found (Figure 4). Overall in this study there were fewer changes in transcripts which may be involved in calcification, in response to ocean acidification, compared to gene expression studies with corals exposed to thermal stress where changes to the following transcripts were
observed; collagen a-1, ECM matrix metalloprotease, papilin,
carboxypetidase inhibitor SmC1, procollagen, galaxin and SCP-like extracellular protein [34,36].
Cell-wide Responses by Corals to Ocean Acidification: A Model
To highlight the differences between acidosis which may be a factor in this study from the impact of hypercapnia seen in other marine organisms, we purpose a model (Figure 5) of cell-wide, coral host response to high CO2stress. This model attempts to account for the classic acidosis response (acid-base regulation and metabolic depression) and the novel responses observed in the studied coral (apoptosis, signaling events, calcium homeostasis, cytoskeletal remodeling, cytoskeletal-membrane interactions and oxidative stress). The coral specific responses may result from increased reactive oxygen species (ROS) and/or increased reactive nitrogen species (RNS) created from a disturbance in the Symbiodinium cell, the host mitochondria, or both [14,34]. Upregulation of catalase, FAD-linked oxidase and selenoprotein indicates that there may be an increased amount of ROS in the coral cells [64,65]. Increased ROS/RNS can result in a disruption to the calcium homeostasis [34]. The role of internal [Ca2+
] increase in coral bleaching has been suggested previously [34]. The downregulation of calmodulin (CaM), FKBP12 and EF-hand
proteins under high CO2 stress indicates that there may be a
disruption to the Ca2+homeostasis [49,50,51]. Modifications of the actin cytoskeleton, membrane-cytoskeleton interactions and cell receptor/adhesion properties will be affected by a disruption
in Ca2+ homeostasis and metabolic suppression [34,66]. Both
oxidative stress and an increase in intracellular Ca2+
that similar cellular events are occurring under acidosis induced bleaching to those reported for thermally induced bleaching [14,34,36], but with the addition of changes to acid-base regulation and mitochondrial ATPase activity.
On our present greenhouse trajectory, we are likely to use all the
.4000 Gt of carbon present in the global fossil fuel reserves by 2400. This will significantly acidify the oceans for thousands of years [69] and take them to a point not seen in tens of millions of years [70]. Our study highlights the imperative to investigate the impacts of ocean acidification on processes other than those involved in biomineralisation. Also, there is a need for more studies investigating the effects of naturally occurring changes in pCO2on marine calcifiersin situ. This is a priority, if we are to
understand the fate of the many supporting roles that corals contribute to the maintenance of coral reefs.
Materials and Methods
Experimental Design
A total of 20 branches (7–8 cm long) were collected from 4 healthy colonies of the reef building coral Acropora millepora on Heron Island Reef flat (23 339S, 151 549E), Great Barrier Reef, Australia. Coral branches were affixed onto cut 15 mL falcon tubes using Selleys Knead It Aqua (Padstow, Australia) and Selleys autofix super glue (Padstow, Australia). The affixed branches were then placed onto a rack which was deployed back to the Heron
Figure 5. A proposed model of cellular events occurring as a result of ocean acidification.These changes lead to compromised health in
Acropora millepora(reduction in symbiont cells and decreased photosynthesis and respiration). The schematic depicts an endodermal cell which contains the symbiont cell. Cellular events depicted here are likely to also occur in other cell types which do not contain symbionts, especially the acid base changes at the cell membrane. Changes in carbonate chemistry lead to changes in acid base regulation and cell membrane transporters. Acid base regulation may not be sufficient leading to acidosis within the cell. This could increase reactive oxygen species (ROS) due to a disruption (q) in theSymbiodiniumcell (S) and/or in the coral host mitochondrion (M), which may also produce reactive nitrogen species (RNS). The overall oxidative stress and a disruption to calcium stores at the endoplasmic reticulum (ER) can lead to calcium imbalance. This in turn leads to events such as changes in the extracellular matrix, cytoskeletal remodeling, changes in cytoskeletal interactions, disruption to cell reception and signaling potential, and an increase in cell death. Moreover disruption in both the host mitochondrion and Symbiodiniumcell leads to a decrease in metabolism and a decrease in metabolite transfer from the symbiont cell. In addition the disruption in the host mitochondrion can also lead to cell death. For the cell membrane transporters black arrows indicate upregulation and white arrows indicate downregulation.
doi:10.1371/journal.pone.0034659.g005
Island reef flat, where they remained for 4 weeks, exposed to natural light and flow regimes in order to recover from handling. Following this acclimation period they were transferred to aquaria with running seawater and under ambient light (with shade cloth see below) and ambient temperature (26uC) conditions for 10 days. For each treatment there were four randomly distributed aquaria and for eachA. milleporacolony, branches were evenly distributed across treatments, with 6 branches per colony in each of the treatment tanks (ambient, mid and high – see below). Branches were designated to be used either for respirometry assays and physiology measurements or microarray analysis. The experiment was run for 28 days and coral branches were sampled, snap frozen in liquid nitrogen and stored at280uC for later analysis at time zero, day 1 and day 28. For each time point, two branches per colony were sampled and one branch was used for physiology and one branch was used for genomic analysis.
The experimental set up consisted of 12 (4 aquaria per treatment) flow-through aquaria (80 L) under natural light and a layer of shade cloth which resulted in photosynthetically active radiation levels of a maximum of 859.6mmole quanta m22s21 and a daily average level of 433.668.6mmole quanta m22s21for the light period of the day. Aquaria were supplied with unfiltered seawater which was being pumped straight from the reef flat on Heron Island into CO2mixing tanks, and then distributed across aquaria. The control aquaria were receiving seawater from the Heron Island reef flat where the natural diurnal variability in pH ranged between 8.0–8.2 due to tidal changes and metabolic activity on the reef flat, which corresponded to a pCO2range of
260–440 ppm. The pCO2 ranges in the two acidification
treatments were controlled by a CO2 dosing control system
(Aquacontroller III, Neptune Systems, Carlsbad, CA, USA) which used pH readings in the large 300 L CO2mixing tanks, to either open or close solenoid valves (Dupla Australia, Littlehampton, Australia) and would control the amount of CO2being added to the mixing tanks. The medium CO2treatment was controlled to a pH target of 7.8–7.9 corresponding to 600–790 ppm. The high
CO2 treatment was targeted to a pH range of 7.6–7.7
corresponding to 1010–1350 ppm. Temperature, pH and light levels were recorded throughout the experiment and total alkalinity across control and CO2treated aquaria was determined with a Mettler Toledo T50 automated titrator, with 0.1 M HCl and 130 g seawater samples using the Gran titration method in a two-stage, potentiometric, open-cell titration following the method of [71]. Acid concentrations and the alkalinity measurements were calibrated at the beginning of each run using Dickson certified reference sea water standards (Andrew Dickson, SIO, Oceanic Carbon Dioxide Quality Control). Dissolved Inorganic Carbon (DIC) was sampled into 50 mL glass vials after filtering with a
0.45mM syringe filter, fixed with 15mL saturated mercuric
chloride and then sealed with a rubber lid and aluminum cap (Wheaton, USA). DIC samples were then run on a custom DIC system with a LICOR gas analyzer (Rob Dunbar lab, Stanford, USA) with a Dickson sea water reference run every 7 samples. Carbon species concentration and aragonite state were determined for each treatment using the CO2SYS program using the dissociation constants from [72] and refit by [73] using TA, DIC, pH, and temperature measurements [74].
Respirometry Measurements
Coral branches designated for physiological measurements were used for respirometry assays. The coral branches were dark adapted for at least an hour before respirometry assays, which were performed after dusk. Branches were placed in 70 cm3clear acrylic chambers with an inserted optode sensor connected to an
Oxy4 v2 system (PreSens, Regensburg, Germany). The chambers were placed within an acrylic container (on top of a magnetic stirrer), which was connected to a water bath keeping the temperature constant throughout the assays at 26uC, the ambient water temperature at Heron Island during the course of the experiment. Chambers were filled with seawater from respective experimental treatments in the aquaria. Photosynthesis vs irradiance curves (P-E curves) were conducted by using the actinic light source of an imaging pulse amplitude modulation fluorom-eter (iPAM, Walz, Effeltrich, Germany), and exposing coral
branches in chambers to 0, 10, 20, 55, 110, 925mmol quanta
m22s21for 10 min and then followed by exposure at 1075 and
1250mmol quanta m22s21 for 5 min each, and the run was
concluded by a 10 min incubation at 0mmol quanta m22s21. Respirometry rates were normalized to cell number and coral surface area. The exposure to different light levels enabled the calculation of P-E curve parameters [75] following methods in [15]; dark respiration (Rdark) estimated from the initial 10 min dark incubation, sub-saturation photosynthetic efficiency (a)
derived from the regression line slope of the low irradiance levels (10, 20,55, 110mmol quanta m22s21) in relation to the estimated Ek, photosynthetic capacity (Pnet max) was estimated as the greatest rate of oxygen evolution at the high irradiance levels (925, 1075, 1250mmol quanta m22s21), and finally light-enhanced dark respiration (LEDR) was determined from the oxygen consumption in the last dark incubation post irradiance exposure.
Population Density and ChlorophyllaContent of Symbiodinium
The cell density and pigment content of Symbiodinium were
measured by removing tissue from coral fragments by air-brushing frozen fragments in 5 mL 0.06 M phosphate buffer (pH 6.65). The homogenate was centrifuged at 40006g for 5 min. The supernatant was removed and the remaining dinoflagellate
pellet was re-suspended in filtered seawater (0.45mm) and
separated into aliquots that were used for pigment quantification andSymbiodinium cell counts.Symbiodinium pigment quantification aliquots were centrifuged at 40006g for 5 min, the supernatant
was removed and 1 mL of 100% cold methanol was added to the pellet. The solution was sonicated on ice cold water for 10 min and then centrifuged at 40006g for 5 min. The supernatant was
collected and transferred into a tube. This process was repeated until complete pigment extraction was achieved (when the final supernatant was clear). The total final extracted solution was filtered (0.45mm) and used for pigment separation in a Shimadzu SCL – 10 HPLC linked to a Shimadzu SPD – M10A photodiode array detector, using the column and method described in [76] with solutions A (methanol: acetonitrile: aquose pyridine, 50:25:25 v:v:v) and B1 (methanol: acetonitrile: acetone, 20:60:20 v:v:v). A standard for methanol extracted pigment chlorophyllawas used for quantifying pigments and normalized on a per cell basis. Symbiodinium cell counts were estimated using eight randomly selected replicates counted using a haemocytometer (Boeco, Germany) on a Zeiss standard microscope; the counts were normalized to coral surface area in cm2, as obtained by dipping coral fragments into paraffin wax following the method of [77].
Coral Growth Rate Estimation
subtracting the initial weight (g) from the final weight (g) and converting this to a percent change in weight over the course of the experimental period.
Statistical Analysis
All data were tested for normality and homogeneity of variance and where assumptions were violated, the data were corrected by transformations. Non-parametric equivalents of tests were used in cases where assumptions were violated despite transformations. A Kruskal Wallis test was used to determine the effect of changes in CO2concentrations onSymbiodiniumdensity, branch calcification/
growth, Pnet max, Pgross max, LEDR and Rdark. To test for
significance on the expression levels of mRNAs from quantitative real time PCR between control and high CO2levels, for each gene a Welch t-test was used. All statistical analyses were performed using STATISTICA 7.0 (Statsoft Inc., Tulsa, USA).
Microarray Description
The microarrays used in this experiment were printed at the Adelaide Microarray Facility (Australia) and consisted of 18,432 spots derived from the same amount of cDNA clones, including 290 spots representing positive and negative control and representing 8606 unigene clusters [79]. These microarrays are
the 3rd generation cDNA microarrays designed for Acropora
millepora [80]. The selection of clones, methodological approach for the cDNA library construction and the fabrication of microarrays are explained in [81].
Hybridization of Arrays
Total RNA was extracted from each sample using Trizol (Invitrogen) following manufacturer’s instructions. The integrity and quality of total RNA was assessed using a Bioanalyzer (Agilent Technology). Only samples showing intact RNA (RNA Integrity
number .8), were used for probe construction. cDNA probe
synthesis was performed from 1000 ng total RNA using Superscript Reverse Transcriptase (Invitrogen) and a 2 pmol Genisphere 900 3DNA Dendrimer from a Genisphere 3DNA-900 microarray kit according to the manufacturers’ instructions. We used a reference two-colour microarray design, where, for each array, the sample was labeled with Cy5 and the reference, consisting of pooled RNA from control treatments and time zero, was labeled with Cy3. In total, 27 arrays were hybridized, as each array represented a sample from a treatment and a time point (n = 3), only 3 out of the 4 colonies were used for microarray hybridization. Microarrays were pre-hybridized and hybridized with the labeled samples using the Genisphere 3DNA-900 microarray kit following the manufacturer’s instructions and using a dynamic hybridization system (MAUI, BioMicro Systems). Prior to and post hybridization, the microarray slides were washed three
times (wash 1: 26SSC 0.2% SDS at 65uC for 15 min, wash 2:
26SSC at room temperature for 10 min, wash 3: 0.26SSC at
room temperature for 10 min). Slides were scanned using a
GenePix H 4200 scanner (Axon Instruments) and image
acquisition was performed using the software GenePix H Pro 5
(Molecular Devices, CA, USA).
Microarray Analysis
Normalization and data analysis of acquired array slides was performed using R (R Development Core Team, 2008) and the limma package [82]. The details for the methodology of analyzing differential gene expression using empirical Bayes shrinkage of variance and linear regression models can be found in [83]. Normexp (75) corrected signal intensities were used, as it has been
shown to be a well performing background correction method, which best stabilizes variance as a function of intensity, compared to more standard and common methods [84]. Print-tip loess normalization was applied within slides [85] while scale normal-ization was applied between slides, in order to ensure that distributions were similar between arrays. Both normalization procedures equalize for differing amounts of host RNA input [36]. Effectiveness of normalization procedures was verified through M (the log ratio of the spot fluorescence intensity) vs A (the log of the average spot fluorescence intensity) plots. Minimal or no fluorescence was observed for probes which contained salmon sperm DNA and primers, and should not hybridize, while controls which were expected to hybridize showed a range of fluorescence intensities. Differentially expressed genes were identified based on an assumed false discovery rate of 5% and sequence-wise p-values were adjusted through the Benjamini and Hochberg method [86]. Sets of contrast lists of differentially expressed genes between
control, medium and high CO2treatments at day 1 and day 28
were created (643 transcripts) (Table S1, Additional file 1), in addition contrast lists were created between groups of samples at t0 so that any potential differences due to ‘‘tank effects’’ could be subtracted from subsequent analysis; in total 3 genes were subtracted from subsequent contrast lists. Differentially expressed genes at day 1 and 28 were then assembled into 6 different clusters based on their temporal gene expression patterns, using K-means clustering analysis in the TIGR TMEV software [87], assuming that genes with similar cellular pathways share common temporal expression patterns. In addition Principal component analysis was also carried out in the TIGR TMEV software [87]. Differentially expressed genes which had homology to known genes (352 transcripts, Blastx, E-score cutoff 1026), were assigned to GO categories and subjected to classification analysis using the hypogeometric test and a false discovery rate of 5% in GOEAST [88] to identify enriched GO groups. Microarray data has been deposited in the Gene Expression Omnibus Database (GSE28697).
Validation by Quantitative PCR
Expression patterns of candidate genes from each functional group of coral genes differentially expressed in response to
increased CO2 treatment (sodium and chloride transporter, V
type ATPase, vitellogenin, catalase, caspase 3, calmodulin, cytoskeletal actin, pyruvate dehydrogenase, G protein and rab protein) were validated through quantitative Polymerase Chain Reaction (qPCR). Total RNA (1000 ng) was reverse transcribed with a Superscript Vilo cDNA synthesis kit (Invitrogen) following manufacturer’s instructions. Specific primers amplifying approx-imately 100–200 bp PCR products were designed for the genes (Table S4) chosen to be validated from the microarray data. Transcript levels were determined by qPCR using the Corbett Rotor Gene 6000 thermal cycling system (Qiagen), following the manufacturer’s instructions (Qiagen, CA, USA) and PCR conditions (95uC for 10 min, followed by 40 cycles of 95uC for 15 sec and 60uC for 1 min). Triplicate first strand diluted 1:10 cDNA aliquots (1mL) from each sample were used in 20mL PCR
reactions with 2mM primers and a SYBR Green PCR master mix
using the qPCR primers and cDNA and genomic DNA from Symbiodinium sp. as a template to ensure no amplification. The comparative delta CT method was used to determine relative quantities of mRNA transcripts from each sample. Each value was normalized to two reference genes adenosyl-homocysteinase (AdoHcyase) and ribosomal protein L7 (Rpl7). The selection of reference genes for this experiment was done by using a pool of reference genes (Table S4) and analyzing the expression stability using the GeNorm software [89]. For this study the most stable expression was found for adenosyl-homocysteinase (AdoHcyase) and ribosomal protein L7 (Rpl7) (M value = 0.253) and a minimum of two reference genes was recommended (V2/ 3 = 0.126). Relative expression values were for each gene were calculated by showing a ratio of treatment relative expression over control relative expression on a log2scale, which provides a similar appearance of up and down regulation [41].
Supporting Information
Figure S1 Principal component analysis of gene expres-sion for 3 acidification treatments; control (c), medium (m) and high (h) and 3 time points: T0 (t), day 1 (d) and day 28 (m).
(EPS)
Table S1 Annotated list of differentially expressed transcripts forAcropora milleporabetween CO2at day 1 and day 28 (from Additional file 1), as determined by empirical Bayes moderated statistics. Transcripts are assembled into 6 different clusters according to K-means clustering
and based on their temporal gene expression patterns. Annotations represent blastx, results with an E-score cutoff 1026.
(XLS)
Table S2 Summary of t-test with Welch’s correction results for candidate transcripts validating microarray results for control and high treatments at day 28 (n = 4). (EPS)
Table S3 Comparison of mean log2 fold changes for candidate transcripts from qPCR and microarray data analysis, at day 28 for high versus control corals. The correlation coefficient (R) is 0.93.
(EPS)
Table S4 List of candidate genes used in qPCR expression analyses.
(EPS)
Acknowledgments
We thank A. Forrest for critical discussions. Microarray data are Minimum Information About a Microarray Experiment (MIAME) compliant and deposited under accession number GSE28697 (National Center for Biotechnology Information GEO).
Author Contributions
Conceived and designed the experiments: PK DK MRL OHG. Performed the experiments: PK DK. Analyzed the data: PK PC SD. Contributed reagents/materials/analysis tools: PK PC OHG DM. Wrote the paper: PK PC SD OHG DK DM MRL.
References
1. Lough JM (2008) 10th
Anniversary review: a changing climate for coral reefs. Journal of Environmental Monitoring 10: 21–61.
2. Moberg F, Folke C (1999) Ecological goods and services of coral reef ecosystems. Ecological Economics 29: 215–233.
3. Hughes TP, Baird AH, Bellwood DR, Card M, Connolly SR, et al. (2003) Climate change, human impacts and the resilience of coral reefs. Science 301: 929–933. 4. Doney SC, Fabry VJ, Feely RA, Kleypas JA (2009) Ocean acidification:the other
CO2problem. Annual Review of Marine Science 1: 169–192.
5. Veron JEN (2008) Mass extinctions and ocean acidification: biological constraints on geological dilemmas. Coral Reefs 27: 459–472.
6. Kleypas JA, Buddemeier RW, Archer D, Gattuso JP, Langdon C, et al. (1999) Geochemical consequences of increased atmospheric carbon dioxide on coral reefs. Science 284: 118–120.
7. Hoegh-Guldberg O, Mumby P, Hooten AJ, Steneck RS, Greenfield P, et al. (2007) Coral reefs under rapid climate change and ocean acidification. Science 318: 1737–1742.
8. Cohen AL, McCorkle DC, de Putron S, Glenn GA, Rose KA (2009) Morphological and compositional changes in the skeletons of new coral recruits reared in acidified seawater: insights into the biomineralization response to ocean acidification. Geochemistry Geophysics Geosystems 10: Q07005. 9. Pandolfi JM, Connolly SR, Marshall DJ, Cohen AL (2011) Projecting coral reef
futures under global warming and ocean acidification. Science 333: 418–422. 10. Rodolfo-Metalpa R, Houlbre`que F, Tambutte E, Boisson F, Baggini C, et al.
(2011) Coral and mollusc resistance to ocean acidification adversely affected by warming. Nature Climate Change 1: 308–312.
11. Anthony KRN, Kline DI, Diaz-Pulido G, Dove S, Hoegh-Guldberg O (2008) Ocean acidification causes bleaching and productivity loss in coral reef builders. Proceedings of the National Academy of Sciences of the United States of America 105: 17442–17446.
12. Munday P, Dixon D, Donelson J, Jones G, Pratchett M, et al. (2009) Ocean acidification impairs olfactory discrimination and homing ability of a marine fish. Proceeding of the National Academy of Science USA 106: 1848. 13. Po¨rtner HO (2008) Ecosystem effects of ocean acidification in times of ocean
warming: a physiologist’s view. Marine Ecology Progress Series 373: 203–217. 14. Weis VM (2008) Cellular mechanisms of Cnidarian bleaching: stress causes the
collapse of symbiosis. Journal of Experimental Biology 211: 3059–3066. 15. Crawley A, Kline DI, Dunn S, Anthony KRN, Dove S (2010) The effect of
ocean acidification on symbiont photorespiration and productivity inAcropora formosa. Global Change Biology 15: 851–197.
16. Muscatine L, McCloskey LR, Marian RE (1981) Estimating the daily contribution of carbon from zooxanthellae to coral animal respiration. Limnology and Oceanography 26: 601–611.
17. Guppy M, Withers P (1999) Metabolic depression in animals: physiological perspectives and biochemical generalizations. Biological Reviews 74. 18. Grosser J, Schrecker O, Greten H (1981) Function of hepatic triglyceride lipase
in lipoprotein metabolism. Journal of Lipid Research 22: 437–442.
19. Thorpe C, Kim JJP (1995) Structure and mechanism of action of the Acyl-CoA dehydrogenases. The FASEB Journal 9: 718–725.
20. Matsuyama S, Reed JC (2000) Mitochondria-dependent apoptosis and cellular pH regulation. Cell Death and Differentiation 7: 1155–1165.
21. Todgham AE, Hofmann GE (2009) Transcriptomic response of sea urchin larvaeStrongylocentrotus purpuratusto CO2driven seawater acidification. Journal of Experimental Biology 212: 2579–2594.
22. Muscatine L (1990) The role of symbiotic algae in carbon and energy flux in reef corals. In: Dubinsky Z, ed. Coral Reefs Amsterdam: Elsevier. pp 75–87. 23. Grottoli AG, Rodrigues LJ, Palardy JE (2006) Heterotrophic plasticity and
resilience in bleached corals. Nature 440: 1186–1189.
24. Obara M, Szeliga M, Albrecht J (2008) Regulation of pH in the mammalian central nervous system under normal and pathological conditions: Facts and hypotheses. Neurochemistry International 52: 905–919.
25. Heisler N (1989) Interactions between gas exchange, metabolism and ion transport in animals: an overview. Canadian Journal of Zoology 67: 2923–2934. 26. Huertas IE, Colman B, Espie GS (2002) Mitochondrial-driven bicarbonate transport
supports photosynthesis in marine microalga. Plant Physiology 130: 284–291. 27. von Heijne G (2007) The membrane protein universe: what’s out there and why
bother? . Journal of Internal Medicine 261: 543–557.
28. Jones PM, George AM (2004) The ABC transporter structure and mechanism: perspectives on recent research. Cellular and Molecular Life Sciences 61: 682–699.
29. Hinton A, Sennoune SR, Bond S, Fang M, Reuveni M, et al. (2009) Function of a subunit of the V-ATPase in pH homeostasis and in vitro invasion of MDA-MB231 human breast cancer cells. Journal of Biological Chemistry 284: 16400–16408.
30. Furla P, Allemand D, Orsenigo M (2000) Involvement of H+
-ATPase and carbonic anhydrase in inorganic carbon uptake for endosymbiont photosynthe-sis. American Journal of Physiology: Regulatory Integrative Comparative Physiology 278: R870–R881.
31. Po¨rtner HO, Book C, Reipschla¨ger A (2000) Modulation of the cost of pHi regulation during metabolic depression: a 31
P-NMR study in invertebrate (Sipunculus nudus) isolated muscle. Journal of Experimental Biology 203: 2417–2428.
33. Ku¨ltz D (2005) Molecular and evolutionary basis of the cellular stress response. Annual Review of Physiology 67: 225–257.
34. DeSalvo MK, Voolstra CR, Sunagawa S, Schwarz JA, Stillman JH, et al. (2008) Differential gene expression during thermal stress and bleaching in the Caribbean coral Montastraea faveolata. Mol Ecol 17: 3952–3971.
35. Lesser MP, Farrell JH (2004) Exposure to solar radiation increases damage to both host tissues and algal symbionts of corals during thermal stress. Coral Reefs 23: 367–377.
36. DeSalvo MK, Sunagawa S, Voolstra CR, Medina M (2010) Transcriptomic responses to heat stress and bleaching in the elkhorn coralAcropora palmata. Marine Ecology Progress Series 402: 97–113.
37. Dunn SR, Phillips WS, Spatafora JW, Green DR, Weis VM (2006) Highly conserved Caspase and Bcl-2 homologues from the sea anemoneAiptasia pallida: lower metazoans as models for the study of apoptosis evolution. Journal of Molecular Evolution 63: 95–107.
38. Hauer J, Pu¨schner S, Ramakrishnan P, Simon U, Bongers M, et al. (2005) TNF receptor (TNFR)-associated factor (TRAF) 3 serves as an inhibitor of TRAF2/5 mediated activation of the noncanonical NF-kB pathway by TRAF-binding TNFRs. Proceeding of the National Academy of Science USA 22: 2874–2879. 39. Lankat-Buttgereit B, Goke R (2009) The tumour supressor Pdcd4: recent advances in the elucidation of function and regulation. Biology of the Cell 101: 309–317.
40. Kraus ZJ, Haring JS, Bishop GA (2008) TNF receptor-associated factor 5 is required for optimal T cell expansion and survivial in response to infection. Journal of Immunology 181: 7800–7809.
41. Pernice M, Dunn SR, Miard T, Dufour S, Dove S, et al. (2011) Regulation of apoptotic mediators reveals dynamic responses to thermal stress in the reef building coralAcropora millepora. Plos One 6: e16095.
42. Uren AG, O’Rourke K, Aravind L, Pisabarro MT, Seshagiri S, et al. (2000) Identification of paracaspases and metacaspases: two ancient families of caspase-like proteins, one of which plays a key role in MALT lymphoma. Molecular Cell 6: 961–967.
43. Hirayama H, Seino J, Kitajima Y, Jigami Y, Suzuki T (2010) Free oligosaccharides to monitor glycoprotein endoplasmic reticulum-associated degradation in Saccharomyces cerevisiae. Journal of Biological Chemistry 285: 12390–12404.
44. Li Y, Bergeron JJM, Luo L, Ou WJ, Thomas DY, et al. (1996) Effects of inefficient cleavage of the signal sequence of HIV-1 gpl20 on its association with calnexin, folding, and intracellular transport. Proceeding of the National Academy of Science USA 93: 9606–9611.
45. Kvennefors ECE, Leggat W, Hoegh-Guldberg O, Degnan BM, Barnes AC (2008) An ancient and variable mannose-binding lectin from the coral Acropora millepora binds both pathogens and symbionts. Developmental and Compar-ative Immunology 32: 1582–1592.
46. Rosenberg E, Koren O, Reshef L, Efrony R, Zilber-Rosenberg I (2007) The role of microorganisms in coral health, disease and evolution. Nature Reviews Microbiology 5: 355–362.
47. Miller DJ, Hemmrich G, Ball EE, Hayward DC, Khalturin K, et al. (2007) The innate immune repertoire in Cnidaria - ancestral complexity and stochastic gene loss. Genome Biology 8: R59.
48. Schwarz JA, Brokstein PB, Voolstra CR (2008) Coral life history and symbiosis: functional genomic resources for two reef building Caribbean corals,Acropora palmataandMontastraea faveolata. BMC Genomics 9: 97.
49. Hidalgo C (2005) Cross talk between Ca2+and redox signaling cascades in muscle and neurons through the combined activation of ryanodine receptors/ Ca2+release channels. . Philosophical Transactions of the Royal Society of London Series B: Biological Sciences 360: 2237–2246.
50. Kasri NN, Parys JB, Callewaert G, Missiaen L, De Smedt H (2004) Calmodulin and calcium-release channels. Biological Research 37: 577–582.
51. Schallreuter KU, Gibbons NC, Zothner C, Abou Elloof MM, Wood JM (2007) Hydrogen peroxide mediated oxidative stress disrupts calcium binding on calmodulin: more evidence for oxidative stress in vitiligo. Biochemical and Biophysical Research Communications 360: 70–75.
52. Fill M, Capello JA (2002) Ryanodine receptor calcium release channels. Physiological Reviews 82: 893–922.
53. Croall D, Ersfeld K (2007) The calpains: modular designs and functional diversity. Genome Biology 8: 218.
54. Doherty GJ, McMahon HT (2008) Mediation, modulation and consequences of membrane-cytoskeleton interactions. Annual Review of Biophysics 37: 65–95. 55. Zheng B, Han M, Bernier M, Wen JK (2009) Nuclear actin and actin-binding
proteins in the regulation of transcription and gene expression. The FEBS journal 276: 2669–2685.
56. Dollar GL, Weber U, Mlodzik M, Sokol SY (2005) Regulation of Lethal giant larvae by Dishevelled. Nature 437: 1376–1380.
57. Shima DT, Scales SJ, Kreis TE, Pepperkok R (1999) Segregation of COPI rich and anterograde cargo rich domains in endoplasmic reticulum to Golgi transport complexes. Current Biology 9: 821–824.
58. Whitley NM, Scott JL, Breeze SJ, McCann L (2001) Effects of water salinity on acid-base balance in decapod crustaceans. Journal of Experimental Biology 204: 1003–1011.
59. Hoeflich KP, Ikura M (2004) Radixin:cytoskeletal adopter and sinaling protein. International Journal of Biochemistry & Cell Biology 36: 2131–2136.
60. Lees-Miller JP, Helfman DM, Schroer TA (1992) A vertebrate actin-related protein is a component of a multisubunit complex involved in microtubule-based vesicle motility. Nature 359: 244–246.
61. Cully M, Downward J (2008) SnapShot: Ras Signaling. Cell 133: 1292. 62. Pfeffer S, Aivazian D (2004) Targeting Rab GTPases to distinct membrane
compartments. Nature Reviews Molecular Cell Biology 5: 886–896. 63. Stenmark H, Olkkonen VM (2001) The Rab GTPase family. Genome Biology
2: 3007.3001–3007.3007.
64. Cadenas E, Davies KJ (2000) Mitochondrial free radical generation, oxidative stress, and aging. Free Radical Biology and Medicine 29: 222–230. 65. Davidson JF, Schiestl RH (2001) Mitochondrial respiratory electron carriers are
involved in oxidative stress during heat stress inSaccaromyces cerevisiae. Molecular and Cellular Biology 21: 8483–8489.
66. Muller J, Menzel D, Samaj J (2007) Cell-type specific disruptionand recovery of the cytoskeleton inArabidopsis thalianaepidermal root cells upon heat shock stress. Protoplasma 230: 231–242.
67. Dunn SR (2009) Immunorecognition and immunoreceptors in the Cnidaria. Invertebrate Survival Journal 6: 7–14.
68. Orrenius S, Zhivotovsky B, Nicotera P (2003) Regulation of cell death: the calcium-apoptosis link. Nature Reviews Molecular Cell Biology 4: 552–565. 69. Caldeira K, Wickett ME (2003) Anthropogenic carbon and ocean pH. Nature
425: 365.
70. Pelejero C, Calvo E, Hoegh-Guldberg O (2010) Paleo-perspective on ocean acidification. Trends in Ecology & Evolution 25: 332–345.
71. Dickson AG, Afghan JD, Andersen GC (2003) Reference materials for oceanic CO2analysis: a method for the certification of total alkalinity. Marine Chemistry 80: 185–197.
72. Mehrbach C, Culberson CH, Hawley JE, Pytkowicz RM (1973) Measurement of the apparent dissociation constants of carbonic acid in seawater at atmospheric pressure. Limnology and Oceanography 18: 897–907.
73. Dickson AG, Millero FJ (1987) A comparison of the equilibrium constants for the dissociation of carbonic acid in seawater media. Deep Sea Research 34: 1733–1743.
74. Lewis E, Wallace DWR (1998) Program developed for CO2 system calculations. In:, , Carbon Dioxide Information Analysis Center ORNL, US., editor. Oak Ridage, TN: Department of Energy.
75. Barnes D, Chalker B (1990) Calcification and photosynthesis in reef-building corals and algae. In: Z. D, ed. Ecosystems of the World: Vol 25, Coral Reefs. Amsterdam: Elsevier Science. pp 109–131.
76. Zapata M, Rodriguez F, Garrrido JL (2000) Separation of chlorophylls and carotenoids from marine phytoplankton: a new HPLC method using a reversed-phase C8 column and pyridine-containing mobile reversed-phases. Marine Ecology Progress Series 195: 29–45.
77. Stimson J, Kinzie RA (1991) The temporal pattern and rate of release of zooxanthellae from the reef coralPocillopora damicornis(Linnaeus) under nitrogen-enrichment and control conditions. Journal of Experimental Marine Biology and Ecology 153: 63–74.
78. Spencer-Davies P (1989) Short-term growth measurements of coral growth using an accurate buoyant weighing technique. Marine Biology 101: 389–395. 79. Bay LK, Ulstrup KE, Nielsen HB, Jarmer H, Goffard N, et al. (2009)
Microarray analysis reveals transcriptional plasticity in the reef building coral Acropora millepora. Mol Ecol 18: 3062–3075.
80. Foret S, Kassahn KS, Grasso LC, Hayward DC, Iguchi A, et al. (2007) Genomic and microarray approaches to coral reef conservation biology. Coral Reefs 26: 475–486.
81. Grasso LC, Maindonald J, Rudd S, Hayward DC, Saint R, et al. (2008) Microarray analysis identifies candidate genes for key roles in coral development. BMC Genomics 9: 540.
82. Smyth GK (2005) Limma: Linear models for microarray data. In: W H, ed. In: Bioinformatics and Computational Biology Solutions using R and Bioconductor. New York: Springer. pp 397–420.
83. Smyth GK (2004) Linear models and empirical Bayes methods for assessing differential expression in microarray experiments. Statistical Applications in Genetics and Molecular Biology 3: Article 3.
84. Ritchie ME, Silver J, Oshlack A, Holmes M, Diyagama D, et al. (2007) A comparison of background correction methods for two-colour microarrays. Bioinformatics 23: 2700–2710.
85. Smyth GK, Speed T (2003) Normalization of cDNA microarray data. Methods 31: 265–273.
86. Benjamini Y, Hochberg Y (1995) Controlling the false discovery rate: a practical and powerful approach to multiple testing. Journal of the Royal Statistical Society Series B 57: 289–300.
87. Saeed AI, Sharov V, White J, Li J, Liang W, et al. (2003) TM4: a free, open-source system for microarray data management and analysis. BioTechniques 34: 374–378.
88. Zheng Q, Wang XJ (2008) GOEAST: a web-based software toolkit for gene ontology enrichment analysis. Nucleic Acids Research 36: W358–363. 89. Vandesompele J, De Preter K, Pattyn F, Poppe B, Van Roy N, et al. (2002)
Accurate normalization of real-time quantitative RT-PCR data by geometric averaging of multiple control genes. Genome Biology 3: 6906–6914.