AN EXPLORATORY STUDY ON HOW THE
CORRUPTION LEVEL OF THE HOST COUNTRY
AFFECTS FOREIGN DIRECT INVESTMENT’S
INFLOWS
ALESSANDRA AUR RASO
Rio de Janeiro - 2016DISSERTAÇÃO APRESENTADA ÀESCOLABRASILEIRA DEADMINISTRAÇÃO
ALESSANDRA AUR RASO
AN EXPLORATORY STUDY ON HOW THE CORRUPTION LEVEL OF THE HOST COUNTRY AFFECTS
FOREIGN DIRECT INVESTMENT’S INFLOWS
Master's thesis presented to Corporate International Master's program, Escola Brasileira de Administração Pública, Fundação Getúlio Vargas, as a requirement for obtaining the title of Master in Business Management.
Advisor: Professor Ricardo Sarmento Costa
Raso, Alessandra Aur
An exploratory study on how the corruption level of the host country affects foreign direct investment’s inflows / Alessandra Aur Raso. – 2016.
71 f.
Dissertação (mestrado) - Escola Brasileira de Administração Pública e de Empresas, Centro de Formação Acadêmica e Pesquisa.
Orientador: Ricardo Sarmento Costa. I nclui bibliografia.
1. Administração financeira. 2. I nvestimentos estrangeiros. 3. Risco (Economia). I . Costa, Ricardo Sarmento. I I . Escola Brasileira de Administração Pública e de Empresas. Centro de Formação Acadêmica e Pesquisa. I I I . Título.
I would like to recognize all the support given by my mentor Anderson Pascoal
Constantino throughout the process of my research, your comprehension and help were
essential for me to be able to complete this work.
I want to thank all my friends, colleagues and professionals who supported and helped
me with my survey.
I also want to acknowledge Professor Ricardo Sarmento Costa for the advisory on the
RASO, Alessandra Aur. An exploratory study on how the corruption level of the host country affects foreign direct investment’s inflows, 2016. Thesis (Master in Business Management) -Escola Brasileira de Administração Pública e de Empresas, Fundação Getúlio Vargas, Rio de Janeiro, 2016.
In today’s business world everything seems to be somehow linked to globalization, what
leads to trading without barriers, developing productions schemes that involves more than one
country and one location, capital flows and technology transfer. Foreign Direct Investment
(FDI) has been used in the past decades as one of the main sources of capital to sustain cash
flow needs for the globalization process. So how do investors decide where to invest? A number
of risk factors are analyzed as part of this decision process, and among them is the level of
corruption of the country of inflows destination. This exploratory study , based on quantitative
and qualitative analysis, reviewed the relation between FDI inflows and the level of corruption
in the host country to develop hypotheses and propositions that lead to complementary research
to conclude on how and to which extend the level of corruption of the host country impacts its
FDI inflows. In order to narrow down the universe explored, which would be to vast if all
possible combinations of home and host countries were to be incorporated, the population used
to perform analysis was based on Brazil’s and China’s data being the host country and its main
FDI investors as home countries of the FDI inflows. Historical series of the indicators used in
the quantitative analysis were obtained for the period from 2005 to 2012.
1. INTRODUCTION ... 14
2. RESEARCH STRUCTURE, OBJECTIVE AND METHODOLOGY ... 16
2.1 PROBLEM DEFINITION ... 16
2.2 OBJECTIVE ... 16
2.3 RESEARCH STRUCTURE ... 16
2.4 METHODOLOGY ... 17
3. DEFINITIONS AND FACTS ... 18
3.1 FDI – FOREIGN DIRECT INVESTMENT ... 18
3.2 CORRUPTION ... 19
3.3 COUNTRIES OF FOCUS ... 20
4. LITERATURE REVIEW ... 23
4.1 PREVIOUS STUDIES ... 23
4.2 THE ACTUAL PERCEPTION OF CORRUPTION AND BRIBERY ... 26
4.2.1 Brazil ...27
4.2.2 China ...28
5. RESEARCH RESULTS AND ANALYSIS ... 30
5.1 PHASE 1 – QUANTITATIVE ANALYSIS ... 30
5.1.1 Hosting countries’ indicators ...31
5.1.2 Home countries selected ...32
5.1.3 Hosting countries’ indicators ...32
5.1.4 Absolute difference in corruption level between FDI’s host and home country ...36
5.1.5 Greenfield investments ...39
5.2 PHASE 2 – QUALITATIVE ANALYSIS ... 40
5.2.1 Population used in the survey ...40
5.2.2 Survey questionnaire ...40
5.2.3 Group one questions – Respondents’ professional profile ...41
5.2.4 Group two questions - Technical questions ...42
5.2.5 Group three question – Additional comments ...47
6. CONCLUSION... 49
6.1 QUANTITATIVE ANALYSIS REMARKS ... 49
6.2 QUALITATIVE ANALYSIS REMARKS... 50
9. APPENDIX ... 55
9.1 APPENDIX I – COUNTRY PROFILE: BRAZIL ... 55
9.2 APPENDIX II – COUNTRY PROFILE: CHINA ... 56
9.3 APPENDIX III – SURVEY QUESTIONNAIRE ... 57
9.4 APPENDIX IV – RESPONSE REPORT PER QUESTION ... 61
9.5 APPENDIX V – RESPONSE REPORT PER RESPONDENT ... 65
Table 1 – Brazil and China in numbers ... 20
Table 2 – Corruption impact on FDI - Previous Researches Summary ... 24
Table 3 – Key indicators: Brazil ... 31
Table 4 – Key indicators: China ... 31
Table 5 – Home country sample ... 32
Table 6 – Key indicators for home countries selected ... 33
Table 7 – CPI and FDI inflows variance year on year - Brazil ... 36
Table 8 – CPI and FDI inflows variance year on year - China ... 37
Table 9 – Keys used to analyze CPI’s absolute difference and FDI inflows ... 37
Table 10 – Results per behavior of CPI’s absolute difference ... 38
Table 11 – Results obtained when analyzing the behavior of CPI’s absolute difference and FDI inflows ... 38
Table 12 – Announced value of Greenfield FDI projects ... 40
Table 13 – Respondents’ profile ... 41
Table 14 – Q4. Is the level of corruption in Brazil and China, when being the host country, a primary factor in the Foreign Direct Investment (FDI) decision process? ... 42
Table 15 – Q5. Does the absolute difference in the corruption level between Brazil and China, when being the host country, and home country has more impact in the FDI decision process when this difference is greater? ... 43
Table 16 – Q6. Does the interest of the investor in market share and presence increase supersedes the negative impacts of the corruption level in Brazil and China when FDI is being analyzed? ... 43
Table 17 – Q7. What is the importance of the corruption level in Brazil and China when FDI inflows are from countries that are a member of the OECD (Organisation for Economic Co-operation and Development)? ... 44
Table 18 – Q9. How are inflows from countries with strong laws against bribery abroad affected when considering investments in Brazil and China? ... 45
Table 19 – Q8. Corruption scandals will have the following effect on foreign direct investments inflows ... 45
Figure 1 – Global FDI overview 2015 and 2014 ... 18
Figure 2 – CPI 2015 results map ... 19
Figure 3 – The global picture by region ... 20
Figure 4 – FDI flows - China and Brazil from 2005 to 2015... 21
Figure 5 – FDI restrictiveness ... 21
ASEAN – Association of Southeast Asian Nations BI – Business International
BRICS – Brazil, Russia, India, China and South Africa CPI – Corruption Perceptions Index
ELF – Ethno Linguistic Fractionalization
EU – European Union
EY – Ernst & Young
FDI – Foreign Direct Investment GDP – Gross Domestic Product GNI – Gross National Income
ICP – International Comparison Program Ln – Natural Logarithm
MNC – Multinational Corporation
NAFTA – North American Free Trade Agreement
OECD – Organisation for Economic Co-operation and Development PPP – Purchasing Power Parity
SAR – Special Administrative Region
SEC – U.S. Securities and Exchange Commission
UK – United Kingdom
UNCTAD – United Nations Conference on Trade and Development US / USA – United States of America
1. INTRODUCTION
In today’s world everything seems to be somehow linked to globalization, what leads to
trading without barriers, developing productions schemes involving more than one country
and/or location, cash outflows and inflows and technology transfer. As part of the globalization
process companies have to adjust and expand their structures, and to do so, in the past decades,
one of the main forms to obtain capital to support the company’s cash flow needs to implement
the necessary modifications, adaptations and to start or increase its level of internationalization
was through Foreign Direct Investment (FDI). FDI is defined as "investment made to acquire
lasting interest in enterprises operating outside of the economy of the investor" (Blaine, 2009).
The candidate companies to receive FDI inflows from investors are already numerous per
country of destination, let alone if that number is to be multiplied by the number of countries
available for them to analyze. So how do investors decide in which country and company to
invest on? In order to understand and identify the variables that affect the attractiveness of each
option, one of the steps is to run analysis that incorporated a number of risk factors. Among the
studied risks, investors consider the degree to which corruption is perceived in each of the
evaluated countries and how would this affect the intended business.
Corruption is a worldwide problem, a broader one for less developed countries, what can
represent a substantial threat to its growth and financial markets. Due to its relevance, it has
gained more space for discussion and regulation as relations between less corrupt and more
corrupt countries increased in the past decades.
Transparency International, a global movement that works for a world free of corruption,
issues a yearly report that details the Corruption Perceptions Index (CPI) measuring the
perceived levels of public sector corruption in various countries and territories. The Corruption
Perceptions Index 2015 report included 168 countries and territories, and if we look for Brazil,
Russia, India, China and South Africa - the BRICS, as these are countries that have
characteristics of larger receptors of FDI inflow; it is possible to verify that their ranks are 76,
119, 76, 83 and 61, respectively. Big investors like United States, United Kingdom and
Germany are ranked 16, 10 and 10. Does the difference between the corruption level in each of
Analyzing and modeling the decision making process for FDI is not an easy task as the
final decision depends on various parameters, considered on different phases and that can also
vary based on the specific characteristics and levels of manageable risk of each investor. Some
also argue that investors who have been exposed to bribery at home may not be deterred by
corruption abroad, but instead seek countries where corruption is prevalent (Cuervo-Cazurra,
2006).
Law enforcement agencies, including the United States Department of Justice and the
United States Securities and Exchange Commission, are increasingly focusing on individual
misconduct when investigating impropriety. In this context, boards and executives need to be
confident that their businesses comply with rapidly changing laws and regulations wherever
they operate (EY, 2016). So considering that individuals acting in executive positions are liable
from the regulator point of view, are they and the ones involved in the FDI decision process
2. RESEARCH STRUCTURE, OBJECTIVE AND METHODOLOGY 2.1 PROBLEM DEFINITION
Corruption is always a sensitive issue and recent corruption scandals have turned it into
a very up to date topic.
According to FDI Intelligencei, foreign direct investment has become the major economic
driver of globalization, accounting for over half of all cross border investments, so is also a
timely area.
Habib and Zurawicki’s work, published in 2002, highlights the importance to
understanding the effects of corruption in FDI as it can produce bottlenecks, uncertainties and
costs raising.
Considering that corruption is most likely to be present everywhere, even if in lower
levels or with less social impact, it is necessary for investors to understand to which level they
will be exposed to, to which regulation and at what cost.
2.2 OBJECTIVE
This work was designed as an exploratory research to develop hypotheses and
propositions that lead to complementary research to conclude on how and to which extend the
level of corruption of the host country impacts its FDI inflows.
2.3 RESEARCH STRUCTURE
The research for this work was based on quantitative and qualitative analysis.
A number of articles, studies and researches that address a similar theme where previously
published by other professionals and academics. The contents, data and conclusions of these
studies were used to structure the quantitative analysis developed in this work.
As the basis of the qualitative analysis, a survey questionnaire was provided to selected
experienced professionals that are linked to the decision making process of where to direct FDI
inflows in order to corroborate the hypotheses and trends obtained from the quantitative
2.4 METHODOLOGY
The theme explored by this work would have a very broad volume of data to be analyze
if all possible combinations of home and host countries were to be incorporated in the
population used.
In order to narrow the population of this exploratory research, quantitative (Phase 1) and
qualitative (Phase 2) analysis were performed using series of data for Brazil and China as the
host countryii of the FDI inflows and its main FDI investors as home countriesiii of FDI inflows.
These two countries were chosen due to its high attractiveness, market opportunities, corruption
history and to its political and regulation differences.
The data used in previous studies was based on historical series that do not reflect the
recent changes and current situations of certain countries. So in order to have a more up to date
understanding of FDI inflows behavior and to achieve the objective of this research, indicators
used in the quantitative analysis were obtained for the period from 2005 to 2012. This period
was selected as it represents a more mature investment phase of both countries what made
possible to obtain values from consistent databases, without mixing methodologies.
As the historical series of data used in the quantitative analysis was limited, the review
performed in this phase of the work was made in order to raise hypotheses posteriorly evaluated
in conjunction with the results obtained from the qualitative analysis performed based on the
answers collected in a survey made with experienced professionals.
The survey containing questions formulated base on the findings discussed in Phase 1 and
was sent to fifty-five selected professionals who act as Advisors for FDI transactions, Auditors,
Investors, Investment and Business analysts. These professionals are part of international
corporations and professional firms and are based in Brazil, USA and Middle East.
The qualitative phase of the work had an important role in this thesis, as it was critical to
3. DEFINITIONS AND FACTS
3.1 FDI – FOREIGN DIRECT INVESTMENT
The FDI relationship consists of a parent enterprise and a foreign affiliate, which together
form a multinational corporation (MNC). In order to qualify as FDI the investment must afford
the parent enterprise control over its foreign affiliate. (Blaine, 2009).
FDI has become more and more important for global businesses over the decades as it
represents a very interesting way for companies willing to invest, to gain access to new markets
and technologies. On the other hand, it is also an excellent financing opportunity for investees
that want to grow and have difficulties to access capital markets or to obtain good interest rates
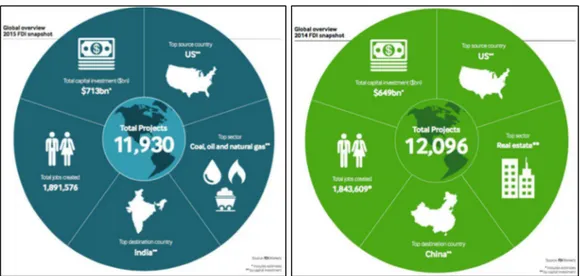
in loans with finance institutions. The figure below shows an overview of the importance of
FDI in global business, information presented refers to transactions occurred during 2015 and
2014 on Greenfieldiv investments.
Figure 1 – Global FDI overview 2015 and 2014
Source: The fDi Report 2016 and 2015
This type of investment brings together countries that are geographically and culturally
distant helping economic relationships to develop and intensify. In the graphics above it is
possible to see that the United States is the main source (home) country being India and China
the main destination (host) countries in 2015 and 2014, respectively, and there is no denial that
So if there are so many differences between two countries what is that attracts investors?
Several factors are considered when determining an investment; factors like market access,
demand, access to natural resources and political risk are some of them among others. Which
of these factors will count more will depend on the primary interest of the investor, and then
this will probably be the reason to choose the country to invest on.
3.2 CORRUPTION
One frequently used definition that covers a broad range of corrupt activities is the “abuse
of public or private office for personal gain” (OECD, 2008). The main problem here is not the
combination between private and public personal, but the act of corruption itself.
It is acceptable for one to believe that corruption is a problem of developing and poor
countries due to bigger social differences and to cultural aspects. But according to Transparency
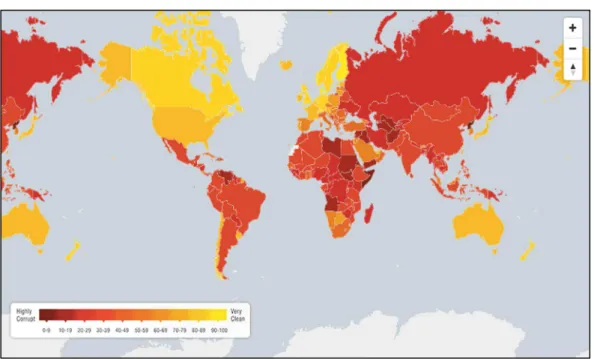
International’s latest Corruption Perceptions Index (CPI) Report, not one of the 168 countries
assessed in the 2015 index gets a perfect score and two-thirds score below 50 (Corruption
Perceptions Index, 2015). The map below shows the results of 2015 CPI report, and it is easy
to see on it that corruption is a global problem.
Figure 2 – CPI 2015 results map
Source: Corruption Perceptions Index 2015
Additionally, if we analyze the globe per region the picture does not get better, as the
average of the least corrupted region, which is EU & Western Europe, is not very close to the
Figure 3 – The global picture by region
Source: Corruption Perceptions Index 2015
Corruption and the perception of corruption, erodes trust in governments, businesses and
markets (OECD, 2014), but is it sufficient to impair the benefits of investing in certain
countries?
3.3 COUNTRIES OF FOCUS
Attracting FDI is a major challenge for host countries, as they need to identify the major
drivers of push and pull factors that attract foreign direct investment to a country (Malhotra,
Russow and Singh, 2014).
As previously mentioned the exploratory research of this thesis focused in Brazil and
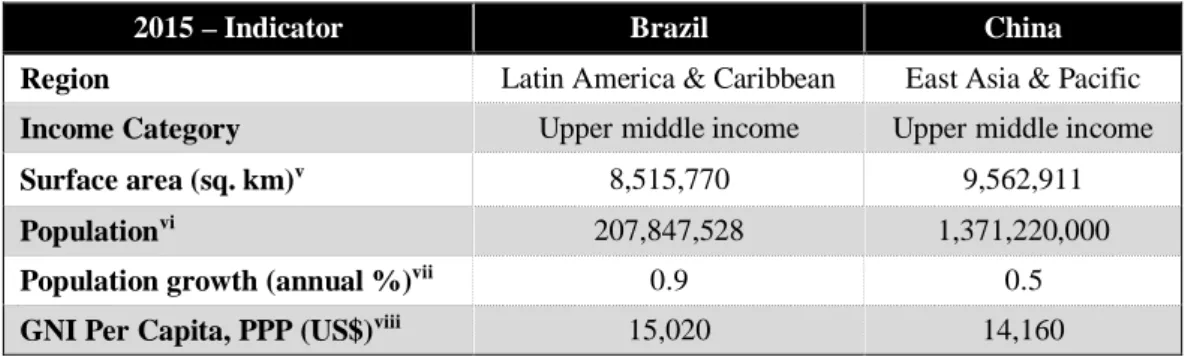
China as the host country of FDI inflows. The table below shows some indicators for Brazil
and China based on 2015 figures, from these indicators is possible to understand the size and
importance of these two markets, and mainly the immense potential of development they have.
Table 1 – Brazil and China in numbers
2015 – Indicator Brazil China
Region Latin America & Caribbean East Asia & Pacific
Income Category Upper middle income Upper middle income
Surface area (sq. km)v 8,515,770 9,562,911
Populationvi 207,847,528 1,371,220,000
Population growth (annual %)vii 0.9 0.5
GNI Per Capita, PPP (US$)viii 15,020 14,160
The following graphics show FDI inflows for these countries and demonstrate the
magnitude of investors’ interest over the past decade on these economies and markets.
Figure 4 – FDI flowsix - China and Brazil from 2005 to 2015
Source: OECD iLibrary data bank (https://data.oecd.org/)
The below graphic brings the level of FDI restrictiveness of each country. What is
interesting to observe is that even though China has a higher level of restrictiveness it is still
able to capture a fair amount of investment from other countries’ investors.
Figure 5 – FDI restrictivenessx
Brazil has been historically referred as the country of the future; this concept was
developed based on its huge stockpile of mineral resources, rich agricultural land and human
capital in well-developed regions. In mid-90’s it seemed that the country has found its track and
finally achieved this objective, reforms implemented by the newly elected government of
President Fernando Henrique Cardoso helped to control inflation, lower tariffs, increase
transparency and mainly privatize state industries, what brought together an increase of FDI.
It seemed that Brazil had finally consolidated its position as a stabilized and economically
mature country; but than a corruption scandal involving the government caused the
impeachment of the President and brought together an economic, political, social and moral
crisis to challenge its stability. Will these factors affect Brazil’s investment attractiveness?
It is undeniable that China has a vast market undergoing unprecedented changes, posing
challenges and complexities even for those with high level of experience in the country.
According to Wei (2000), China has rampant corruption according to various newspaper
accounts as well as surveys of business executives. Yet, for every year in the last four years,
China has been the largest developing host of international investment. Even its FDI
flow-to-GDP ratio has been one of the highest among developing countries. So does this mean that no
matter which variables are included in China’s equation it will continue to be a top FDI
4. LITERATURE REVIEW 4.1 PREVIOUS STUDIES
Over the past decades, with the increase of FDI’s relevance for developing economies it
has become the object of several studies. Some of them have analyzed the relationship of FDI
and specific host or home countries, but others have focused on the correlation of corruption
level in the hosting country and the level of inward FDI in the aim to understand how it can be
affected.
As the intention of this thesis was to explore the impacts, if any, that the corruption level
has on the attractiveness of FDI, previous researches addressing this subject were used as the
basis to structure the research for this work.
It is important to highlight that although the subject of this thesis is very up to date and
reflects current discussions on worries about corruption and moral in developing countries,
neither previous studies nor this thesis were able to capture the impacts of the recent facts.
Events like the scandals in Brazil or the effects of Chinese Government actions like the
enforcement of anti-bribery and anti-corruption regulatory framework, Going Outxi or One Belt,
One Roadxii strategies cannot be taken into consideration as they were too recent and the impacts
of them would be out of the period covered by this exploratory research.
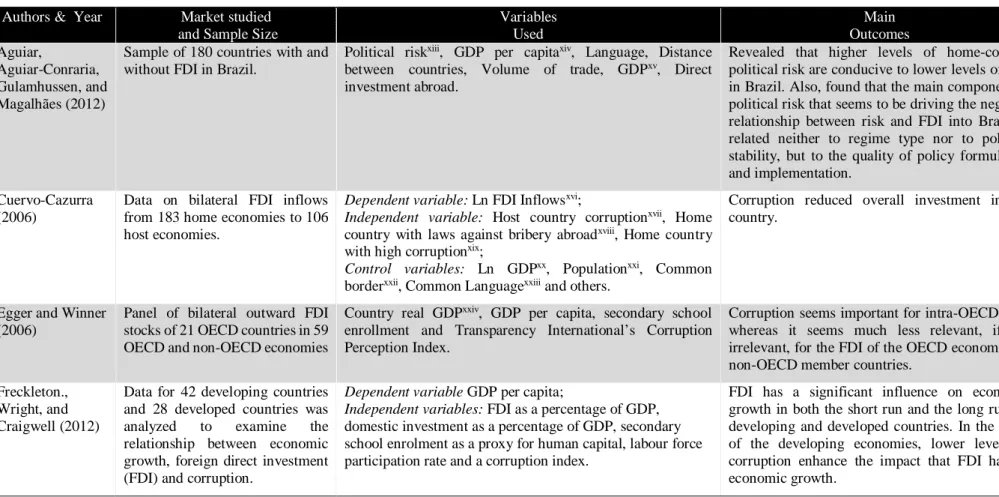
The majority of the results from previous researches show that the level of corruption has
a negative impact on FDI, so to better understand what was analyzed in relevant studies on
Table 2 – Corruption impact on FDI - Previous Researches Summary
Authors & Year Market studied and Sample Size
Variables Used Main Outcomes Aguiar, Aguiar-Conraria, Gulamhussen, and Magalhães (2012)
Sample of 180 countries with and without FDI in Brazil.
Political riskxiii, GDP per capitaxiv, Language, Distance
between countries, Volume of trade, GDPxv, Direct
investment abroad.
Revealed that higher levels of home-country political risk are conducive to lower levels of FDI in Brazil. Also, found that the main component of political risk that seems to be driving the negative relationship between risk and FDI into Brazil is related neither to regime type nor to political stability, but to the quality of policy formulation and implementation.
Cuervo-Cazurra (2006)
Data on bilateral FDI inflows from 183 home economies to 106 host economies.
Dependent variable: Ln FDI Inflowsxvi;
Independent variable: Host country corruptionxvii, Home
country with laws against bribery abroadxviii, Home country
with high corruptionxix;
Control variables: Ln GDPxx, Populationxxi, Common
borderxxii, Common Languagexxiii and others.
Corruption reduced overall investment in the country.
Egger and Winner (2006)
Panel of bilateral outward FDI stocks of 21 OECD countries in 59 OECD and non-OECD economies
Country real GDPxxiv, GDP per capita, secondary school
enrollment and Transparency International’s Corruption Perception Index.
Corruption seems important for intra-OECD FDI, whereas it seems much less relevant, if not irrelevant, for the FDI of the OECD economies in non-OECD member countries.
Freckleton., Wright, and Craigwell (2012)
Data for 42 developing countries and 28 developed countries was analyzed to examine the relationship between economic growth, foreign direct investment (FDI) and corruption.
Dependent variable GDP per capita;
Independent variables: FDI as a percentage of GDP,
domestic investment as a percentage of GDP, secondary school enrolment as a proxy for human capital, labour force participation rate and a corruption index.
FDI has a significant influence on economic growth in both the short run and the long run for developing and developed countries. In the cases of the developing economies, lower levels of corruption enhance the impact that FDI has on economic growth.
Authors & Year Market studied and Sample Size
Variables used Main Outcomes Habib and Zurawicki (2002)
Host countries: 89 countries were included, representing the whole spectrum, comprising developed, developing, and the transition economies.
Home countries: Germany, Italy, Japan, Korea, Spain, UK and the USA.
Dependent variable: Ln FDI Inflows,
Independent variables: Corruption and absolute difference in
corruption between the host and the home country,
Control variables: Log of Population, GDP growthxxv, Log of
GDP per capitaxxvi, Tradexxvii/GDP ratio, Political Risk
Indexxxviii, Unemployment ratexxix, Ratings for science and
technology, Economic ties - country participation in the same common market areas (EU, NAFTA, ASEAN) or preferential trade agreements and Log of geographic distance.
Both the level of corruption in the host country and the absolute difference between the level of corruption in the host country and in the home country have a negative impact on FDI.
Mauro (1995) Analyzed the institutional characteristics of 67 countries.
Total Investment/GDP, BI Indices of Corruption and Institutional Efficiencyxxx and The Index of ELFxxxi.
Found that corruption reduced overall investment in the country.
Wei (2000) Covers bilateral investment from 12 source countries to 45 host countries.
Outward FDI, Host countries' tax rate on foreign corporations, Country's corruption levelxxxii, GDP, Population, Wage and
labor compensation.
Corruption has a negative impact on FDI.
Woo and Heo (2009)
8 non-OECD Asian countries (Bangladesh, India, Indonesia, Malaysia, Pakistan, Philippines, Sri Lanka, and Thailand)
Dependent variable: FDI attractiveness of each country
calculated as INDi = (FDIi /FDIw)/(GDPi /GDPw)xxxiii,
Independent variables: Corruption level by International
Country Risk Guide and Democracy level (Polity IV database),
Control variables: GDP Growth Rate, GDP, GDP per capita,
and Trade/GDPratio.
Concluded that corruption has a negative effect impact on a country's efforts to attract more FDI.
Voyer and Beamish (2004)
Sample of 29,546 Japanese investments in 59 countries.
FDI per capitaxxxiv, GDP, Cultural proximity, Unemployment
rate, Labour growth, Government consumptionxxxv.
Found that levels of perceived corruption in emerging economies are significant predictors of Japanese FDI.
Information included in Table 2, indicates that previous studies have concluded that
corruption can influence FDI inflows. However, these studies did not consider the different
types of FDI, indicating that factors that are more specific were not considered.
As per Brouthers, Gao and McNicol (2008) previous scholarship suggests that a
compensatory model predicts a country’s FDI levels; and that aggregate FDI levels stem from
‘trade-offs’ between the positive effect of market attractiveness and the negative influence of
corruption (Wei, 2000; Habib and Zurawicki, 2001; Voyer and Beamish, 2004; Grosse and
Trevino, 2005). The authors follow on saying that, however, no prior study has investigated
corruption’s influence on two common types of FDI, market seeking and resource seeking.
According to Nachum and Zaheer (2005), market-seeking FDI involves investing in a host
country market in order to directly serve that market with local production and distribution
rather than through exporting. Resource-seeking FDI involves investing in a host country
market in order to achieve cost minimization by obtaining resources either too costly to obtain
or unavailable in the home market.
4.2 THE ACTUAL PERCEPTION OF CORRUPTION AND BRIBERY
According to the Corporate Misconduct Report (EY, 2016), the combat against bribery
and corruption in the recent years is at an unprecedented level of support, both from
governments and multilateral institutions, what has led to numerous high-profile prosecutions
in the past years. It is also reinforced in the report that there have also been efforts to apply
international standards on transparency of company ownership, including by the World Bank
and by the G20xxxvi member countries, as part of its wider focus on corruption under the Chinese
presidency in 2016. The report also points out that the work of the G20, B20xxxvii and others is
having an effect. National governments have listened, and cross-border cooperation in
enforcement has risen to an unprecedented level. In one recent example, the U.S. Securities and
Exchange Commission (SEC) disclosed that it had been working alongside 13 other
jurisdictions in pursuing a case involving over US$100m of alleged bribes in multiple tax
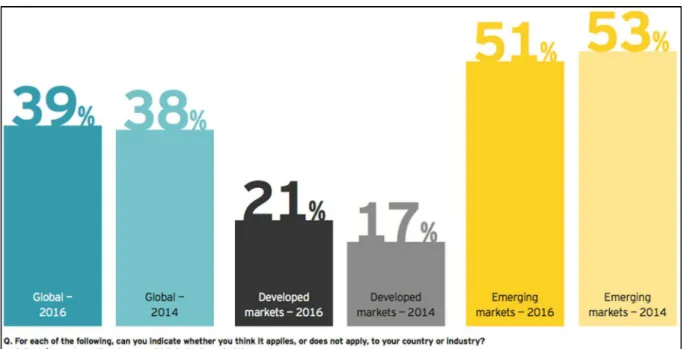
As part of the aforementioned report the following graphics, comparing the results of the
2014 and 2016 report, were presented as part of its survey. Results below are the compilation
of the answer respondents gave when questioned if bribery/corruption practices happen widely
in business in their country and results show that the view of developed markets has deteriorated
what can be a reflection of an increase in the awareness of bribery and corruption in those
markets.
Figure 6 – Bribery and corruption: an ongoing challenge
Source: Corporate misconduct - individual consequences. 14th Global Fraud Survey. 4.2.1 Brazil
Latin America countries always have had a widespread perception of business corruption
what reflects in a significant and costly problem for business and can ultimately be a significant
obstacle to do business in this region. Combined to this historical perception, Brazil has faced
during 2015 and 2016 significant economic and political challenges caused mainly by a major
corruption scandal what has lead the country to a severe recession.
The latest corruption scandals and the pressure from the population for concreate actions
against it have led legal authorities to increase the level of investigations, prosecutions and
enforcements. Another recent development in Brazil was the increase in bribery and
Because of investigations done by Brazilian authorities in parallel to those in the U.S. and
another number of countries, arrests were made including C-Levelxxxviii executives of important
organizations and corporate groups, and a big sum of ill-gotten funds were successfully
repatriated.
In a conference of businesses executives, Sergio Moro, the Federal Judge in charge of the
corruption and bribery investigations in Brazil, has declared, “Confronting systematic
corruption will bring significant gains for all of us, for companies and for the economy in
general. The cost of systematic corruption is extraordinary”. Even though Brazil is facing its
biggest corruption scandal in history a fact that would only consolidate the image of developing
and Latin countries as ones to have high levels of corruption, the country is, also showing that
it is possible to improve its laws and punish individuals involved these sort of acts. However,
is this enough to shield the capability of the country to receive investments from other
countries? Were inflows in the latest years impacted by the disclosure of such schemes?
4.2.2 China
In an interview for The Wall Street Journal, the Chinese President Xi Jinping declared,
“Transparency is the best precaution against corruption. As we go further in the anti-corruption
campaign, we will focus more on institutional building so that officials will not dare and cannot
afford to be corrupt and, more importantly, have no desire to take that course”. This declaration
only reinforced his proactive anti-graft campaign against “Tigers and Flies,” which aims to
target participants in the corruption chains. Like what is happening in Brazil, the Chinese
Government’s commitment to combat corruption have also resulted in high profile
prosecutions.
Mainland China’s anti-bribery and anti-corruption regulatory framework continues to be
refined to strengthen the country’s enforcement tools and eliminate potential loopholes. These
changes include the Ninth Amendment to China’s Criminal Law that took effect in November
2015, which introduced monetary fines for bribe givers and replaced previous monetary
thresholds in the sentencing standards with a subjective assessment of the case severity. Most
recently, in February 2016, a draft amendment to China’s core anti-corruption law, the
Anti-Unfair Competition Law, heralding the law’s first update since its enactment in 1993, looks to
introduce a books and records requirement and makes clear that companies would be held
These changes are part of an unprecedented move from Chinese authorities in the quest
to make the country a better businesses environment. But with China’s economy experiencing
decelerating growth rates and the pressure to cut corners to win business getting stronger will
executives and investors keep away of corruption and bribery practice or will they risk their
5. RESEARCH RESULTS AND ANALYSIS
As mentioned before this study used data from Brazil and China to explore how the
corruption level affects its FDI inflows. The intention was not to repeat the methodology used
by previous studies, but to analyze a combination of indicators, methods and perceptions, based
on the concepts learned in the literature review. This helped to explore if the impacts of a more
mature FDI market and of a business community more aware of the corruption sustained
previous conclusions or developed new hypotheses.
The years to be covered by the quantitative analysis is the period from 2005 to 2012, in
order to corroborate the results obtained in the quantitative review of indicators a survey was
done with experienced professionals somehow involved in the investment process, being them
part of investment funds, transaction advisory services firms and/or professional working in
multinational companies. More details of the procedures performed in each of the research
phases are explained in the following sections.
5.1 PHASE 1 – QUANTITATIVE ANALYSIS
In this phase of the research indicators that reflect the volume of businesses, size of the
country and corruption perception were analyzed in order to understand the relationship and the
impact caused in the volume of FDI Inflows. Indicators and analysis performed are detailed in
5.1.1 Hosting countries’ indicators
The following indicators were collected and were used when performing the analysis:
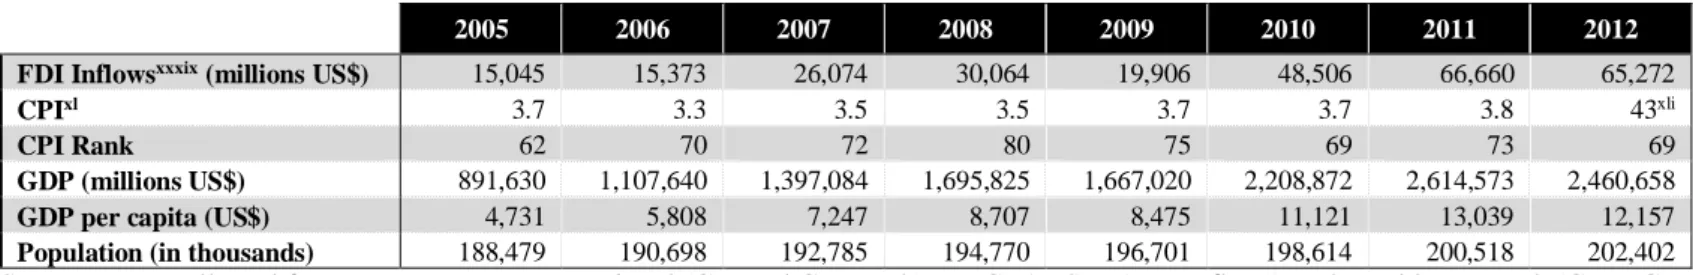
Table 3 – Key indicators: Brazil
2005 2006 2007 2008 2009 2010 2011 2012
FDI Inflowsxxxix (millions US$) 15,045 15,373 26,074 30,064 19,906 48,506 66,660 65,272
CPIxl 3.7 3.3 3.5 3.5 3.7 3.7 3.8 43xli
CPI Rank 62 70 72 80 75 69 73 69
GDP (millions US$) 891,630 1,107,640 1,397,084 1,695,825 1,667,020 2,208,872 2,614,573 2,460,658
GDP per capita (US$) 4,731 5,808 7,247 8,707 8,475 11,121 13,039 12,157
Population (in thousands) 188,479 190,698 192,785 194,770 196,701 198,614 200,518 202,402
Source: Data collected from Transparency International (CPI and CPI Rank), UNCTADStat (FDI Inflows) and World DataBank (GDP, GDP per capita and Population).
Table 4 – Key indicators: Chinaxlii
2005 2006 2007 2008 2009 2010 2011 2012
FDI Inflows (millions US$) 72,405 72,715 83,521 108,312 94,065 114,734 123,985 111,716
CPI 3.2 3.3 3.5 3.6 3.6 3.5 3.6 39
CPI Rank 78 70 72 72 79 78 75 80
GDP (millions US$) 2,268,599 2,729,784 3,523,094 4,558,431 5,059,420 6,039,659 7,492,432 8,461,623
GDP per capita (US$) 1,740 2,082 2,673 3,441 3,800 4,515 5,574 6,265
Population (in thousands) 1,305,601 1,312,601 1,319,625 1,326,691 1,333,807 1,340,969 1,348,174 1,355,387
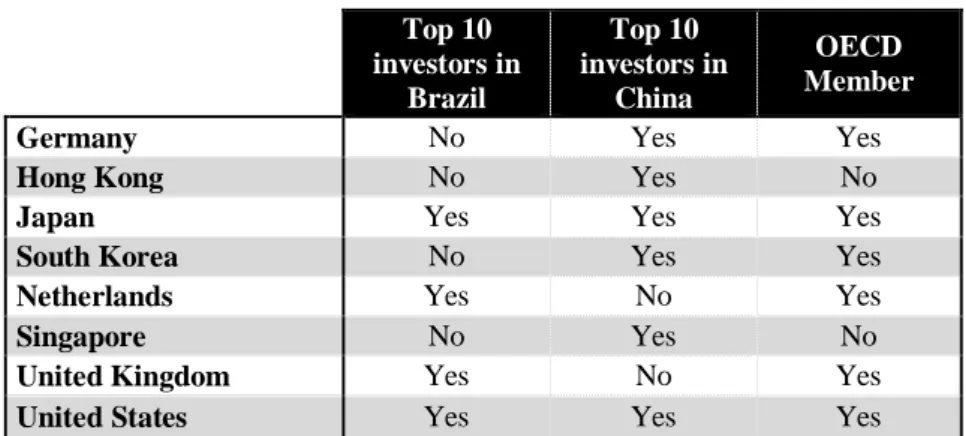
5.1.2 Home countries selected
FDI inflows in Brazil and China come from several home countries so in order to reduce
the sample and to analyze the relationship between FDI’s home and host country a sample of
eight countries was selected.
The criteria used for the selection considered relevant investors in Brazil and China over
the period covered by the analysis, if the country is a member of the OECD or not and if
individual data of inflows for the selected country was available.
Table 5 – Home country sample Top 10 investors in
Brazil
Top 10 investors in
China
OECD Member
Germany No Yes Yes
Hong Kong No Yes No
Japan Yes Yes Yes
South Korea No Yes Yes
Netherlands Yes No Yes
Singapore No Yes No
United Kingdom Yes No Yes
United States Yes Yes Yes
Source: Top investors in Brazil and China obtained from the data in the UNCTAD FDI/TNC database and OECD Members as indicated in the organization website.
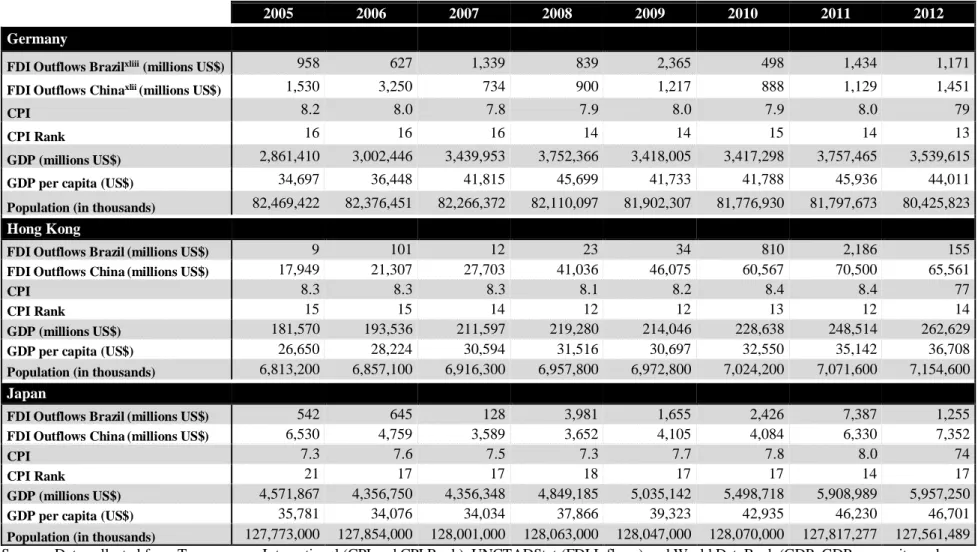
5.1.3 Hosting countries’ indicators
The same indicators collected for the host countries were obtained for the home countries.
Values are listed in this section, and were used in conjunction with the data and concepts
discussed in the prior sections in order to analyze the relationship between FDI inflows and
Table 6 – Key indicators for home countries selected
2005 2006 2007 2008 2009 2010 2011 2012
Germany
FDI Outflows Brazilxliii (millions US$) 958 627 1,339 839 2,365 498 1,434 1,171
FDI Outflows Chinaxlii(millions US$) 1,530 3,250 734 900 1,217 888 1,129 1,451
CPI 8.2 8.0 7.8 7.9 8.0 7.9 8.0 79
CPI Rank 16 16 16 14 14 15 14 13
GDP (millions US$) 2,861,410 3,002,446 3,439,953 3,752,366 3,418,005 3,417,298 3,757,465 3,539,615
GDP per capita (US$) 34,697 36,448 41,815 45,699 41,733 41,788 45,936 44,011
Population (in thousands) 82,469,422 82,376,451 82,266,372 82,110,097 81,902,307 81,776,930 81,797,673 80,425,823
Hong Kong
FDI Outflows Brazil (millions US$) 9 101 12 23 34 810 2,186 155
FDI Outflows China (millions US$) 17,949 21,307 27,703 41,036 46,075 60,567 70,500 65,561
CPI 8.3 8.3 8.3 8.1 8.2 8.4 8.4 77
CPI Rank 15 15 14 12 12 13 12 14
GDP (millions US$) 181,570 193,536 211,597 219,280 214,046 228,638 248,514 262,629
GDP per capita (US$) 26,650 28,224 30,594 31,516 30,697 32,550 35,142 36,708
Population (in thousands) 6,813,200 6,857,100 6,916,300 6,957,800 6,972,800 7,024,200 7,071,600 7,154,600
Japan
FDI Outflows Brazil (millions US$) 542 645 128 3,981 1,655 2,426 7,387 1,255
FDI Outflows China (millions US$) 6,530 4,759 3,589 3,652 4,105 4,084 6,330 7,352
CPI 7.3 7.6 7.5 7.3 7.7 7.8 8.0 74
CPI Rank 21 17 17 18 17 17 14 17
GDP (millions US$) 4,571,867 4,356,750 4,356,348 4,849,185 5,035,142 5,498,718 5,908,989 5,957,250
GDP per capita (US$) 35,781 34,076 34,034 37,866 39,323 42,935 46,230 46,701
Population (in thousands) 127,773,000 127,854,000 128,001,000 128,063,000 128,047,000 128,070,000 127,817,277 127,561,489
2005 2006 2007 2008 2009 2010 2011 2012
South Korea
FDI Outflows Brazil (millions US$) 166 110 265 628 132 1,066 (1,084) 1,047
FDI Outflows China (millions US$) 5,168 3,895 3,678 3,135 2,700 2,692 2,551 3,038
CPI 5.0 5.1 5.1 5.6 5.5 5.4 5.4 56
CPI Rank 40 42 43 40 39 39 43 45
GDP (millions US$) 898,137 1,011,797 1,122,679 1,002,219 901,935 1,094,499 1,202,464 1,222,807
GDP per capita (US$) 18,658 20,917 23,102 20,475 18,339 22,151 24,156 24,454
Population (in thousands) 48,138,077 48,371,946 48,597,652 48,948,698 49,182,038 49,410,366 49,779,440 50,004,441
Netherlands
FDI Outflows Brazil (millions US$) 900 2,939 6,840 3,136 3,803 2,736 17,908 12,003
FDI Outflows China (millions US$) 1,044 843 617 862 741 914 761 1,144
CPI 8.6 8.7 9.0 8.9 8.9 8.8 8.9 84
CPI Rank 11 9 7 7 6 7 7 9
GDP (millions US$) 678,534 726,649 839,420 936,228 857,933 836,440 893,702 828,947
GDP per capita (US$) 41,577 44,454 51,241 56,929 51,900 50,341 53,537 49,475
Population (in thousands) 16,319,868 16,346,101 16,381,696 16,445,593 16,530,388 16,615,394 16,693,074 16,754,962
Singapore
FDI Outflows Brazil (millions US$) 42 79 24 91 91 39 302 1,111
FDI Outflows China (millions US$) 2,204 2,350 3,185 4,435 3,605 5,428 6,097 6,305
CPI 9.4 9.4 9.3 9.2 9.2 9.3 9.2 87
CPI Rank 5 5 4 4 3 1 5 5
GDP (millions US$) 127,418 147,797 179,981 192,226 192,408 236,422 275,221 289,269
GDP per capita (US$) 29,870 33,580 39,224 39,721 38,578 46,570 53,094 54,451
Population (in thousands) 4,265,762 4,401,365 4,588,599 4,839,396 4,987,573 5,076,732 5,183,688 5,312,437
2005 2006 2007 2008 2009 2010 2011 2012
United Kingdom
FDI Outflows Brazil (millions US$) 26 249 816 582 990 1,334 3,315 2,176
FDI Outflows China (millions US$) 965 754 831 914 679 710 582 ..
CPI 8.6 8.6 8.4 7.7 7.7 7.6 7.8 74
CPI Rank 11 11 12 16 17 20 16 17
GDP (millions US$) 2,418,942 2,588,077 2,969,734 2,793,377 2,314,577 2,403,504 2,594,905 2,630,473
GDP per capita (US$) 40,048 42,534 48,428 45,195 37,166 38,293 41,020 41,295
Population (in thousands) 60,401,206 60,846,820 61,322,463 61,806,995 62,276,270 62,766,365 63,258,918 63,700,300
United States
FDI Outflows Brazil (millions US$) 3,673 2,192 2,851 2,207 1,277 5,348 5,572 13,509
FDI Outflows China (millions US$) 3,061 3,000 2,616 2,944 2,555 3,017 2,369 2,598
CPI 7.6 7.3 7.2 7.3 7.5 7.1 7.1 73
CPI Rank 17 20 20 18 19 22 24 19
GDP (millions US$) 13,093,726 13,855,888 14,477,635 14,718,582 14,418,739 14,964,372 15,517,926 16,155,255
GDP per capita (US$) 44,308 46,437 48,062 48,401 47,002 48,374 49,782 51,433
Population (in thousands) 295,516,599 298,379,912 301,231,207 304,093,966 306,771,529 309,346,863 311,718,857 314,102,623
5.1.4 Absolute difference in corruption level between FDI’s host and home country
First, a review was performed to observe the behavior of FDI inflows when compared to
the variance in the absolute difference in corruption level between FDI’s host and home
country, year on year for the period selected for this study.
Tables below show the result of the CPI and FDI Inflows variation calculated for each
year. Values were calculated comparing CPI and FDI inflows year on year data, negative values
(in parenthesis) represent decreases in comparison to the previous year and “n/a” was included
as a result when data was not available for one of the years analyzed.
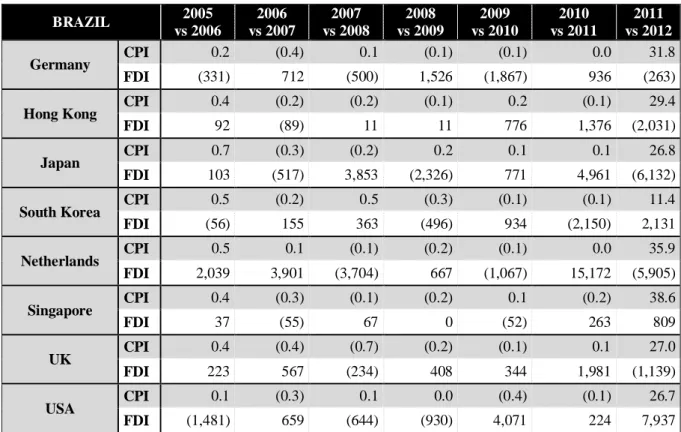
Table 7 – CPI and FDI inflows variance year on year - Brazil
BRAZIL 2005
vs 2006
2006 vs 2007
2007 vs 2008
2008 vs 2009
2009 vs 2010
2010 vs 2011
2011 vs 2012
Table 8 – CPI and FDI inflows variance year on year - China CHINA 2005 vs 2006 2006 vs 2007 2007 vs 2008 2008 vs 2009 2009 vs 2010 2010 vs 2011 2011 vs 2012
Germany CPI (0.3) (0.4) 0.0 0.1 0.0 0.0 35.6 FDI 1,720 (2,516) 166 317 (329) 241 322 Hong Kong CPI (0.1) (0.2) (0.3) 0.1 0.3 (0.1) 33.2 FDI 3,358 6,396 13,333 5,039 14,492 9,933 (4,939) Japan CPI 0.2 (0.3) (0.3) 0.4 0.2 0.1 30.6 FDI (1,771) (1,170) 63 453 (21) 2,246 1,022 South Korea CPI 0.0 (0.2) 0.4 (0.1) 0.0 (0.1) 15.2 FDI (1,273) (217) (543) (435) (8) (141) 487 Netherlands CPI 0.0 0.1 (0.2) 0.0 0.0 0.0 39.7 FDI (201) (226) 245 (121) 173 (153) 383 Singapore CPI (0.1) (0.3) (0.2) 0.0 0.2 (0.2) 42.4 FDI 146 835 1,250 (830) 1,823 669 208 UK CPI (0.1) (0.4) (0.8) 0.0 0.0 0.1 30.8 FDI (211) 77 83 (235) 31 (128) n/a USA CPI (0.4) (0.3) 0.0 0.2 (0.3) (0.1) 30.5 FDI (61) (384) 328 (389) 462 (648) 229 Source: Values calculated by the author of this thesis based on data presented in Tables 3, 4 and 6 presented in previous sections.
Based on the results demonstrated in the previous tables analysis were performed to
understand which was the relationship between positive and negative variances in the absolute
difference in corruption level of host and home country and the variance of FDI inflows.
Behavior observed when analyzing these two variables was classified using seven keys
as described below.
Table 9 – Keys used to analyze CPI’s absolute difference and FDI inflows
Key Description
A The absolute difference in CPI increased between compared years with a FDI inflow decrease in the same period.
B The absolute difference in CPI increased between compared years with a FDI inflow increase in the same period.
C The absolute difference in CPI decreased between compared years with a FDI inflow decrease in the same period.
D The absolute difference in CPI decreased between compared years with a FDI inflow increase in the same period.
E No change in the absolute difference in CPI was observed between compared years but FDI inflows decreased.
F No change in the absolute difference in CPI was observed between compared years but FDI inflows increased.
N/A Data was not available for one of the periods analyzed.
After identifying each of the results described in Tables 7 and 8 with the keys described
in Table 9, the incidence of each one was quantified in order to understand which was the most
common behavior and if any main relationship could be noted between these two variables.
Table 10 – Results per behavior of CPI’s absolute difference
BRAZIL CHINA
A+B C+D E+F N/A A+B C+D E+F N/A
Increase of CPI difference
18 - - - 11 - -
-Decrease of CPI difference
- 35 - - 30 -
-No change in CPI difference
- - 3 - - - 14
-N/A - - - 1
TOTAL 18 35 3 - 11 30 14 1
Source: Populated with data collected by the author of this thesis.
From the total population analyzed in 18 instances for Brazil and 11 for China the absolute
difference in the CPI for home and host country increased. From this population in 39% and
55%, for Brazil and China respectively, of the times this increase in CPI corresponded to a
decrease in FDI inflows (represented by key “A”).
In addition, in 35 instances for Brazil and 30 instances for China the absolute difference
in the CPI for home and host country decreased. From this population in 60% and 67% of the
cases, for Brazil and China respectively, this decrease in CPI corresponded to an increase in
FDI inflows (represented by key “D”).
From this first comparison, the conclusion is that an increase in the CPI difference seems
to have a negative impact on the FDI inflows, but a decrease of it has a greater impact.
Table 11 – Results obtained when analyzing the behavior of CPI’s absolute difference and FDI inflows
BRAZIL CHINA
A B C D E F N/A A B C D E F N/A
Germany 2 - 2 2 - 1 - - 1 1 1 1 3
-Hong Kong - 2 2 3 - - - - 1 1 5 - -
-Japan 1 3 2 1 - - - 2 2 1 2 - -
-South Korea 1 1 2 3 - - - 1 - 3 1 2 -
-Netherlands - 2 3 1 - 1 - 1 - - 2 3 1
-Singapore 1 1 1 4 - - - - 1 - 5 1 -
-UK - 2 2 3 - - - 1 - 1 2 1 1 1
USA 2 - - 4 1 - - 1 - 3 2 - 1
-TOTAL 7 11 14 21 1 2 - 6 5 10 20 8 6 1
From the results displayed in Table 11 it is possible to see that for the data collected to be
used for this analysis, the most common behavior was a decrease in the absolute difference in
CPI for home and host country corresponding to an increase in FDI inflows from the same
home country (represented by key “D”). This behavior represents 38% of the cases for Brazil
and 36% for China.
It can also be noted that in the case of China the home countries that had the movement
described above more frequently were Hong Kong and Singapore, both of which are not
members of the OECD. Another interesting characteristic to point out is that these countries
have a greater cultural proximity with China, what can explain the constant increase in
investment. Having a closer cultural proximity cause investors to need less time to understand
how business work in China, what is an advantage as this country is still somehow a closed
economy, as a lot of data and indexes are controlled by the Government.
However, for Brazil, this behavior was somehow equivalent between Hong Kong, South
Korea, Singapore, United Kingdom and United States, showing a mixture of OECD and
non-OECD countries behaving in the same manner.
On the other hand, it is also interesting to highlight that when an increase in the absolute
difference in the CPI for home and host country occurred only 13% and 11% of the cases for
Brazil and China, respectively, corresponded to a decrease in FDI inflows from the same home
country (represented by key “A”).
When further analyzing the data it is possible to formulate a hypothesis that movements
in the CPI difference somehow affects the FDI inflows. Nevertheless, when analyzing OECD
and non-OECD there is no clear relationship as the behavior observed for China and Brazil are
different, this formulates a different hypothesis to be explored that is if cultural differences
between the host and home country can collaborate to the behavior noted.
5.1.5 Greenfield investments
Further analysis were made to check if variations on CPI for the home country have a
direct relationship with the amount of Greenfield investment. Analysis focused on this type of
investment as for an investor to establish a new business in a different country involves getting
familiar with the country’s way of doing business, something that is not directly faced by
Table 12 – Announced value of Greenfield FDI projects
2005 2006 2007 2008 2009 2010 2011 2012
Brazil
(millions US$) 22,035 11,690 15,057 35,382 34,992 42,325 48,397 29,966
China
(millions US$) 82,292 119,842 102,479 121,728 109,169 96,128 105,741 78,568
Source: Data collected from UNCTADStat.
When analyzing the variance in the host countries’ CPI and the inflows destined to
Greenfield projects for the eight years period, in the case of Brazil there is no clear relationship
between changes in CPI and the Greenfield’s FDI inflows.
However, in the case of China it seems that Greenfield’s FDI inflows tend to respond
more positively (with an increase) to increases in its CPI, but to affirm that both variables have
a strong relation further and deeper analysis would have to be made.
5.2 PHASE 2 – QUALITATIVE ANALYSIS
The second phase of this research consisted in inquiring experienced professionals that
are somehow linked to the process of FDI analysis and decision. An online questionnaire was
created containing questions formulated base on the findings discussed in the previous sections
of this thesis (refer to Appendix III – Survey questionnaire), aiming to corroborate the
hypotheses formulated based on the quantitative analysis.
Characteristics and results of this questionnaire are described in the following
subsections.
5.2.1 Population used in the survey
The questionnaire was sent to a population of fifty-five professionals, being the majority
of them based in Brazil, with some based in the USA and in the Middle East.
The selected professionals act as Advisors for FDI transactions, Auditors, Investors,
Investment or Business analysts and others. They are also part of international corporations and
professional firms.
5.2.2 Survey questionnaire
The survey questionnaire was composed of thirteen questions, divided in three groups.
The first group had three questions and was designed to understand the professional profile of
the respondent. The second group included nine questions formulated based in the knowledge
data for Brazil and China, as detailed in section 5, on this thesis author’s professional experience
and on day-to-day discussions held with other experienced professionals. The third group had
one open question in which the respondent was asked to include any comments that he/she
considered important and that were not reflected in the answers of the two previous groups of
questions.
In the following sections, the analysis made based on the responses obtained in these three
groups’ questions are detailed.
5.2.3 Group one questions – Respondents’ professional profile
From a total population of fifty-five professionals, twenty-one responses were received.
In order to better understand the results presented a review of the respondents’ profile was done
and is demonstrated in the table below.
Table 13 – Respondents’ profile
Line of business:
Investor
Transaction Advisory
Services
Investment and/or Business
Analyst
Audit Other Total
Years of experience:
up to 5 years - - 1 - - 1 from 5 to 10 years - 3 - - - 3 from 10 to 15 years - 5 1 2 1 9 more than 15 years - 6 - 2 - 8 Total - 14 2 4 1 21
In which region you have had the majority of your work experience:
Asia (excl.. China) - - - - - -Brazil - 14 - 4 1 19 China - - - - - -Europe - - - - - -Latin America (excl.. Brazil) - - 1 - - 1 Middle East - - 1 - - 1 US/Canada - - - - - -Other (please specify) - - - - - -Total - 14 2 4 1 21
Source: Populated by the author of this thesis based on responses obtained in the survey.
The majority of answers received (67%) were from professionals engaged in rendering
transaction advisory services to investors willing to invest in other markets. Inputs from
professionals with this background are extremely valuable as they act as the link between the
host country investees and home country investors; these professionals have a clear view and a
It is also important to highlight that 81% of the respondents have more than 10 years of
professional experience, what means that their perception is formed based on reasonable time
series of facts, economic and business realities. This characteristic brought a valuable
contribution to this work as quantitative analysis (statistical) presented in the previous sections
were only preformed based on series of data for a period of time when economic and business
environment was more homogenous.
5.2.4 Group two questions - Technical questions
This group of questions is a technical based one. Questions presented in the survey were
designed to corroborate with professionals the indications and hypotheses observed in the
quantitative analysis previous discussed. The complete response report is included in
Appendixes IV and V.
The first question presented to respondents in this section was a generic one and the
intention was to capture the first impression of professionals on the subject without giving any
details on the kind of investment or any characteristics of the investor.
Table 14 – Q4. Is the level of corruption in Brazil and China, when being the host country, a primary factor in the Foreign Direct Investment (FDI) decision process?
Investor
Transaction Advisory
Services
Investment and/or Business
Analyst
Audit Other Total
Definitely yes - 1 2 - 1 4 18% Probably yes - 4 - 2 - 6 29% Might or might not - 5 - 1 - 6 29% Probably not - 4 - 1 - 5 24% Definitely not - - - - - - 0% Total - 14 2 4 1 21 100%
Source: Populated by the author of this thesis based on responses obtained in the survey.
In the table above it is possible to see that most respondents understand that the level of
corruption definitely is (18%) or probably is (29%) a primary factor in the FDI decision process.
Answers to the question above gave an indication that experienced professionals
understand that the level of corruption is taken into consideration when FDI is being analyzed,
but as mentioned before this was a straightforward question without details. Next questions in
Table 15 – Q5. Does the absolute difference in the corruption level between Brazil and China, when being the host country, and home country has more impact in the FDI decision process when this difference is greater? Investor Transaction Advisory Services Investment and/or Business Analyst
Audit Other Total
Definitely yes - 1 - - - 1 5% Probably yes - 8 2 1 1 12 57% Might or might not - 4 - 1 - 5 24% Probably not - 1 - 2 - 3 14% Definitely not - - - - - - 0% Total - 14 2 4 1 21 100%
Source: Populated by the author of this thesis based on responses obtained in the survey.
When professionals were questioned if the absolute difference in the corruption level
between the host and home country has more impact in the FDI decision process if this
difference is greater, responses were more concentrated in saying that it probably affect (57%).
Although this question had more details on which was the expected scenario of FDI analysis it
only showed a generic classification without getting to any business details or market
characteristics.
Table 16 – Q6. Does the interest of the investor in market share and presence increase supersedes the negative impacts of the corruption level in Brazil and China when FDI is being analyzed?
Investor Transaction Advisory Services Investment and/or Business Analyst
Audit Other Total
Strongly agree - 2 - 3 - 5 24% Agree - 7 1 - 1 9 43% Somewhat agree - 4 - - - 4 19% Neither agree nor disagree - 1 1 - - 2 10% Somewhat disagree - - - - - - 0% Disagree - - - 1 - 1 4% Strongly disagree - - - - - - 0% Total - 14 2 4 1 21 100%
Source: Populated by the author of this thesis based on responses obtained in the survey.
Question 6 presented to respondents a more specific question putting the interest of the
investor in market share and presence increase versus the negative impacts of the corruption
level in Brazil and China when FDI is being analyzed. In the responses, 24% of the
professionals strongly agree and 43% agree, totalizing 67% of the population, that needs and
Moreover, none of the respondents strongly disagreed and only one disagrees with the
question presented. This result left clear that from the professionals’ point of view when an
investor wants to increase its market share and/or presence in a certain market, even if they
consider the level of corruption in the decision process it will not be a main factor in the FDI
decision.
Table 17 – Q7. What is the importance of the corruption level in Brazil and China when FDI inflows are from countries that are a member of the OECD (Organisation for Economic Co-operation and Development)?
Investor
Transaction Advisory
Services
Investment and/or Business
Analyst
Audit Other Total
Extremely important - - - - 1 1 5% Very important - 9 2 2 - 13 62% Moderately important - 4 - 2 - 6 28% Slightly important - 1 - - - 1 5% Not at all important - - - - - - 0% Total - 14 2 4 1 21 100%
Source: Populated by the author of this thesis based on responses obtained in the survey.
Another aspect that was explored in the survey was the importance of corruption level to
investors from countries that are members of the OECD. The OECD is an organization that
promote action to improve the economic and social well-being, its’ members include many of
the world’s most advanced countries and some emerging countries (Brazil and China are not
members of the OECD). So intuitively, it would be expected that investors from these countries
would look for and/or be more comfortable investing in countries with a more regulated and
less corrupted environment.
According to the expectations, more than half of the responses (62%) indicates that the
level of corruption is a very important factor in the FDI investment decision when inflows are
from countries that are a member of the OECD. An additional 28% of the responses indicates
that it is moderately important and 5% that it is extremely important. So 95% of the respondents
believe that this is consider somehow important in the FDI decision process, these responses
reflect the fact that investors from countries that are members of the OECD probably have a
Table 18 – Q9. How are inflows from countries with strong laws against bribery abroad affected when considering investments in Brazil and China?
Investor Transaction Advisory Services Investment and/or Business Analyst
Audit Other Total
Negatively affected - 6 2 3 1 12 57% Not materially affected - 5 - - - 5 24% Positively affected - 3 - 1 - 4 19% Total - 14 2 4 1 21 100%
Source: Populated by the author of this thesis based on responses obtained in the survey.
To have a more clear view of how are inflows from countries with strong laws against
bribery abroad affected when considering investments in Brazil and China the subject was
cleared questioned in Question 9. In 57% of the answers, respondents were of the opinion that
the FDI inflows in this scenario are negatively affected.
Table 19 – Q8. Corruption scandals will have the following effect on foreign direct investments inflows
Investor Transaction Advisory Services Investment and/or Business Analyst
Audit Other Total
A decrease of inflows only in business
sectors directly involved - 6 1 2 - 9 43% A decrease in the total amount of inflows - 7 1 2 1 11 52% No significant effects - 1 - - - 1 5% Total - 14 2 4 1 21 100%
Source: Populated by the author of this thesis based on responses obtained in the survey.
Nevertheless, we know that even in countries with higher levels of corruption, some
business sectors are more susceptible to corruption, for innumerous reasons. Therefore, would
this fact decrease tolerance level from investors and impact FDI inflows generically or would
it only affect sectors that are more corrupted.
This was the main objective of Question 8, in this question respondents were asked how
corruption scandals would impact foreign direct investments inflows. The majority of
respondents (95%) said that it would cause an impact in the inflows and although more
professionals (52%) believe that, the total amount of FDI inflows would be affected a
considerable number (43%) think that only the business sectors directly involved would be
affected.
The last three questions of this group included more details regarding the return rate and