www.hydrol-earth-syst-sci.net/14/309/2010/ © Author(s) 2010. This work is distributed under the Creative Commons Attribution 3.0 License.
Earth System
Sciences
Less rain, more water in ponds: a remote sensing study of the
dynamics of surface waters from 1950 to present in pastoral Sahel
(Gourma region, Mali)
J. Gardelle, P. Hiernaux, L. Kergoat, and M. Grippa
Centre d’Etudes Spatiales de la BIOsph`ere (CESBIO), UMR 5126, UPS-CNRS-CNES-IRD, 18 avenue, Edouard Belin, b.p.i. 2801, 31401 Toulouse Cedex 9, France
Received: 23 June 2009 – Published in Hydrol. Earth Syst. Sci. Discuss.: 21 July 2009 Revised: 19 January 2010 – Accepted: 19 January 2010 – Published: 16 February 2010
Abstract. Changes in the flooded area of ponds in the Gourma region from 1950 to present are studied by remote sensing, in the general context of the current multi-decennial Sahel drought. The seasonal and interannual variations of the areas covered by surface water are assessed using multi-date and multi-sensor satellite images (SPOT, FORMOSAT, LANDSAT-MSS, –TM, and -ETM, CORONA, and MODIS) and aerial photographs (IGN). Water body classification is adapted to each type of spectral resolution, with or with-out a middle-infrared band, and each spatial resolution, us-ing linear unmixus-ing for mixed pixels of MODIS data. The high-frequency MODIS data document the seasonal cycle of flooded areas, with an abrupt rise early in wet season and a progressive decrease in the dry season. They also provide a base to study the inter-annual variability of the flooded areas, with sharp contrasts between dry years such as 2004 (low and early maximal area) and wetter years such as 2001 and 2002 (respectively high and late maximal area).The highest flooded area reached annually greatly depends on the vol-ume, intensity and timing of rain events. However, the over-all reduction by 20% of annual rains during the last 40 years is concomitant with an apparently paradoxical large increase in the area of surface water, starting from the 1970’s and ac-celerating in the mid 1980’s. Spectacular for the two study cases of Agoufou and Ebang Mallam, for which time series covering the 1954 to present period exist, this increase is also diagnosed at the regional scale from LANDSAT data span-ning 1972–2007. It reaches 108% between September 1975 and 2002 for 91 ponds identified in central Gourma. Ponds with turbid waters and no aquatic vegetation are mostly
re-Correspondence to:P. Hiernaux ([email protected])
sponsible for this increase, more pronounced in the centre and north of the study zone. Possible causes of the differ-ential changes in flooded areas are discussed in relation with the specifics in topography, soil texture and vegetation cover over the watersheds that feed each of the ponds. Changes in rain pattern and in ponds sedimentation are ruled out, and the impact of changes in land use, limited in the area, is found secondary, as opposed to what has often been advo-cated for in southern Sahel. Instead, major responsibility is attributed to increased runoff triggered by the lasting impact of the 1970–1980’s droughts on the vegetation and on the runoff system over the shallow soils prevailing over a third of the landscape.
1 Introduction
Soudanian and southern Sahelian zones (see also the review by Descroix et al., 2009, and reference therein). Moreover, field observations in central and northern Sahel in Mali (Ag Mahmoud, 1992; Hiernaux, unpublished data) suggest that, after the major droughts of the 1970’s and 1980’s, the flood of some temporary ponds extended longer over the dry sea-son or even that some of these ponds became permanent. In southern Sahel, near Niamey (Niger), the increase in areas cleared for cropping, following the demographic expansion of rural population was suggested as a possible explanation for this phenomenon often referred to as the “Sahelian para-dox”: less precipitation leading to increase in runoff and wa-ter table recharge (Leblanc et al., 2008; Favreau et al., 2009). However, similar clearing to expand the area cropped also oc-curred in the Soudanian zone, without producing an increase in runoff (Descroix et al., 2009). Moreover, this explana-tion does not hold for pastoral areas in central or northern Sahel, where cropping has a very limited extent. The extent to which the Sahelian paradox applies to central and northern Sahel is still an open question. Yet, assessing and monitoring the recent changes in water resources, and understanding the processes of these changes are critical for the economy and livelihood of the Sahel population. Unfortunately, quantita-tive information on rainfall, surface water, aquifers and land use is relatively scarce over this wide inland region.
The aim of this work is to document and discuss the evolu-tion of surface water bodies from the mid twentieth century onwards in the pastoral region of Gourma, in Mali. More precisely, the study focuses on the evolution of the flooded area of ponds over the 1954–2007 period. Given the scarcity of in-situ quantitative information, flood regimes are studied through series of remotely sensed data. This requires com-bining remote sensing information acquired by different sen-sors and different support, satellite and aerial, to establish a coherent picture of the evolution of the flooded areas. In par-ticular, the average size of the flooded ponds (at most a few hectares in the dry season) requires the use of high resolu-tion data, which is hardly compatible with a suitable time-sampling. Indeed, the flooded area of ponds strongly varies with time within a year (seasonal cycle) and display signif-icant year-to-year variability in responses to rainfall varia-tions. To date, attempts have been made to map the pond floods and to estimate flooded areas either at one date, at a relatively high spatial resolution on the basis of one LAND-SAT or SPOT-HRV image (Liebe et al., 2005; Lacaux et al., 2007) or at a lower resolution using time series of NOAA-AVHRR, SPOT-VGT or MODIS data (e.g. Gond et al., 2004; Haas et al., 2009; Verdin et al., 1996). Beside, the spectral response of surface water has received relatively little atten-tion so far in this region, with a few excepatten-tions like Lacaux et al. (2007). Combined to restrictions in sampling over time, the difficulty of using series of images with different resolu-tions and different spectral bands probably explains why no monitoring has been carried out so far, despite surface water being such a critical resource in the Sahel.
-300 -200 -100 0 100 200 300 400 500 19 36 19 41 19 46 19 51 19 56 19 61 19 66 19 71 19 76 19 81 19 86 19 91 19 96 20 01 20 06 An n u al r ai n fal l an o m al y ( mm
) Hombori, 1936-2008 (mean=375,2mm)
1970
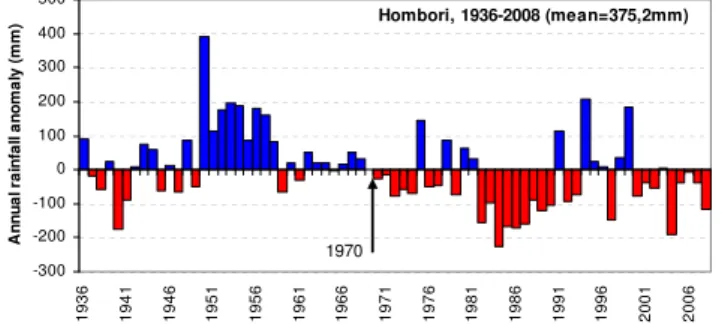
Fig. 1.Deviation of annual rainfall from the 1936–2008 average in Hombori (Mali), data by courtesy of DNM.
After a short description of the site’s characteristics and the available data sets in Sect. 2, classification methodolo-gies used to outline the extent of the flooded areas of ponds are presented in Sect. 3 as well as an assessment of the classi-fiers’ accuracy. Section 4 provides an analysis of the flooded area of ponds, which changes over time and space are char-acterized. Finally, the observed changes of in pond’s flood, in the mode of runoff in the Gourma region and their possible causes are discussed in Sect. 5.
2 Study area and data
2.1 The study site
The Gourma region is located in Eastern Mali, within the loop of the Niger River, down to the border with Burkina-Faso. It extends over the Sahelian bioclimatic gradient from 550-mm annual rainfall, in the south, to 150 mm in the north. Most of the ponds monitored in this study are located in the centre of the Gourma region, within the study site, referred as “supersite”, of the AMMA project (15.58–15.13◦N; 1.75–
1.33◦W) with mean annual rainfall ranging between 300 and
450 mm (Mougin et al., 2009). As elsewhere in the Sahel, the climate is tropical semi-arid with monsoonal rains falling be-tween late June and mid September followed by a long dry season (Frappart et al., 2009). Rainfall recorded at Hom-bori display the general pattern of the Sahel drought with a sharp contrast between the 1950’s and the 1980’s (Fig. 1). Indeed, rainfall of most years from 1970 onwards stand be-low the 1936–2008 average (375.2 mm±110.8) with
aver-age rainfall dropping by 20% from 422.2 mm prior 1970 to 336.2 mm since. Mean air temperature recorded at Hombori is 30.2◦C. The highest monthly value is observed in May (42◦C) whereas the lowest one is found in January (17.1◦C).
Fig. 2.LANDSAT ETM scene of the Gourma, with contours (yellow) delimiting areas where ponds are found (ponds are actually smaller than these contours). The scene is subdivided into three regions (separated by the C-S and N-C black lines), where ponds show different evolution with time (see text). Only the ponds explicitly mentioned in the text are labelled.
half of the landscape is covered by fixed sand dunes inher-ited from the arid periods of the Holocene. In valleys, a web of alluvial and lacustrine plains is also inherited from the humid periods, and has been segmented by the sand dunes cutting across valleys. The Gourma region is globally en-dorheic, but it harbours two runoff systems arranged in a mosaic as shown by the subset represented by the LAND-SAT image in Fig. 2. On the sandy soils (58% of the area, appearing in red–brown-green on the LANDSAT scene in Fig. 2), the endorheic system operates at short distance with limited sheet runoff from dune slopes to inter-dune depres-sions feeding ephemeral puddles not considered in this study. On the shallow soils associated to rock and iron pan out-crops (30% of the area, appearing in blue-white in Fig. 2), and on low-land fine-textured soils (12% of the area,
of streams (Ekia, Zalam-zalam, In Gariaten), or because of a slow down of the stream flow due to a physical obstacle, either rocky (Massi, Toundourou) or sandy (Gossi, Adjora). Attempts to control the out-flow of these two last ponds have been made by building concrete weirs at the downstream out-let in 2006, their impact on the pond flood is not commented in this paper. Down stream, final ponds are either located at the bottom of the alluvial or lacustrine plain (Kelma, Fossa, Alzouhra), or else at the foot of a natural dam most often due to sand dunes cutting across the valley (Agoufou, Dimamou, Doro). In the first case, pond are often surrounded by tem-porarily flooded alluvial plain which loamy clay soils are par-tially colonised by open forest of adapted tree species such asAcacia seyal(Kelma, In Orfan)Acacia nilotica(Ouart Fo-tou) or Anogeissus leiocarpus (Darawal). Following local perception and nomenclature (Ag Mahmoud, 1992), these temporarily flooded plains are not considered as ponds de-fined by a minimum water depth of 50 cm with drying up occurring before October, and thus, they are not included in this study. The flooded areas of the studied ponds vary from a few hectares to a few thousand hectares. Most of these ponds are temporary flooded, but there are a few permanent lakes such as Gossi, and more recently Agoufou, Ebang Mallam and Dimamou. Some of these ponds or lakes also feed local shallow water tables that complement the water resources for the Gourma population and their livestock in a region other-wise deprived of continuous aquifer (D´efossez, 1962).
The vegetation of the Gourma region is typical Sahelian with an herbaceous layer almost exclusively composed of annual plants, among which grasses dominate, and scattered bushes, shrubs and low trees (Boudet et al., 1971; Boudet, 1977; Hiernaux et al., 2009a). Almost continuous on sandy soils, except for a few deflation patches and bare dune crests, the herbaceous layer is highly discontinuous on shallow soils and clay plains, living large area bare of vegetation prone to runoff. The density and canopy cover of woody popu-lations are low in average (Hiernaux et al., 2009b). How-ever, there are concentrations of woody plants along drainage lines, around ponds, in the inter-dune depressions and also on shallow soils, with a regular pattern of narrow linear thickets set perpendicular to the slope known as “tiger bush” (Lep-run, 1992; Hiernaux and Gerard, 1999). These thickets live on the water and nutrients harvested on the impluvium made by the bare soil upstream, and their development efficiently limit runoff further downstream (d’Herbes et al., 1997). The economy of rural population is mostly pastoral, with various livestock management practices and seasonal mobility strate-gies (Boudet et al., 1971). In the southern half of the Gourma region, up to the surroundings of the Hombori mountains, husbandry is associated to some staple crops, mostly millet on sandy soils, and sorghum on finer textured soils. Yet, total land cropped in southern Gourma extends on less than 3% of the land (Cheula, 2009) and has not much expanded since the early 1970’s (Marie and Marie, 1974) and 1980’s (Bourn and Wint, 1985).
2.2 Data
Different types of images, with different spectral, temporal and spatial resolutions, have been employed to monitor the flooded area of ponds over the longest possible period. Be-fore the era of multi-spectral data acquisition with sensors onboard satellites (the first LANDSAT satellite was launched in 1972), images were acquired with airborne cameras or space-borne panchromatic sensors. Series of images from LANDSAT, SPOT, FORMOSAT, CORONA, MODIS have been collected over the Gourma region as well as aerial pho-tograph, as shown on Fig. 3, and detailed in Table 1. Two ponds, Agoufou and Ebang Mallam, are the two main “case studies” with intensive acquisition of high resolution data. Spatial extension over the central Gourma is obtained from less frequent high resolution satellite data: the full LAND-SAT archive was searched for images matching approxi-mately with the peak of the pond’s flood, resulting in two time series, the September time series consisting of images in 1975, 2001, 2002 and 2007, and the November time series consisting of 1972, 1984, 1986, 1999, 2002 and 2006. The September series offers the largest overlapping area, whereas the November series spans the longest time period.
The temporal resolution of the images is a major issue to study the long term dynamics of the pond’s flood. Indeed, the flood of ponds is highly seasonal in the Sahel, therefore to study interannual changes it is crucial to acquire images at same periods of the seasonal cycle. This seasonal cycle should be typically monitored with images every week, or at least every other week. Unfortunately, satellites with a daily or weekly repeat-pass have a coarser spectral resolution than those with 30-days frequency transit, and a compromise has to be found between temporal and spatial resolutions. The coarser resolution among the sets of data used in this study is of 250 m for MODIS images. The smallest flooded pond that could be classified with these images should have at least 25-ha area. All the other images employed have a spatial res-olution finer than 30 m (Table 1), allowing thereby mapping smaller flooded areas, down to 1 ha. Also, the spectral reso-lution, namely the ability of the sensor to differentiate bands in different wavelengths, widely varies from one sensor to another, the presence of a middle infrared channel being de-terminant to accurately classify pond waters partially covered by aquatic vegetation.
SPOT, LANDSAT and FORMOSAT images were already registered in the UTM zone 30 North projection using the WGS84 datum, whereas MODIS images (MOD09Q1, 250-m resolution NIR and red reflectance) were projected in sinu-soidal projection. All satellite data have been radiometrically corrected, but neither atmospheric nor viewing angles effects have been taken into account. The CORONA and aerial pho-tographs have been registered only locally, namely around a specific pond, using a registered SPOT-4 panchromatic im-age with a 5 m×5 m pixel size from 2005 as the reference. To
Table 1.Characteristics of the satellite and aerial images used in the study.
Satellite Sensor Spatial resolution Spectral resolution Year of acquisition Ground coverage Number of images
SPOT 1 HRV 20 m G, R, NIR 1990 60 km×60 km 2
SPOT 4 HRVIR 20 m G, R, NIR, MIR 2005–2006 60 km×60 km 14+5
FORMOSAT-2 8 m B, G, R, NIR 2007 24 km×24 km 30
MSS 57 m/60 m G, R, NIR 1972, 1975, 1984 3
LANDSAT TM 8.5 m/30 m B, G, R, NIR MIR 1986, 2006, 2007 170 km×180 km 2
ETM 28.5 m/30 m B, G, R, NIR, MIR 1999, 2001, 2002 5
Terra MODIS 250 m R, NIR 2000–2008 1200 km×1200 km 366
CORONA KH-4A 2.79 m PAN 1965 and 1966 17 km×230 km 8
Aerial photographs 1.06 m PAN 1954 and 1996 10 km×10 km 2
Fig. 3.Study site and frames of the different satellite and aerial images used to monitor ponds in the Gourma (Mali).
have been used and a second degree polynomial transforma-tion has been applied to each image.
Historical climate data (daily rainfall, minimum and max-imum temperature) for Hombori have been kindly provided by the national meteorological service (DNM). In addition, a web of manual and automatic rain gauges, and a set of au-tomatic meteorological stations have been deployed in the Gourma progressively since the inception of the AMMA project (Mougin et al., 2009; Frappart et al., 2009).
3 Methods
Table 2.Definitions of indexes, based on reflectance values in specific wavelengths. NIR stands for near infrared, MIR for middle infra-red.
Normalized Difference Vegetation Index Normalized Difference Turbidity Index Normalized Difference Pond Index
NDVI=ρnir−ρred
ρnir+ρred (1) NDTI=
ρred−ρgreen
ρred+ρgreen (2) NDPI=
ρmir−ρgreen
ρmir+ρgreen (3)
used for the classifications. The Normalized Difference Veg-etation Index (referred to as NDVI, Eq. 1 in Table 2), intro-duced by Rouse et al. (1973), is classically used to moni-tor the amount of vegetation. Puech (1994) used it to de-tect water bodies, and especially ponds with suspended sed-iment load. However, it is not suitable for separating terres-trial vegetation from aquatic vegetation. That is why Lacaux et al. (2007) have defined the Normalized Differenced Pond Index (NDPI, Eq.3 in Table 2), based on the very low re-flectance (about 15%) of water in the middle infrared wave-length. A Normalized Difference Turbidity Index (NDTI, Eq. 2 in Table 2) has also been used by these authors to eval-uate the level of turbidity of open water. It takes heed of the fact that turbid water tends to respond spectrally like bare soil, with low reflectance in the green wavelength, but high in the red one.
3.1 Spectral signatures of sahelian ponds
As suggested by Lacaux et al. (2007) for the ponds of the Ferlo region (Senegal), ponds in the Gourma can be sorted into 2 categories, showing a distinct spectral signature. In the following, these two types of flooded ponds are labelled according to the colour in which they appear on a classi-cal Red-Green-Blue false colour composite of Near Infrared-Red-Green spectral bands:
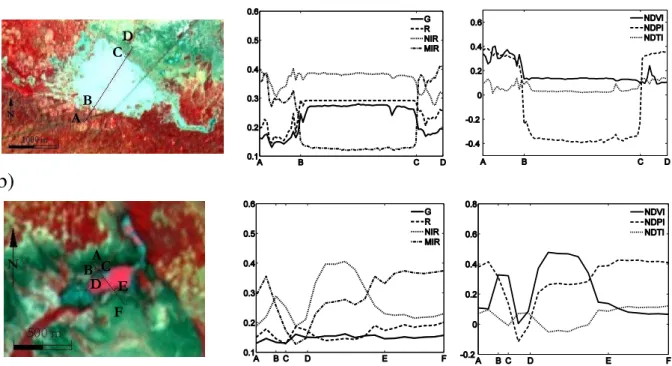
1. “blue” ponds, (Fig. 4a), have very turbid water, free of vegetation, with a low reflectance in the middle infrared wavelength. Flood in blue ponds can easily be detected because of the strong negative values of NDPI. Their spectral signature is invariant, whether during the rainy or dry season;
2. “red” ponds, (Fig. 4b), have less turbid water, at least partially covered with various aquatic plants, with high reflectance in the near infrared wavelength as well as high values of NDVI. Their spectral responses are there-fore very similar to that of vegetation, which makes them more difficult to identify. Reflectances in the mid-dle infrared are not as low as for the flooded “blue” ponds because of partial vegetation cover over the wa-ter surface, which reduce the wave absorption. Aquatic vegetation includes dense aquatic savannas dominated by sedges such asScirpus maritimus, or grasses such asOriza barthii,O. longistaminata,Echinochloa stagn-ina,Panicum subalbidum, that all spread in shallow wa-ter at the edge of the pools or on islands. In deeper
ponds aquatic vegetation is often limited to patches of plants that are rooted in the mud of the pond bed but have specialised organs such as floating stems ( Nelso-nia canescens), or leaves (Nymplea lotus,N. maculata, Eichhornia natans), dissected leaves that remain pho-tosynthetically active under a few centimetres of water (Ottelia ulvifolia, Najas pectinata,Rhamphycarpa fis-tulosa) and a few floating species (Nymphoides indica, Utricularia stellaris, Azolla pinnata), (Boudouresque, 1995). In addition to herbaceous aquatic plants tem-porary, flooded ponds can harbour some woody plants from species standing seasonal flood such asZiziphus mauritiana,Acacia niloticaandMitragyna inermis. Af-ter the first rains, the “red” ponds behave as “blue” ponds and turn “red” as aquatic vegetation develops later in the rainy season.
These different spectral signatures have been accounted for in the classification process described for each sensor in the following subsections.
3.2 Classification of SPOT-4 images (HR-VIR sensor)
The reflectance value for ‘blue’ ponds is very low in the mid-dle infrared wavelength, and the NDPI index is markedly negative. SPOT-4 imaging, with its middle infrared channel and its high spatial resolution is therefore very convenient to map the flood for this category of pond. As suggested by Lacaux et al. (2007), the classification of ponds was per-formed, using a decision tree, using a first threshold on the NDPI value and a second one on the reflectance in the mid-dle infrared wavelength. To determine thresholds values au-tomatically, a region of interest was defined in the centre of the flooded pond to be outlined. The average values of the NDPI and the MIR band within this region were then com-puted, and a tolerance was applied to those values to define the thresholds used for the classification (namely±0.1 for
the index values and±5% for the reflectance values).
3.3 Classification of FORMOSAT images
a)
A B
C D
b)
A B C
D E
F
Fig. 4. From left to right, color composite, radiometric transects and corresponding indexes values for the two categories of ponds, based
on a SPOT-4 image from 22 August 2005.(a)Agoufou, “blue” pond, turbid water without aquatic vegetation. A-B= vegetation on sand,
B-C= open water, C-D= rocky outcrop. The broken line crossing the image (SW to NE) corresponds to the road connecting Hombori to Gossi.
(b)Massi, “red” pond slightly turbid water with aquatic vegetation (center of the pond). A-B= rocky outcrop, B-C= vegetation, C-D= free
water, D-E= water covered with aquatic vegetation, E-F= rocky outcrop.
NDVI, Green and NDTI) in the centre of the pond and adding a tolerance to the result to obtain the thresholds above/below which a pixel was classified as “pond”.
3.4 Classification of LANDSAT images
LANDSAT images have the advantage of a wide ground cov-erage (Figs. 2 and 3), as well as a good spectral resolution, especially for TM and ETM images with two channels in the middle infrared wavelengths, which are very useful to de-tect water bodies. A supervised classification scheme was applied to TM and ETM series for September and Novem-ber to obtain a regional evaluation of the areas covered with water.
In order to compare the area flooded in the seventies and the eighties with more recent years, a supervised classifica-tion was also performed on the MSS scenes of 1972, 1975, and 1984. Following Liebe et al. (2005), up to nine types of flooded surfaces were identified, depending on the turbidity of the water and the presence or absence of aquatic herbs, or woody plants. Theses types were classified separately and then gathered into either turbid or clear waters. Temporary and superficially flooded plains on fine textured soil, with or without tree and vegetation cover were also classified and kept separated from ponds. Clouds and clouds shadows were manually masked.
3.5 Classification of MODIS images
Given the coarse spatial resolution (250 m) and the spectral resolution of MODIS images, (red and infrared channel only for this resolution), small ponds and “red” ponds are not monitored. In addition, since a pixel surface is equivalent to almost 7 ha, a classification based on pure pixels only may lead to a rough approximation of the effective pond’s surface for most ponds in the Gourma. Therefore, it was necessary to consider a sub-pixel classification to refine the result. The algorithm, which has been designed, consists first in defining a region of pure open water pixels and one of “dry” pixels (which can either be rainfed vegetation, or bare soils, or rock outcrops) surrounding the pond to be outlined. For each of these two regions, spatially averaged values are computed for both original channels (red and infrared) and NDVI values. All pixels with a NDVI value lower than the average of the “pure water” region are classified as “flooded pond”. Con-versely, pixels with NDVI values higher than average over “dry soil” are classified as “dry soil”. The pixels with NDVI in between are considered mixed pixel. The fraction of open water is assessed by the following linear un-mixing relation-ship:
of water in a mixed pixel is given by (1−k). This proportion is computed for all mixed pixels and summed to the pure open water pixels to assess the total pond area.
3.6 Classification of panchromatic images
Panchromatic images include aerial photographs as well as CORONA images, acquired in a mono-spectral mode. This prevents automatic detection of water bodies, which may be confused with rock outcrops or bare sands (Leblanc et al., 2008). Ponds were therefore outlined manually by an oper-ator, based on field experience and based on the comparison with the reflectance of the surroundings (texture, glint). As the result might be operator dependant, the delimitation pro-cess was made by different persons.
3.7 Assessments of the classifications
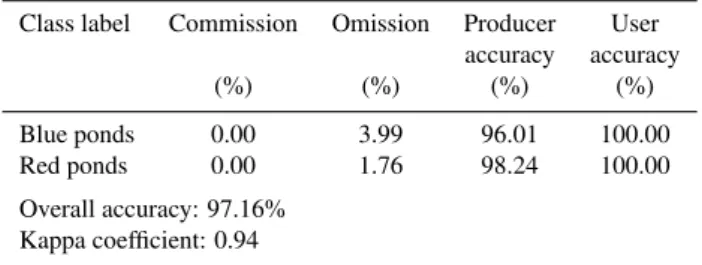
For most high spatial resolution images (CORONA, aerial pictures, FORMOSAT, SPOT and LANDSAT-MSS), the as-sessment of the classification is done visually, by overlap-ping the classified pond’s contour with the corresponding im-age. For LANDSAT TM and ETM, images, the accuracy of the maximum likelihood classifier is evaluated by compar-ing classified data with an independent set of soil, land use and vegetation cover maps resulting from field studies (Hier-naux, unpublished). These classifications proved to be quite precise, with an overall accuracy ranging from 97% to 99%, depending on the images. An example of the accuracy as-sessment is reported in Table 3.
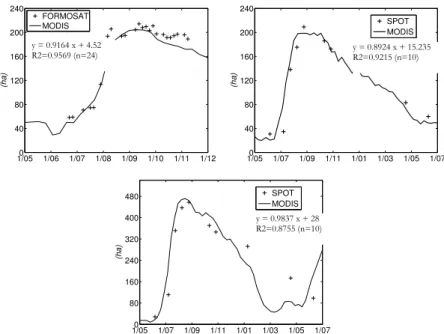
These evaluations are not possible in the case of MODIS images, for which a 200-ha water body contains few pure pixels (10–30, depending on the shape of the pond) and sev-eral mixed pixels that make the contour difficult to identify visually. Thus, surface variations computed from MODIS images have been compared to the results from high spatial resolution images, namely the FORMOSAT and SPOT times series in 2005, 2006 and 2007. The main outcomes are pre-sented in Fig. 5. During the rainy season, the variation of the flooded area derived from MODIS compare well with the area assessed with the other sensors, with a difference of less than 10%.
The agreement is weaker at the end of the dry season, with a relative difference reaching up to 78% in the worst cases. This is explained by the sharp decline of the num-ber of “pure water” pixels as the pond dries up. For most ponds, the classifications at the end of the dry season are thus based on mixed pixels and are therefore less accurate. Moreover, some ponds, like Ebang Mallam, split into sev-eral small ponds, which size may be smaller than the spa-tial resolution of MODIS. This is in line with previous stud-ies using moderate and low resolution sensors (Verdin et al., 1996; Gond et al., 2004; Haas et al., 2009), which concluded that surface estimation is accurate above a given threshold of
Table 3.Confusion matrix and accuracy estimators for the classifi-cation of a whole LANDSAT-ETM image with a maximum likeli-hood classifier (image collected on 29 October 1999).
Class label Commission Omission Producer User accuracy accuracy
(%) (%) (%) (%)
Blue ponds 0.00 3.99 96.01 100.00
Red ponds 0.00 1.76 98.24 100.00
Overall accuracy: 97.16% Kappa coefficient: 0.94
a few ha or tens of ha, allowing pure pixels to be present. Ponds’ size at the end of the wet season, typically from September to November, is therefore preferred to carry out the analysis of the long term changes of the flood in ponds.
4 Results
4.1 Seasonal variability
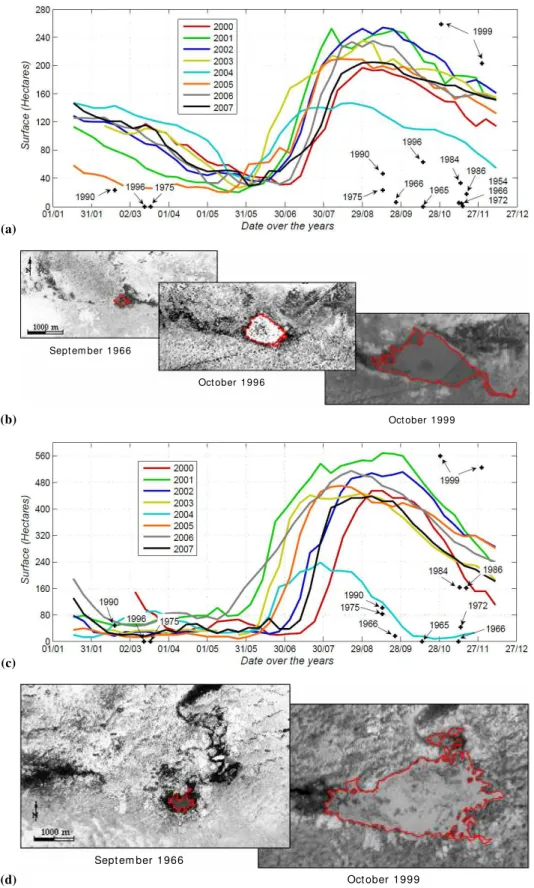
Rainfalls over the Gourma depend on the West African Mon-soon, with rains usually starting in June and ending in late September, sometimes not until October (Frappart et al., 2009). The flood regime of the ponds is closely related to the rainfall distribution and its spatial and inter-annual vari-ability. The monitoring of the seasonal cycle of Agoufou and Ebang Mallam with eight year of MODIS data shows that two phases can be distinguished (Fig. 6):
1. The rising up of the flood fed by surface runoff. There is an abrupt rise of the pond area generally occurring between June and July followed by marginal changes during the rest of the rainy season (August and Septem-ber).
2. The decrease of pond’s area, which is mostly due to evaporation, with some infiltration and, to a lesser ex-tent to the use by human for drinking, irrigation and livestock watering (Desconnets, 1994). Most ponds in the Gourma dry up between November and May.
4.2 Inter-annual variability
1/050 1/06 1/07 1/08 1/09 1/10 1/11 1/12 40
80 120 160 20
1/050 1/07 1/09 1/11 1/01 1/03 1/05 1/07 40
80 120 160 200 240
(ha)
SPOT MODIS 240
0
(ha)
FORMOSAT MODIS
y = 0.9164 x + 4.52
R2=0.9569 (n=24) y = 0.8924 x + 15.235R2=0.9215 (n=10)
1/050 1/07 1/09 1/11 1/01 1/03 1/05 1/07 80
160 240 320 400 480
(ha)
SPOT MODIS y = 0.9837 x + 28 R2=0.8755 (n=10)
Fig. 5.Comparison of ponds’ area derived from MODIS (curves) with area derived from SPOT-HRVIR and FORMOSAT-2 (point). Top is
Agoufou, bottom is Ebang Mallam.
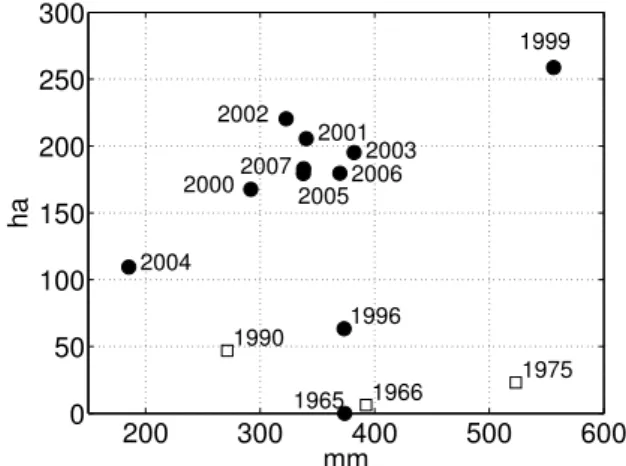
1999, which was an unusually wet year for the 1980–2000 period (Fig. 1), whereas it was minimum in 2004, a year char-acterized by a strong rainfall deficit over the Gourma, close to the major droughts of the 1970’ and 1980’. These two years excepted, the values of the flooded surface do not ap-pear to be widely scattered over the last 10 years: for cumu-lative rainfall ranging from 290 mm to 400 mm, the surface of Agoufou pond falls between 150 ha and 230 ha (Figs. 6 and 7) and Ebang Mallam falls between 300 ha and 500 ha (Fig. 6).
4.3 Changes in the flood regime of ponds
The analysis reported above provides a range of seasonal val-ues of flooded areas for the two ponds of Agoufou and Ebang Mallam. These values are compared to the few punctual esti-mations of flooded area available for the previous years (iso-lated points in Fig. 6). The comparison holds for estima-tions made at the same time of year and for similar rainfall amount. The evolution of the annual maximum of flooded area since the 1950’s is remarkable (Figs. 6, 7 and 8). Even when the seasonal and inter-annual variability are taken into account, the area of open water during the wet period, which preceded the drought of the 1970’s and 1980’s, turns out to be much smaller than the areas reached nowadays (Figs. 6 and 8). For example, the area flooded at Agoufou and Ebang Mallam only reached a few hectares in the sixties and sev-enties, and both ponds were drying up a couple of months after the last rains. For approximately the same cumulated rainfall value of 375 mm, the size of the water area is much larger nowadays than what it was in 1965 or 1996 (Fig. 7). Likewise, to reach a similar size, Ebang Mallam pond needed
twice more rainfalls in 1966 than in 2004. In 1990, the area of these two ponds increased to such an extent that open wa-ter remained during the whole dry season. The swelling of these pond flood does not match the onset (early 1970’s) nor the peak of the drought (mid 1980’s). It did not coincide ei-ther with the wetter years of (1991, 1994, 1996 and 1999) but preceded them, starting in the early 1970’s and accelerating in the late 1980’s. Moreover, the area flooded in both ponds continued to grow after 1990 to reach the present size. 4.4 A regional phenomenon
(a)
(b)
Sept em ber 1966
Oct ober 1996
Oct ober 1999
(c)
(d)
Sept em ber 1966
Oct ober 1999
300
200 300 400 500 600
0 50 100 150 200 250
ha
mm
975
1990 1996
1999
2000
2001 2002
2003
2004
20052006 2007
1 1966
1965
Fig. 7. Pond’s area versus annual precipitations for the pond of Agoufou, October data (full circle) and September data (open square).
Fig. 8.Successive contours of the pond of Agoufou, between 1966 and 2006, at the end of the rainy season, showing the remarkable increase of the pond.
The spatial distribution of the observed increase has been analyzed for the 2002–1975 paired classifications of Septem-ber images. The overall 108% area increase observed dur-ing this time interval results of different changes in flood area from each individual ponds as shown in Fig. 10. In-deed, 22 ponds had no flood increase but rather display a slight decrease, 6 increased by less than 50%, 14 by 50– 100% and 49 by more than 100%. When grouped by large geographic zones: erosion surfaces of northern Gourma, of central Gourma, and southern plains (Fig. 3), it appears that ponds’ flood spread at increasing rates from south to north (Fig. 11). Moreover, this expansion in the northern and cen-tral regions is mostly caused by the increase of area flooded with turbid waters (“blue” pond), while the area flooded with clear waters (“red” pond) display a lower increase; whereas in the southern plains, the small contribution of turbid wa-ters decreases slightly, while clear water increase by 57% (Fig. 11).
(a)
(b)
Fig. 9. (a)Average surface of water per pond (open square), av-erage surface of turbid water (full circle) for the 91 ponds present in all September Landsat images. Also figured is the surface of the Agoufou pond in September (line), derived from all data sources.
(b)Same as (a) but for November and for the 51 ponds present in
all November Landsat images.
The area increase of pond’s flood is a regional phe-nomenon, which displays a continuous spectrum of individ-ual responses (Fig. 10), with both the geographical position and the type of water (turbid/clear associated with the pres-ence of aquatic vegetation) explaining some of the inter-pond variability.
0 500 1000 1500 2000 2500 3000
-3
5
9
-2
4
1
-7
8
-3
0 -9 5 18 29 45 64 76 99
14
5
19
2
23
8
41
9
51
6
68
7
20
05
Change in pond flooded area (ha) from 1975 to 2002
P
ond
fl
oode
d a
re
a
in 2
0
0
2
(
ha
)
turbid water ('blue' pond)
water/aquatic plants ('red' pond)
Dimamou
Alzouha
Sabangou
Agoufou Ebang Mallam
Taylalelt
Fig. 10.The 91 ponds of central Gourma ranked by the absolute value of the change in flood area between 1975 and 2002 (x-axis, negative values indicate decrease in flood area, positive value increase), in relation with the area covered by the pond in 2002, separated into turbid water without vegetation (“blue” pond) and less turbid with aquatic vegetation (“red”pond).
0 2500 5000 7500 10000 12500 15000
1975 2002 1975 2002 1975 2002
Turbid water Clear water
North Centre South
Total flooded pond area (ha)
+ 168%
+ 233%
+ 125%
+ 370%
+ 13%
- 8%
+ 57%
+ 115%
+ 48%
Fig. 11.Change in areas flooded with clear or turbid water (91 ponds in total) observed between 14 September 1975 and 3 September 2002 in the Gourma. Relative rates of change are calculated for the overall flood and for both clear and turbid water. Ponds are grouped following their location in the Gourma (see map in Fig. 2).
5 Discussion
5.1 Technical considerations
The large time span over which ponds were monitored brought the main challenge of this study. It required the com-bination of information from aerial photos and satellite im-ages coming from a wide variety of sensors. The objective was to obtain coherent temporal information on the flooded areas of ponds in spite of the different quality, and the differ-ent spectral, temporal and spatial resolutions of those data. High spatial resolution images, such as SPOT or LAND-SAT, as well as FORMOSAT (but lacking middle infrared channel), provide accurate assessment of the flooded area of ponds, and thus trends of theses flooded areas over time. Panchromatic photos or images do not allow automatic de-tection of water bodies and hence photo-interpretation has been used to calculate flooded areas. In the Gourma region,
the observed changes over time were so large that these meth-ods were accurate enough. When using coarse resolution im-ages (MODIS), a threshold for accurate assessment of pond’s flood was determined. The algorithm developed to include mixed pixels proved less satisfactory when the area flooded gets inferior to 25 ha, but was accurate enough for larger wa-ter bodies (Fig. 5). Overall, the magnitude of the error made on the assessment of the flooded area of ponds, at least for the “blue” ponds, is small compared to the large increase ob-served for these ponds between the 1950’s and present time. 5.2 A paradoxical and uneven dynamics
centre and to the north of the Gourma than in the South, and more specifically in the depression that surround the Hom-bori mounts. Yet, there are individual ponds in the centre and north whose flooded areas have not increased much, and reciprocally, there are a few ponds in the south that have largely increased. These remote sensing outputs are also con-firmed by field observations: the death of woody plants in the deepest part of the pond following the anaerobic con-ditions due to a prolongation of the flood period was only observed in “blue” ponds; no change was observed either, on the shore line, nor on the topographic profile of the red ponds. The radiometric signature of the ponds is associated with both water turbidity and the presence of aquatic plants, which development is impeded by high turbidity. High tur-bidity in turn depends on the geological nature of the wa-tershed, schist producing more loam and clay alluvium than do sandstone and hard pan, and on the speed and the du-ration of the runoff flow. Some of the discrepancies in the flood change over years observed between “blue” and “red” ponds presumably arise from these differences. In addition, it is expected that rainfall variability causes inter-annual vari-ability in flooded areas of ponds, but this should vanish at decadal time scale (Frappart et al., 2009). A more persis-tent cause of variability in the observed changes may be re-lated to changes in connectivity of the runoff web. Indeed, structural modifications of the runoff system have been ob-served. Increasingly concentrated runoff accelerated water flows with the web of rills expanding upstream, while it deep-ened and broaddeep-ened the gullies downstream. Enhanced flow momentum, in turn, shortcuts some of the relay ponds, con-necting or reinforcing existing connections between water-sheds. This applies to Agoufou, which effective watershed in 1975 only extended over 32 km2. In 1986, it had ex-panded to 127 km2by connection of the watershed that was previously only feeding the Taylalelt ponds. It had expanded again by 41 km2in 2001 with the connection established to the west with the watershed that so far was only feeding the Sabangou ponds. However, such a change in watersheds connectivity does not explain the large area increase of the Agoufou pond, since the sum of all ponds in the total wa-tershed (Agoufou + Taylalelt + Sabangou) exhibits a large in-crease (Fig. 10). A change in watershed connectivity is part of the phenomenon affecting the flood regime of ponds in the Gourma region and each watershed has its own dynam-ics, regarding how connections can evolve depending on its topography and geomorphological traits.
5.3 What are the possible causes of the uneven increase in pond flooded areas?
In the Gourma region, increase in rainfall amount (Fig. 1) as well as increase in daily rainfall intensity can be ruled out as a direct cause. Indeed, Frappart et al. (2009) did not find any trend in rain per rainy day over 1950–2000. They found, however, a possible trend towards more intense rains
(rain per rainy day) in 2000–2007 compared to the previ-ous decades. Yet, this possible increase occurred well after pond’s increase in flooded area (starting in the early 1970’ and acceleration in the late 1980’). Unfortunately, more pre-cise analysis of rainfall intensity based the high frequency records are only available for more recent years, since the de-ployment of automatic rain gauges under the AMMA project. Increase of flooded areas of ponds might also be caused by sediments deposition. Sediment deposition in Gourma ponds certainly increased during the study period with increasing runoff and soil erosion but it should play a minor role in the flood area expansion of the major ponds because of the long time required for coarse alluvium to reach the outlet pond in this overall flat landscape.
Increased surface runoff is therefore the most plausible factor causing the observed increase of the pond flooded ar-eas in Gourma. This is in line with the incrar-eased runoff ob-served in other Sahelian regions (Mah´e et al., 2003, 2005a, b; Descroix et al., 2009). However, the unevenness of the increase in flooded areas would then be explained by the unevenness of the increase in soil surface runoff depending on whether the watershed is feeding “blue” or “red” ponds. Red ponds concentrate in the southern part of the Gourma re-gion, especially the watershed spreading from the sandstone plateaux of Hombori, but there are also some red ponds in central and northern Gourma, including large ones such as Dimamou, Doro and Karouassa (Fig. 2), which watershed have substantial schist substrate. Yet the fact that a number of the “red” ponds are located along a stream could explain their behaviour even under the hypothesis of increased runoff. In-deed, increased run-on could be evacuated as a downstream discharge or could be absorbed in the swelling of the sur-rounding flood plains without marked effect on the flood level and thus the flooded area of the pond. This expansion of flood in alluvial plains could in turn explain the expanding woody plant population at the edges of the low land open for-est observed since the mid 1980’s in most low land clay soil in Gourma plains (Hiernaux et al., 2009a). The contrasted flood dynamics between “blue” and “red” ponds would thus not imply local differences in runoff increase from rocky and shallow soils slopes but differences in the fate of runoff wa-ter between storing in ponds, temporal accumulation in flood plain, or rapid infiltration over sandy soils as observed in western Niger (Favreau et al., 2009).
5.4 What are the possible causes of the increase in surface runoff?
and trampling by livestock maintained longer, and in higher numbers, at the vicinity of settlements, can be advocated as leading factor of the increased runoff, as suggested for other regions of the Sahel such as in South-West Niger (Leblanc et al., 2008; Favreau et al., 2009). Indeed, crop fields (less than 3% of total land area) are confined to sandy soils that only marginally contribute to runoff. In addition to crops ex-pansion, degradation of vegetation cover may also be caused by wood harvesting to meet the needs of local population for domestic use. During the most severe years of the droughts (1972–1973 and 1983–1984), some people ended in harvest-ing and sellharvest-ing wood to buy millet in order to face the de-ficiency of their own millet crops. But again, the Gourma region does not seem to be concerned by the aspect of hu-man deforestation. Benjaminsen (1996) studied the evolu-tion of woody populaevolu-tion over the Malian Gourma, between 1955 and 1985, and came to the conclusion that the signifi-cant decrease in the number of trees in this area is only due to the drop in rainfalls, and that the domestic use of firewood could not be involved. Since then, the monitoring of woody plant populations from 1984 to present in the Gourma con-cludes to an overall increase both in density and cover of the woody population (Hiernaux et al., 2009a). There are how-ever important exceptions to this trend: the woody popula-tion located on shallow soils, over rock or hard pan outcrops, have experienced a continuous decline in density and cover, associated to a profound change in structure (Fig. 12 and Hi-ernaux et al., 2009a). For example, the “tiger bush” arrange-ment common on the hard pans of southern Sahel with dense thicket set perpendicular to the slope, have been decimated or dismantled (Roussel, 2009), and in this case replaced by totally different arrangements in which scattered shrubs set-tled along the rills and thus along the slopes. The rock out-crops, and associated shallow soils, extend on a third of the Gourma territory (Mougin et al., 2009), and they constitute the landscape units generating most of the runoff. In con-trast, the woody populations of the two other main types of landscape units, the sandy soils of dunes and valleys (55%) and the loamy clay soils of lowlands (12%) progressively re-generated after the losses due to the drought (Fig. 12). More-over, the herbaceous vegetation on sandy soils and on low-land clay soils monitored in Gourma revealed very resilient to droughts, with a fast reclamation of the production, within 2–5 years as observed in field surveys (see Fig. 5 in Hiernaux et al., 2009b) and by remote sensing (Tracol et al., 2006). On rock slopes and associated shallow soils, herbaceous layer only recovered partially since mid 1990’s in scattered patches set along the drainage lines and on thin sand depositions, of-fering little resistance to runoff. The persistent decline of herbaceous and woody vegetation cover on these rock out-crops and shallow soil has been monitored in the field, but is hardly quantifiable by remote sensing due to leaf area indexes reaching at most a few percents and to the extremely patchy distribution. Whether a future return to normal precipitation in the next decades could cause a reversal of flood size and
Canopy cover of woody plant populations (%)
10 20 30 40
C
o
v
e
r %
(c
la
y
)
2 4 6 8
C
ov
er
% (
s
hallow
, s
and)
Clay Shallow 0
1985 1990 1995 2000 2005 0 Sand
Fig. 12. Changes of the mean the canopy cover of woody
popu-lations over land clay soils (5 sites, left scale), dunes and low-land sandy soils (13 sites, right-scale) and eroded slopes shallow soils (4 sites, right scale) in the Gourma following the 1983–1984 drought (adapted from Hiernaux et al., 2009a).
regime in ponds, triggered by a recovering of vegetation on the shallow soil, is an important question for pastoral Sahel, which deserves dedicated monitoring.
6 Conclusions
Changes in the flooded area of ponds in the Gourma region were established through the use of date and multi-sensor satellite images. The actual classification process to outline the flood area of ponds has to be adapted to fit each type of spectral resolution (lack or presence of a middle infra-red band, panchromatic image) and spatial resolution (for a resolution coarser than 30-m mixed pixels had to be ac-counted for).
The outcomes enabled to document the seasonal dynam-ics of flooded area in ponds with the fast rising of the flood related to rainfall distribution followed by a slow retreat of the flood during the dry season for a majority of the ponds in the Gourma region. The year to year changes of the max-imum area flooded was quantified for two ponds (Agoufou and Ebang Mallam) that experienced a spectacular increase in flood level and duration, evolving from temporary to per-manent ponds. Indeed, for a same total rainfall of 380 mm at the end of October, the size of the pond of Agoufou has been multiplied threefold between 1996 and 2003. The flood evolution of these two ponds is at the larger end of the gen-eral behaviour of Gourma ponds, but it is typical of turbid ponds of the central zone. The results of this study showed an overall trend of flood increase from the 1950’s till present causing the flooded area of ponds observed at the peak of the flood to double from 1975 to 2002.
land use particularities of their watershed and the radiometric characteristics of their flood. The possible impact of crop-land expansion, limited in this region, and intensification of forestry and pastoral use were discussed and considered sec-ondary. Instead, it is argued that the lasting impact of the cli-matic droughts of the 1970’s and 1980’s on the herbaceous and woody plant vegetation over the shallow soils on rock and hard pan outcrops, and its consequences on the runoff system and the routing of the waters flows, are the main causes of this spectacular phenomenon.
Acknowledgements. The authors thank Eric Mougin, Niall Hanan and two anonymous reviewers for stimulating discussions. They thank Olivier Hagole for his help in providing satellite data (FORMOSAT) with the adapted corrections and Val´erie Trichon for providing the 1996 aerial photos. The authors are grateful to the Institut d’Economie Rurale (IER) and the Direction Nationale de la M´et´eorologie (DNM) for the collaboration in field data collection, and to the Institut de Recherche pour le D´eveloppement (IRD) Representation in Mali for all logistical support. Based on a French initiative, AMMA was built by an international scientific group and is currently funded by a large number of agencies, especially from France, the UK, the USA and Africa. It has been the beneficiary of a major financial contribution from the European Community’s Sixth Framework Research Programme.
Edited by: B. Schaefli
The publication of this article is financed by CNRS-INSU.
References
Ag Mahmoud, M.: Le haut Gourma Central, 2nd edn., edited by: Le Floc’h, R., CEFE/CNRS, Montpellier, 133 pp., 1992. Benjaminsen, T. A.: Bois-´energie, d´eboisement et s´echeresse au
Sahel: le cas du Gourma malien, S´echeresse, 7, 179–185, 1996. Boudet, G.: D´esertification ou remont´ee biologique au Sahel,
Cahiers ORSTOM, S´erie Biologie, 12, 293–300, 1977.
Boudet, G., Cortin, A., and Macher, H.: Esquisse pastorale et es-quisse de la transhumance de la r´egion du Gourma (Mali), DIWI, Essen, Germany, 120 pp., 1971.
Boudouresque, E.: La v´eg´etation aquatique du Liptako (R´epublique du Niger), thesis, Univ. Paris XI, Orsay, France, 391 pp., 1995. Bourn, D. and Wint, F.: Wet season distribution and abundance of
livestock populations and human habitants in the Gourma region of Mali, Resource Inventory and Management, St Hellier, Jersey, UK, 53 pp., 1985.
Cheula, A.: Dynamique de l’occupation des sols en milieu sah´elien. Espaces cultiv´es et couverture ligneuse dans la commune de Hombori, Mali. Mem.Master2 T´el´ed´etection et G´eomatique Ap-pliqu´ees `a l’Environnement, Univ. Paris Diderot, 44 pp., 2009.
d’Herb`es J.M., Valentin C., Thi`ery J.: La brousse tigr´ee au Niger: synth`ese des connaissances acquises. Hypoth`eses sur la gen`ese et les facteurs d´eterminants les diff´erentes structures contract´ees, in: Fonctionnement et gestion des ´ecosyst`emes forestiers con-tract´es sah´eliens, d’Herb`es, edited by: Ambouta, J. M. K. and Peltier, R., John Libbey Eurotext, Paris, 131–152, 1997.
D´efossez, M.: Contributions `a l’´etude g´eologique et
hy-drog´eologique de la boucle du Niger, M´emoire BRGM 13, Paris, 174 pp., 1962.
Desconnets, J.-C.: Typologie et caracterisation hydrologique des syst`emes endor´eiques en milieu Sah´elien (Niger-degr´e carr´e de Niamey), thesis, Univ. Montpellier II, France, 326 pp., 1994. Descroix, L., Mah´e, G., Lebel, T., Favreau, G., Galle, S.,
Gau-tier, E., Olivry, J. C., Albergel, J., Amogu, O., Cappelaere, B., Dessouassi, R., Diedhiou, A., Le Breton, E., Mamadou, I., and Sighomnou, D.: Spatio-temporal variability of hydrological regimes around the boundaries between Sahelian and Sudanian areas of West Africa: a synthesis, J. Hydrol., 375(1–2), 90–102, doi:10.1016/j.jhydrol.2008.12.012, 2009.
Dregne, H. E. and Chou, N. T.: Global desertification: dimensions and costs, in: Degradation and restoration of arid lands, edited by: Dregne, H. E., Texas Tech Univ., Lubbock, Texas, 249–282, 1992.
Favreau, G., Cappelaere, B., Massuel, S., Leblanc, M., Boucher, M., Boulain, N., and Leduc C.,: Land clearing, climate vari-ability, and water resources increase in semiarid south-west Niger, Africa: a review, Water Resour. Res., 45, W00A16, doi:10.1029/2007WR006785, 2009.
Frappart, F., Hiernaux, P., Guichard, F., Mougin, E., Ker-goat, L., Arjounin, M., Lavenu, F., Koit´e, M., Paturel,
J.-E., and Lebel, T.: Rainfall regime across the Sahel band
in the Gourma region, Mali, J. Hydrol., 375(1–2), 128–142, doi:10.1016/j.jhydrol.2009.03.007, 2009.
Gond, V., Bartholome, E., Ouattara, F., Nonguierma, A., and Bado, L.: Surveillance et cartographie des plans d’eau et des zones hu-mides et inondables en r´egions arides avec l’instrument VEGE-TATION embarqu´e sur SPOT4, Int. J. Remote Sens., 25(5), 987– 1004, 2004.
Haas, E. M., Bartholom´e, E., and Combal, B.: Time series analy-sis of optical remote sensing data for the mapping of temporary surface water bodies in sub-Saharan western Africa, J. Hydrol., 370(1–4), 52–63, doi:10.1016/j.jhydrol.2009.02.052, 2009. Hiernaux, P.: The crisis of sahelian pastoralism: ecological or
eco-nomic? Overseas Development Institute, London, Pastoral De-velopment Network, 39a, 20 pp., 1996.
Hiernaux, P., Diarra, L., Trichon, V., Mougin, E., Soumaguel, N., and Baup, F.: Woody plant population dynamics in response to climate changes from 1984 to 2006 in Sahel (Gourma, Mali), J. Hydrol., 375(1–2), 103–113, doi:10.1016/j.jhydrol.2009.01.043, 2009a.
Hiernaux, P., Mougin, E., Diarra, L., Soumaguel, N., Lavenu, F., Tracol, Y., and Diawara, M.: Sahelian Rangeland response to changes in rainfall over two decades in the Gourma, Mali, J. Hydrol., 375(1–2), 114–127, doi:10.1016/j.jhydrol.2008.11.005, 2009b.
Lacaux, J. P., Tourre, Y. M., Vignolles, C., Ndione, J. A., and Lafaye, M.: Classification of ponds from high-spatial resolution remote sensing: Application to Rift Valley Fever epidemics in Senegal, Remote Sens. Environ., 106, 66–74, 2007.
Leblanc, M., Favreau, G., Massuel, S., Tweed, S., Loireau, M., and Cappelaere, B.: Land clearance and hydrological change in the Sahel: SW Niger, Global Planet. Change, 61(4), 135–150, 2008. Leduc, C., Favreau, G., and Shroeter, P.,: Long term rise in a Sahe-lian water-table: the Continental Terminal in South-West Niger, J. Hydrol., 243, 43–54, 2001.
Leprun, J. C.: Etude de quelques brousses tigr´ees
sah´eliennes :structure, dynamique, ´ecologie: in L’aridit´e
une contrainte au d´eveloppement, edited by: Le Floc’h, E., Grouzis, M., Cornet, A., and Bille, J. C., Orstom Editions, Paris, 221–244, 1992.
Liebe, J., van de Giesen, N., and Andreini, M.: Estimation of small reservoir storage capacities in a semi-arid environment. A case study in the Upper East region of Ghana, Phys. Chem. Earth, 30, 448–454, 2005.
Mah´e, G., Leduc, C., Amani, A., Paturel, J. E., Girard, S., Servat, E., and Dezetter, A.: Augmentation du ruissellement de surface en r´egion soudano-sah´elienne et impact sur les resources en eau, in: Hydrology of Mediterranean and Semiarid regions, edited by: Servat, E., Najem, W., Leduc, C., and Shakeel, A., Proc. Conf., Montpellier, France, 003, IAHS Pub., 278, 215–222, 2003. Mah´e, G., Olivry, J. C., and Servat, E.: Sensibilit´e des cours d’eau
ouest africains aux changements climatiques et environnemen-taux : extrˆemes et paradoxes, in; Regional hydrological impacts of climatic change - hydroclimatic variability, Proceedings of symposium S6 held during the seventh IAHS scientific Assembly at Foz de Iguac¸u, Brazil, April 2005, IAHS pub., 296, 169–177, 2005a.
Mah´e, G., Paturel, J. E., Servat, E., Conway, D., and Dezetter, A.: The impact of land use on soil water holding capacity and river flow modelling in the Nakambe River, Burkina Faso, J. Hydrol., 300, 33–43, 2005b.
Marie, J. and Marie, J.: La r´egion de Hombori, Essais de g´eographie r´egionale en zone sah´elienne, M´em. Maitrise, Inst. G´eographie, Univ. Rouen, France, 300 pp., 1974.
Mougin, E., Hiernaux, P., Kergoat, L., Grippa, M., de Rosnay, P., Timouk, F., Le Dantec, V., Demarez, V., Lavenu, F., Ar-jounin, M., Lebel, T., Soumaguel, N., Ceschia, E., Mougenot, B., Baup, F., Frappart, F., Frison, P. L., Gardelle, J., Gruhier, C., Jarlan, L., Mangiarotti, S., Sanou, B., Tracol, Y., Guichard, F., Trichon, V., Diarra, L., Soumar´e, A., Koit´e, M., Demb´el´e, F., Lloyd, C., Hanan, N. P., Damesin, C., Delon, C., Serc¸a, D., Galy-Lacaux, C., Seghieri, J., Becerra, S., Dia, H., Gangneron, F., and Mazzega, P.: The AMMA-CATCH observatory site in Mali: relating climatic variations to changes in vegetation, sur-face hydrology, fluxes and natural resources, J. Hydrol., 375(1– 2), 14–33, 2009.
Nicholson, S. E.: Climate and environmental change in Africa dur-ing the last two centuries, Clim. Res., 14, 123–144, 2001. Olsson, L.: On the causes of famine: drought, desertification and
market failure in the Sudan, Ambio, 22, 395–403, 1993. Puech, C.: Plans d’eau sah´eliens et imagerie SPOT: inventaire et
´evaluation des capacit´es d’exploitation, in: Eau, Environnement et D´eveloppement, Intern. Coll. Nouakchott, 20–22 mars 1994. Roussel, L.: Suivi temporal de la couverture ligneuse au Sahel par
t´el´ed´etection `a tr`es haute r´esolution spatiale, Rapport de stage GGAT, Ecolab, Univ. P. Sabatier, Toulouse, 28 pp., 2009. Tracol, Y., Mougin, E., Jarlan, L., and Hiernaux, P.: Testing a
sahe-lian grassland functioning model against herbage mass measure-ments, Ecol. Model., 193, 437–446, 2006.
Rouse, J. W., Haas, R. H., Schell, J. A., and Deering, D. W.: Mon-itoring vegetation systems in the Great Plains with ERTS. Third ERTS Symposium, NASA SP-351 I, 309–317, 1973.