DENISE MACHADO MOURÃO
INFLUÊNCIA DE ALIMENTOS LÍQUIDOS E SÓLIDOS NA SACIAÇÃO E NA SACIEDADE
VIÇOSA
MINAS GERAIS – BRASIL 2006
DENISE MACHADO MOURÃO
INFLUÊNCIA DE ALIMENTOS LÍQUIDOS E SÓLIDOS NA SACIAÇÃO E NA SACIEDADE
Aprovada: 16 de março de 2006
_________________________ ____________________________ Profa Valeria P R Minim Profa Cristina M. G Chaves Dias (conselheira) (conselheira)
_________________________ ____________________________ Profa Rita C G Alfenas Profa Elizabethe Adriana Esteves
_________________________ Profa Josefina Bressan
(Orientadora)
A Deus, Ao Marcelo,
AGRADECIMENTOS
Na elaboração deste trabalho quero lembrar de todos que de alguma forma
contribuíram para a realização e conclusão do mesmo. Assim agradeço:
Ao meu marido Marcelo Ehlers Loureiro, que me acompanhou e ajudou todo
tempo de trabalho principalmente no exterior;
Aos meus pais, em especial minha mãe Arlete A. Machado Mourão e amigos
pessoais que mesmo de longe sofreram e torceram pelo meu trabalho;
Ao Prof. Richard Mattes e todo o grupo de pesquisa que proporcionaram a
realização da coleta de dados na Universidade de Purdue;
À minha orientadora aqui no Brasil, Josefina Bressan, pelo esforço de ajuda
para que este trabalho fosse realizado em Purdue, como era a minha vontade;
Às conselheiras e todos os membros da banca pelas correções e sugestões;
ÍNDICE
RESUMO...v
ABSTRACT...vii
INTRODUÇÃO GERAL... 1
REFERÊNCIAS...3
ARTIGO I - REVISÃO DE LITERATURA... 5
REFERÊNCIAS...11
ARTIGO II - PAPER... 15
Introduction...15 Methods...18 Results...25 Discussion...32 Acknowledgments...39 References...40 Appendix IA, IB and IC: Complete anthropometric characteristics of the participants for the protein, carbohydrate and fat experiments respectively... 45
Appendix II – Calculation of water volume gave to the participants to drink with the solid samples (Displacement technique): ... 48
Appendix III – Viscosity and Hardness measurements... 49
Appendix IV – Written instructions for the participants to eat the sample at the solid and liquid sessions. ... 51
Appendix V – Correlation between later consumption and score of the samples ... 52
FORMULÁRIOS UTLIZADOS NO ESTUDO E FOTOS PERTINENTES...53
Panfleto para recrutamento dos participantes...54
Questionário para triagem (seleção de participantes)...55
Termo de participação aprovado pelo comitê de ética de purdue ...76
Registro de pagamento individual...78
Escala para avaliação sensorial das amostras...79
Escala indicativa de plenitude gástrica / fome ...80
Teste de habilidade motora...81
Ficha do registro alimentar...82
Handout sobre porcionamento de alimentos...83
Perguntas utilizadas no electronic appetite rating systems (EARS)...85
Cabines de testes com sanduíches ...86
Porção dos alimentos servidos (versão liquida e sólida)...87
RESUMO
MOURAO, Denise Machado, D. S, Universidade Federal de Viçosa, marco de 2006. Influência de Alimentos Sólidos e Líquidos na Saciação e na Saciedade. Orientadora: Josefina Bressan. Conselheiros: Cristina M. Ganns Chaves Dias e Valeria Paula Rodrigues Minim.
Os alimentos podem ser classificados segundo suas diferenças sensoriais,
propriedades físicas e químicas. Dentre as propriedades físicas dos alimentos, a
consistência tem um papel importante na saciedade. O alto consumo de bebidas,
especialmente refrigerantes, tem sido apontado como um dos possíveis fatores
responsáveis pelo ganho de peso. Alguns autores observaram que alimentos sólidos
suprimem o apetite por um período de tempo maior do que alimentos líquidos, ao passo
que outros encontraram uma associação inversa. Porém, os dados encontrados na
literatura ainda não são conclusivos a respeito do assunto, bem como dos possíveis
mecanismos que estariam relacionados. Por isso, o presente trabalho objetivou verificar
a influência de alimentos líquidos e sólidos na ingestão alimentar de indivíduos com
peso normal e obesos, controlando os principais fatores que poderiam afetar a
interpretação dos resultados. O método de registro alimentar, juntamente com o
questionário de apetite aplicado na forma de um sistema eletrônico (Eletronic Appetite
Rating System – EARS), foram utilizados para verificar a saciação e saciedade dos
participantes (n=98), em três estudos com alimentos sólidos e líquidos, contendo um
macronutriente predominante. O tamanho amostral foi de quarenta participantes para os
estudos que os alimentos líquidos utilizados levaram os indivíduos a ter um maior
consumo calórico durante o almoço, e também ao logo do dia. De uma forma geral, a
saciação foi menor com líquidos no estudo com carboidrato, porém esta diferença foi
mais evidente nos indivíduos obesos no estudo com proteína. Uma menor saciedade dos
indivíduos foi verificada com o tratamento líquido no estudo com carboidrato.
Observou-se ainda, esta mesma tendência para os estudos com proteína e lipídio. Desta
maneira, o presente trabalho mostrou que alimentos líquidos têm uma fraca influência
no controle do apetite, sendo assim importante, por conseguinte, controlar o consumo
ABSTRACT
MOURAO, Denise Machado, D. S, Universidade Federal de Viçosa, March of 2006. Influence of liquid and solid foods on satiation and satiety. Adviser: Josefina Bressan. Committee Members: Cristina M. Ganns Chaves Dias and Valeria Paula Rodrigues Minim.
Foods can be classified according their sensory differences, and physical and
chemical structure. Among their physical characteristics, the consistence may play a
role on satiety. The increased consumption of energy-yielding beverages, especially
soft drinks, has been related to weight gain. Some studies have shown that solid foods
seem to suppress appetite longer than liquids. On the other hand, others have shown the
opposite. In fact, data from literature about this theme are not conclusive, likewise
involved mechanisms in this area have not been clearly defined. Thus, the main aim of
this study was to verify the influence of liquid and solid foods on energy intake,
controlling the potentially confounding factors seen in previous studies. In this way,
Electronic Appetite Rating System (EARS) was used to record participants’ appetite
sensations in three different macronutrient load experiments (n=98), each one using a
matched solid and liquid sample. Food records were used to evaluate later energy
intake. Sample size was n=40 for the protein and carbohydrate experiments, and n=18
for the fat. Participants had a tendency of higher energy intake during lunch and during
the day when received liquid load, compared to solid, in the three experiments.
Satiation was clearly smaller for the obese participants, with the liquid load, in the
carbohydrate experiment. This study shown liquid foods have a weaker influence on
appetite control, especially in a short term, compared to solid ones. Therefore, the
consumption of caloric liquid foods must be limited in the prevention and treatment of
INTRODUÇÃO GERAL
Em nossa sociedade, cada vez mais industrializada, tem-se verificado a
redução da atividade física dos indivíduos e o aumento da ingestão de alimentos de
fácil e rápido consumo. Muitos pesquisadores têm atribuído o crescimento da
obesidade a estes fatores (Nicklas et al., 2001; Cutler et al., 2003; Chou et al., 2004;
Drewnowski & Specter, 2004; Drewnowski & Darmon, 2005; Foster et al., 2005). Por
conseguinte, tem sido feita uma grande revisão dos mecanismos envolvidos no
alarmante crescimento da obesidade, objetivando-se, entre outros, reduzir as graves
conseqüências médicas relacionadas à obesidade e sua sobrecarga nos sistemas de saúde mundiais (Bray, 2005; Gregg et al., 2005).
O alto consumo de bebidas, especialmente refrigerantes, tem sido relacionado
ao ganho de peso (De Castro, 1993; Mattes, 1996; Johnson & Frary, 2001;
Almiron-Roig et al., 2003; WHO, 2003; Jurgens et al., 2005; Mattes et al., 2005). Existe uma
hipótese de que as calorias provenientes de líquidos favorecem uma compensação
dietética fraca, quando comparadas às de alimentos sólidos. Acrescenta-se que a
adição de energia à dieta proveniente dos líquidos poderia aumentar a ingestão
energética total. Isto foi demonstrado para café, bebidas alcoólicas, refrigerante, suco
de fruta e leite (De Castro, 1993; Mattes, 1996).
Diante da existência de alguns trabalhos que apontam para a possibilidade de
que alimentos sólidos provoquem maior saciedade que líquidos, embora não de forma
clara e/ou conclusiva, e da existência de outros que contradizem esta hipótese, foi
e sólidos na ingestão alimentar de indivíduos de peso normal e obesos; controlando os
potencias fatores que poderiam afetar e/ou influenciar a interpretação dos resultados.
Esta tese foi, então, dividida em duas partes: uma revisão de literatura,
apontando os principais fatores relacionados aos possíveis mecanismos que poderiam
interferir na ingestão de alimentos sólidos e líquidos, e suas implicações na saciedade;
e uma descrição de todo o trabalho realizado na Universidade de Purdue, EUA, e dos
REFERÊNCIAS
Almiron-Roig E, Chen Y & Drewnowski A (2003) Liquid calories and the failure of satiety: how good is the evidence? Obes Rev4, 201-212.
Bray GA (2005) Medical consequences of Obesity. The Journal of Clinical Endocrinology & Metabolism89, 2583-2589.
Chou SY, Grossman M & Saffer H (2004) An economic analysis of adult obesity: results from the Behavioral Risk Factor Surveillance System. J Health Econ 23, 565-587.
Cutler DM, Glaeser EL & Shapiro JM (2003) Why have americans become more obese? Journal of Economic Perspectives17, 93-118.
De Castro JM (1993) The effects of the spontaneous ingestion of particular foods or beverages on the meal pattern and overall nutrient intake of humans. Physiol Behav53, 1133-1144.
Drewnowski A & Darmon N (2005) The economics of obesity: dietary energy density and energy cost. Am J Clin Nutr82, 265S-273S.
Drewnowski A & Specter SE (2004) Poverty and obesity: the role of energy density and energy costs. Am J Clin Nutr79, 6-16.
Foster GD, Makris AP & Bailer BA (2005) Behavioral treatment of obesity. Am J Clin Nutr82, 230S-235S.
Gregg EW, Cheng YJ, Cadwell BL, Imperatore G, Williams DE, Flegal KM, Narayan KM & Williamson DF (2005) Secular trends in cardiovascular disease risk factors according to body mass index in US adults. Jama293, 1868-1874. Johnson RK & Frary C (2001) Choose beverages and foods to moderate your intake
of sugars: the 2000 dietary guidelines for Americans--what's all the fuss about? J Nutr131, 2766S-2771S.
Jurgens H, Haass W, Castaneda TR, Schurmann A, Koebnick C, Dombrowski F, Otto B, Nawrocki AR, Scherer PE, Spranger J, Ristow M, Joost HG, Havel PJ & Tschop MH (2005) Consuming fructose-sweetened beverages increases body adiposity in mice. Obes Res13, 1146-1156.
Mattes RD (1996) Dietary compensation by humans for supplemental energy provided as ethanol or carbohydrate in fluids. Physiol Behav59, 179-187. Mattes RD, Hollis J, Hayes D & Stunkard AJ (2005) Appetite: measurement and
Nicklas TA, Baranowski T, Cullen KW & Berenson G (2001) Eating patterns, dietary quality and obesity. J Am Coll Nutr20, 599-608.
ARTIGO I - REVISÃO DE LITERATURA
A crescente incidência da obesidade vem cada vez mais preocupando as
autoridades ligadas à área da saúde e a população mundial. Nos últimos anos, alguns
trabalhos tentaram mostrar a relação o estado em que o alimento é ingerido e o ganho
de peso corporal (Crapo & Henry, 1988; DiMeglio & Mattes, 2000).
Os alimentos podem ser classificados segundo suas diferenças sensoriais,
propriedades físicas e químicas, as quais contribuem para a regulação do
comportamento alimentar, e também para regulação do metabolismo energético.
Dentre as propriedades físicas dos alimentos, a consistência parece tem papel
importante na saciedade (Santangelo et al., 1998), e no gasto energético (Habas &
Macdonald, 1998).
Segundo a Organização Mundial de Saúde, os alimentos líquidos levam a um
maior ganho de peso corporal (WHO, 2003). Alguns autores observaram que a
ingestão de alimentos sólidos parece suprimir o apetite por um período de tempo
maior do que alimentos líquidos (Bolton et al., 1981; Tournier & Louis-Sylvestre,
1991; Hulshof et al.), ao passo que outros encontraram uma associação inversa
(Kissileff, 1984; Kissileff, 1985; Rolls et al., 1990). Porém, os estudos que apontam
para esta hipótese ainda não são conclusivos, bem como os possíveis mecanismos que
estariam relacionados a ela.
O alto consumo de bebidas, especialmente refrigerantes, tem sido apontado
por pesquisadores como um dos possíveis fatores que leva ao ganho de peso. A
favoreceriam um consumo calórico maior, em relação aos alimentos sólidos. Esta
hipótese pôde ser verificada após a manipulação da composição de energia em
alimentos com diferentes estruturas físicas, tendo havido uma compensação calórica
(redução no consumo) maior após o consumo de alimentos sólidos, seguido de
alimentos semi-sólidos e líquidos. Assim, acrescenta-se que a adição de calorias à
dieta proveniente dos líquidos possa aumentar a ingestão energética total. Isto foi
demonstrado para café, bebidas alcoólicas, refrigerante, suco de fruta e leite (De
Castro, 1993; Mattes, 1996).
Outros fatores relacionados às características do alimento, como viscosidade,
também foram relacionados com alterações na ingestão alimentar. Uma maior
viscosidade retardaria o esvaziamento gástrico, aumentando, assim, o tempo de
saciedade (Marciani et al., 2000).
A ausência da mastigação, que ocorre quando ingerimos alimentos líquidos,
também tem sido apontada como um fator que contribuiria para a menor saciedade. O
tempo de exposição aos receptores orofaríngeos, intimamente ligados ao controle dos
centros da fome a da saciedade, para os alimentos sólidos é muito maior do que para
líquidos. Em ratos, verificou-se que o ato mecânico da mastigação promove a
saciedade, especialmente em animais magros, quando comparados aos obesos
(Sakata, 1995; Fujise et al., 1998). Mais recentemente verificou-se que a mastigação
ativa a liberação de histamina, a qual suprime fisiologicamente a ingestão alimentar,
pela ativação dos centros de saciedade no hipotálamo. Com isso, há uma redução
tanto o volume, quanto da velocidade de alimento ingerido, e ainda, um aumento da
lipólise, particularmente em adipócitos viscerais, e aumento da expressão gênica das
Ainda são limitadas as informações que possibilitariam esclarecer a relação
entre a taxa de esvaziamento gástrico e a secreção de hormônios gastrointestinais,
mediados pelo efeito da consistência dos alimentos, relacionado a sinais de saciedade.
O que já é conhecido é que a liberação de líquidos pelo estômago é mais rápida do
que de sólidos (Read & Houghton, 1989). Entretanto, em refeições contendo
quantidades normais de componentes sólidos e líquidos, há uma produção de solução
viscosa na qual as partículas sólidas ficam suspensas, à medida que esses
componentes são misturados na boca e no estômago. Um aumento da viscosidade do
conteúdo gástrico reduz a sedimentação dos sólidos no líquido, e dificulta, assim, a
habilidade preferencial que o antro tem em esvaziar-se mais rapidamente de líquidos
do que de sólidos (Vincent et al., 1995). Contudo, independentemente do tipo de
alimento consumido, uma correlação negativa foi observada entre a taxa de
esvaziamento gástrico e saciedade (Bergmann et al., 1992).
Influências cognitivas também devem ser consideradas como um fator
importante na regulação da ingestão alimentar. As áreas do cérebro onde o prazer ou
valores afetivos relacionados ao cheiro e gosto estão intimamente relacionadas às
áreas que envolvem as emoções (Rolls, 2005). Assim, ao longo dos anos,
"aprendemos" que ao consumir uma bebida estamos satisfazendo a nossa sensação de
sede, e não a de fome. Outro ponto a ser considerado aqui é o fato de que a ingestão
de uma bebida geralmente ocorre junto com uma refeição, ou em intervalos ao longo
do dia, e não em substituição a uma refeição principal. Desta forma, o fator cognitivo
também pode influenciar fortemente a ingestão alimentar.
A palatabilidade, avaliação hedônica das propriedades sensoriais de um
determinante fator na seleção e ingestão de alimentos em humanos. Vários trabalhos
mostraram uma menor ingestão de alimentos não palatáveis, quando comparados aos
palatáveis (Kauffman et al., 1995; Yeomans & Gray, 1996; Yeomans et al., 1997;
Yeomans & Symes, 1999; Sawaya et al., 2001). Este último estudo ainda sugeriu que
pessoas com sobrepeso são mais susceptíveis à escolha de um alimento palatável, que
geralmente tem mais calorias, levando, possivelmente a um aumento do peso
corporal. Ainda, estudos mostraram que dietas não palatáveis promovem um estímulo
reduzido do sistema nervoso simpático (SNS), especialmente na fase inicial (cefálica)
do processo de alimentação, podendo assim haver uma resposta diferenciada na
termogênese (LeBlanc & Brondel, 1985).
Com relação ao gasto energético, poucos trabalhos foram desenvolvidos,
associando esta variável e ao estado físico do alimento (Crapo & Henry, 1988;
Robinson & York, 1988; Habas & Macdonald, 1998), sendo que nenhum deles
conseguiu isolar completamente a variação do estado físico do alimento, sólido e
líquido, investigando, assim, seu real efeito no metabolismo energético. Num dos
primeiros estudos, em que foi verificado o efeito de alimentos sólidos e líquidos na
termogênese, foi encontrada uma maior resposta no metabolismo de repouso, após a
ingestão de alimento sólido. Contudo, esta dieta foi mais aceita que a fórmula líquida
utilizada (Robinson & York, 1988). Posteriormente, Habas e Macdonald (1998)
encontraram um maior gasto energético, glicose e insulina plasmática, após o
consumo da dieta teste, na forma sólida. Entretanto, a dieta líquida usada neste estudo
foi hipertônica, o que pode ter levado a um retardo no esvaziamento gástrico,
Uma das grandes dificuldades em se estudar este tema está relacionada à
grande variedade de fatores que podem influenciar este tipo de estudo. Testar uma
mesma formulação alimentícia ou uma composição de alimentos nas formas, líquida e
sólida, de maneira que não haja uma diferença a ser considerada na densidade
calórica, distribuição e perfil de macronutrientes, osmolalidade, volume, e outros, é
uma tarefa difícil, e que ainda não foi realizada.
Deveríamos considerar, ainda, que mecanismos neurais, assim como a
presença de produtos da digestão no duodeno, especialmente gordura e aminoácidos
que estimulam a secreção de vários hormônios gastrointestinais, como a
colecistocinina (CCK), têm demonstrado ter um importante papel na regulação da
ingestão alimentar (Moran, 2000).
Um aumento no metabolismo basal, seguido à ingestão de glicose, está
associado a uma elevação da concentração plasmática de adrenalina e noradrenalina,
indicando um aumento na estimulação do sistema nervoso simpático (Welle et al.,
1981). Em 1998, alguns autores verificaram que a concentração plasmática de
noradrenalina apresentou tendência em ficar mais elevada, após a ingestão de
alimento sólido, em comparação aos líquidos; a concentração de adrenalina, ao
contrário, tendeu a reduzir (Habas & Macdonald, 1998).
Alguns estudos consideram que a concentração plasmática de adrenalina, e
não a de noradrenalina, está reduzida em indivíduos obesos, em repouso, após
estimulação (Young & Macdonald, 1992). Entretanto, estudos com pré-obesos e
pós-obesos indicaram que uma diminuição na estimulação da secreção de adrenalina, em
em indivíduos pré-obesos (Zurlo et al., 1990; Astrup et al., 1994; Raben & Astrup,
1996).
A leptina também tem demonstrado possuir forte influência na ingestão
alimentar. Ela promove o decréscimo do consumo, pela sinalização da saciedade no
cérebro (Karhunen et al., 1998). Em humanos, a leptina está associada ao peso
corporal, índice de massa corporal (IMC), e percentual de gordura corporal (GCT),
sendo que uma falha na produção de leptina ou uma resistência à sua ação pode
resultar em aumento de peso corporal (Raben & Astrup, 2000). Assim, a leptina
parece estar aumentada com o excesso de peso crônico, e reduzida em jejuns
prolongados ou restrições calóricas. Dietas ricas em lipídios proporcionam um
aumento significativo na concentração sérica de leptina, porém isso não ocorre com o
aumento das calorias totais ingeridas, ou dietas hiperprotéicas (Ahren et al., 1997;
Cooling et al., 1998).
A grelina, um peptídeo cérebro-intestinal, é outro exemplo de hormônio
também importante na regulaçãotanto do metabolismo energético quanto da ingestão
alimentar (Wang et al., 2002). Em estudos onde a grelina foi administrada em ratos
observou-se um aumento do quociente respiratório (RQ), sugerindo uma mudança em
direção a glicólise, ao invés da oxidação de ácidos graxos, favorecendo assim a
adiposidade e o ganho de peso (Tschop et al., 2000). Outros efeitos da grelina foram
demonstrados, como estimulação da motilidade gástrica e secreção ácida (Masuda et
al., 2000), estímulo do apetite (Wren et al., 2000; Wren et al., 2001), entre outros. Em
humanos, os níveis plasmáticos de grelina parecem estar aumentados no jejum
(Tschop et al., 2000; Cummings et al., 2001) e, ao contrário do que se esperava,
decréscimo na concentração plasmática de grelina em obesos seria de que este achado
estaria refletindo uma adaptação fisiológica ao balanço energético positivo associado
à obesidade (Tschop et al., 2001b). Tem sido proposto, ainda, que a grelina é um
hormônio que contribui para a iniciação de uma refeição, uma vez que seus níveis
plasmáticos parecem estar aumentados, antes de uma refeição (Cummings et al.,
2001) e, diminuídos, logo após a ingestão (Tschop et al., 2001a).
Assim, muitos fatores podem interferir na regulação da ingestão alimentar,
com relação ao estado físico do alimento, e como ainda existem muitas controvérsias
sobre este tema, verifica-se a necessidade do desenvolvimento de mais estudos sobre
REFERÊNCIAS
Ahren B, Mansson S, Gingerich RL & Havel PJ (1997) Regulation of plasma leptin in mice: influence of age, high-fat diet, and fasting. Am J Physiol273, R113-120. Astrup A, Buemann B, Christensen NJ & Toubro S (1994) Failure to increase lipid
oxidation in response to increasing dietary fat content in formerly obese women. Am J Physiol266, E592-599.
Bergmann JF, Chassany O, Petit A, Triki R, Caulin C & Segrestaa JM (1992) Correlation between echographic gastric emptying and appetite: influence of psyllium. Gut33, 1042-1043.
Bolton RP, Heaton KW & Burroughs LF (1981) The role of dietary fiber in satiety, glucose, and insulin: studies with fruit and fruit juice. Am J Clin Nutr34, 211-217.
Cooling J, Barth J & Blundell J (1998) The high-fat phenotype: is leptin involved in the adaptive response to a high fat (high energy) diet? Int J Obes Relat Metab Disord22, 1132-1135.
Crapo PA & Henry RR (1988) Postprandial metabolic responses to the influence of food form. Am J Clin Nutr48, 560-564.
Cummings DE, Purnell JQ, Frayo RS, Schmidova K, Wisse BE & Weigle DS (2001) A Preprandial Rise in Plasma Ghrelin Levels Suggests a Role in Meal Initiation in Humans. Diabetes50, 1714-1719.
De Castro J (1993) The effects of the spontaneous ingestion of particular foods or beverages on the meal pattern and overall nutrient intake of humans. Physiol Behav53, 1133-1144.
DiMeglio DP & Mattes RD (2000) Liquid versus solid carbohydrate: effects on food intake and body weight. Int J Obes Relat Metab Disord24, 794-800.
Fujise T, Yoshimatsu H, Kurokawa M, Oohara A, Kang M, Nakata M & Sakata T (1998) Satiation and masticatory function modulated by brain histamine in rats. Proc Soc Exp Biol Med217, 228-234.
Habas ME & Macdonald IA (1998) Metabolic and cardiovascular responses to liquid and solid test meals. Br J Nutr79, 241-247.
Karhunen LJ, Lappalainen RI, Haffner SM, Valve RH, Tuorila H, Miettinen H & Uusitupa MI (1998) Serum leptin, food intake and preferences for sugar and fat in obese women. Int J Obes Relat Metab Disord22, 819-821.
Kauffman NA, Herman CP & Polivy J (1995) Hunger-induced finickiness in humans. Appetite24, 203-218.
Kissileff HR (1984) Satiating efficiency and a strategy for conducting food loading experiments. Neurosci Biobehav Rev8, 129-135.
Kissileff HR (1985) Effects of physical state (liquid-solid) of foods on food intake: procedural and substantive contributions. Am J Clin Nutr42, 956-965.
LeBlanc J & Brondel L (1985) Role of palatability on meal-induced thermogenesis in human subjects. Am J Physiol248, E333-336.
Marciani L, Gowland PA, Spiller RC, Manoj P, Moore RJ, Young P, Al-Sahab S, Bush D, Wright J & Fillery-Travis AJ (2000) Gastric response to increased meal viscosity assessed by echo-planar magnetic resonance imaging in humans. J Nutr130, 122-127.
Masuda Y, Tanaka T, Inomata N, Ohnuma N, Tanaka S, Itoh Z, Hosoda H, Kojima M & Kangawa K (2000) Ghrelin stimulates gastric acid secretion and motility in rats. Biochem Biophys Res Commun276, 905-908.
Mattes RD (1996) Dietary compensation by humans for supplemental energy provided as ethanol or carbohydrate in fluids. Physiol Behav59, 179-187. Moran TH (2000) Cholecystokinin and satiety: current perspectives. Nutrition 16,
858-865.
Raben A & Astrup A (1996) Manipulating carbohydrate content and sources in obesity prone subjects: effect on energy expenditure and macronutrient balance. Int J Obes Relat Metab Disord20 Suppl 2, S24-30.
Raben A & Astrup A (2000) Leptin is influenced both by predisposition to obesity and diet composition. Int J Obes Relat Metab Disord24, 450-459.
Read NW & Houghton LA (1989) Physiology of gastric emptying and pathophysiology of gastroparesis. Gastroenterol Clin North Am18, 359-373. Robinson SM & York DA (1988) Cigarette smoking and the thermic responses to
isocaloric meals of varying composition and palatability. Eur J Clin Nutr 42, 551-559.
Rolls BJ, Fedoroff IC, Guthrie JF & Laster LJ (1990) Foods with different satiating effects in humans. Appetite15, 115-126.
Sakata T (1995) Histamine receptor and its regulation of energy metabolism. Obes Res3 Suppl 4, 541S-548S.
Sakata T, Yoshimatsu H, Masaki T & Tsuda K (2003) Anti-obesity actions of mastication driven by histamine neurons in rats. Exp Biol Med (Maywood) 228, 1106-1110.
Santangelo A, Peracchi M, Conte D, Fraquelli M & Porrini M (1998) Physical state of meal affects gastric emptying, cholecystokinin release and satiety. Br J Nutr 80, 521-527.
Sawaya AL, Fuss PJ, Dallal GE, Tsay R, McCrory MA, Young V & Roberts SB (2001) Meal palatability, substrate oxidation and blood glucose in young and older men. Physiology & Behavior72, 5-12.
Tournier A & Louis-Sylvestre J (1991) Effect of the physical state of a food on subsequent intake in human subjects. Appetite16, 17-24.
Tschop M, Smiley DL & Heiman ML (2000) Ghrelin induces adiposity in rodents. Nature407, 908-913.
Tschop M, Wawarta R, Riepl RL, Friedrich S, Bidlingmaier M, Landgraf R & Folwaczny C (2001a) Post-prandial decrease of circulating human ghrelin levels. J Endocrinol Invest24, RC19-21.
Tschop M, Weyer C, Tataranni PA, Devanarayan V, Ravussin E & Heiman ML (2001b) Circulating Ghrelin Levels Are Decreased in Human Obesity. Diabetes50, 707-709.
Vincent R, Roberts A, Frier M, Perkins AC, MacDonald IA & Spiller RC (1995) Effect of bran particle size on gastric emptying and small bowel transit in humans: a scintigraphic study. Gut37, 216-219.
Wang G, Lee HM, Englander E & Greeley GH, Jr. (2002) Ghrelin--not just another stomach hormone. Regul Pept105, 75-81.
Welle S, Lilavivate U & Campbell RG (1981) The effect of feeding in man: increased plasma norepinephrine levels following glucose but not protein or fat consumption. Metabolism30, 953-957.
WHO (2003) Diet, nutrition and the prevention of chronic diseases. World Health Organ Tech Rep Ser916, i-viii, 1-149, backcover.
Wren AM, Seal LJ, Cohen MA, Brynes AE, Frost GS, Murphy KG, Dhillo WS, Ghatei MA & Bloom SR (2001) Ghrelin enhances appetite and increases food intake in humans. J Clin Endocrinol Metab86, 5992.
hypothalamic peptide ghrelin stimulates food intake and growth hormone secretion. Endocrinology141, 4325-4328.
Yeomans MR & Gray RW (1996) Selective effects of naltrexone on food pleasantness and intake. Physiology & Behavior60, 439-446.
Yeomans MR, Gray RW, Mitchell CJ & True S (1997) Independent effects of palatability and within-meal pauses on intake and appetite ratings in human volunteers. Appetite29, 61-76.
Yeomans MR & Symes T (1999) Individual differences in the use of pleasantness and palatability ratings. Appetite32, 383-394.
Young JB & Macdonald IA (1992) Sympathoadrenal activity in human obesity: heterogeneity of findings since 1980. Int J Obes16, 959-967.
ARTIGO II - PAPER
INTRODUCTION
The prevalence of obesity is increasing at an alarming rate in almost all part of
the world, and the researches about that have focused on the interaction between
human physiology and the changing nature of the food environment supply
(Drewnowski & Darmon, 2005).
Based in prior studies and accumulating evidence from literature, several data
have indicated that energy-yielding fluids evoke weaker appetite and compensatory
dietary responses than energy-matched challenges in solid form (Crapo & Henry,
1988; Tournier & Louis-Sylvestre, 1991; Hulshof et al., 1993; DiMeglio & Mattes,
2000; Peracchi et al., 2000; Mattes & Rothacker, 2001; Mattes, 2005).
Surveys increasingly document a positive association between beverage
consumption and the increasing in body weight or BMI (Ludwig et al., 2001; WHO,
2003; McConahy et al., 2004), and intervention trials support the epidemiologic
findings (DiMeglio & Mattes, 2000; James et al., 2004). The mechanisms by which
fluids escape appetite controls is not known, but may include cognitive, sensory,
osmotic, gastrointestinal transit velocity, endocrine, and other processes (Mattes et al.,
2005).
Previous work have demonstrated that energy from fluids tends to add energy
to the diet rather than substitute other forms of energy source (Tournier &
Louis-Sylvestre, 1991; DiMeglio & Mattes, 2000). This may be manifest as larger meals, as
Viscosity, which is defined as resistance of a substance to flow, may be one
property of food that influences caloric compensation (Davidson & Swithers, 2005).
The viscosity of beverages is reported to be inversely related to subsequent hunger
ratings in humans (Mattes & Rothacker, 2001). Early signals of satiation may be
induced through cephalic phase-responses related to the viscosity of liquid foods that
may in turn be linked to soluble and insoluble fiber content. The absence of
mastication preparatory to the swallowing of liquids may be another element
responsible for diminished satiety.
Further, macronutrient-specific effects on satiety and satiation have been
reported. While the principle source of energy in the US diet over the past two
decades has derived from carbohydrate (Johnson & Frary, 2001), the increasing
popularity of beverages with different primary sources, e. g., specialty coffees (high
fat), performance enhancing beverages (high protein) requires assessment of each
macronutrient’s effects as well.
Some papers could not show differences in intake with solid and liquid foods
(Pliner, 1973; Mustad et al., 1999), however those studies had many no controlled
factors (e. g., physical characteristics of the diets, fiber content, etc) that could
confounded the interpretation of the data. On the other hand, many other studies
((Haber et al., 1977; Wadden et al., 1985; Tournier & Louis-Sylvestre, 1991; Hulshof
et al., 1993; de Graaf & Hulshof, 1996; DiMeglio & Mattes, 2000) agreed that solid
are more satiating than liquids, however most of them could not show this hypothesis
clearly, having the results just pointing a tendency, maybe because the design of the
Thus, the main purpose of this study was to investigate the effects of fluid and
solid loads containing primarily carbohydrate, protein or fat on satiation and satiety;
and also, see if there is any difference among them in lean and obese people. The
potential confounded factors (e. g. dissimilar foods, small sample size, and lack of
METHODS
Participants
Ninety-eight individuals completed the study. Their anthropometric
characteristics are shown in Table 1. They were recruited by public advertisements.
Participants met eligibility criteria consisting of a BMI between 18-23 or 30-35
kg/m2, 18-50 years of age, stable body weight < 3 kg change within the past three
months, not taking medication known to influence appetite, self-reported consumer
of breakfast and lunch, non-restrained eater (score < 14 on the Three Factor Eating
Questionnaire (Stunkard & Messick, 1985)), and non-smoker. They completed and
signed an informed consent form approved by the Purdue University Institutional
Review Board. Participants were divide in two groups, lean and obese, for all three
experiments; protein (n=40, 20 lean and 20 obese), carbohydrate (n=40, 20 lean and
20 obese), and fat (n=18, 9 lean and 9 obese). To minimize the potential for biased
response, they were informed that the intent of the study was to determine whether
motor skills are affected by diet.
Meals
The participants were provided a meal consisting of chicken sandwiches,
which were given in excess and were ingested ad libidum. However, only two
sandwiches were visible at any time.
The samples were randomized and matched in a liquid and solid isocaloric
form, and with one predominant macronutrient. For the protein experiment, a fat free,
low carbohydrate milk (Carb Countdown Fat Free Dairy Beverage – Hood) and
cheese were consumed (Kraft fat free Mozzarella plus whey). For the carbohydrate
experiment was provided coconut milk (A Taste of Thai coconut milk) and coconut
meat. Water (1:1) and sweetener (1 tsp of Equal) were used to prepare the coconut
milk. To match the liquid and solid sample volumes, participants were required to
drink additional water when consuming the samples of coconut meat and cheese
(Appendix I). Two caloric loads, 125 and 225 kcal, were provided. Participants in the
BMI range of 18 – 23 kg/m2 received 125 kcal, and those between 30 – 35 kg/m2
received 225 kcal. The characteristics of the meal and the samples are shown in Table
2.
The hardness and viscosity methodology used is described in details at the
appendix II.
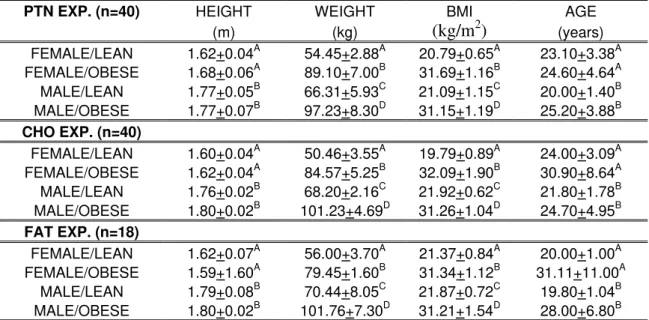
Table 1 – Means and standard deviation of anthropometric characteristic of the participants:
PTN EXP. (n=40) HEIGHT WEIGHT BMI AGE
(m) (kg) (kg/m2) (years)
FEMALE/LEAN 1.62+0.04A 54.45+2.88A 20.79+0.65A 23.10+3.38A
FEMALE/OBESE 1.68+0.06A 89.10+7.00B 31.69+1.16B 24.60+4.64A
MALE/LEAN 1.77+0.05B 66.31+5.93C 21.09+1.15C 20.00+1.40B
MALE/OBESE 1.77+0.07B 97.23+8.30D 31.15+1.19D 25.20+3.88B
CHO EXP. (n=40)
FEMALE/LEAN 1.60+0.04A 50.46+3.55A 19.79+0.89A 24.00+3.09A
FEMALE/OBESE 1.62+0.04A 84.57+5.25B 32.09+1.90B 30.90+8.64A
MALE/LEAN 1.76+0.02B 68.20+2.16C 21.92+0.62C 21.80+1.78B
MALE/OBESE 1.80+0.02B 101.23+4.69D 31.26+1.04D 24.70+4.95B
FAT EXP. (n=18)
FEMALE/LEAN 1.62+0.07A 56.00+3.70A 21.37+0.84A 20.00+1.00A
FEMALE/OBESE 1.59+1.60A 79.45+1.60B 31.34+1.12B 31.11+11.00A
MALE/LEAN 1.79+0.08B 70.44+8.05C 21.87+0.72C 19.80+1.04B
MALE/OBESE 1.80+0.02B 101.76+7.30D 31.21+1.54D 28.00+6.80B
Table 2 – Nutritional composition of the foods used
Chicken Milk Cheese Watermelon Watermelon Coconut Coconut
Sandwiches* Juice Fruit Milk Meat
Caloric Load (kcal) 125 225 125 225 125 225 125 225 125 225 125 225
Weight (g) 22 432 772 70 118 400 720 400 720 79 148 35 63 Volume (ml) - 430 770 360? 650? 390 710 390 710 83? 150? 150? 240? Energy Density (Kcal/g) 2.5 0.2 0.2 1.7 1.8 0.4 0.4 0.4 0.4 1.5 1.4 3.7 3.7 Carbohydrate (g) 4.5 5.4 9.6 4.7 10.3 28.7 51.7 28.7 51.7 2.1 3.75 5 9.1
Fat (g) 2.6 0 0 0 0 1.7 32 1.7 3.2 11.4 20.6 11.7 21.1
Protein (g) 3.05 21.4 38.5 24.5 42.7 2.5 4.5 2.5 4.5 1.04 1.9 1.16 2.1 Caloric Content (kcal) 54 107 192 117 213 140 254 140 254 115 208 130 235
Viscosity (cps) - 26.27 - 263.9 - 171.35 -
Hardness (g) - - 199.9 - 107.5 - 1125.6
* a mixture 12 g of Tyson premium chunk chicken breast pouch with mayonnaise and an average of 10g of Iron Kids Crust less bread, a total of 22g per sandwich
? Volume of water consumed with the solid treatment in order to match the volume of the liquid.
? Coconut milk was diluted with water (1:1), being the final volume 166 and 300 ml respectively for the lean and obese group
Protocol
Participants were instructed to fast for 10 hours overnight, eat their typical
breakfast (consisting of the same meal for each of the three test days), and fast again
for at least a three hours before coming to the lunch appointment. Their visits were
scheduled during their normal time for lunch. Upon arriving at the Laboratory,
participants completed a motor skills test and an appetite questionnaire on a palm
pilot. A finger stick glucose measurement checked the pre-test fast was maintained.
Participants were then provided with a meal consisting of the chicken sandwiches and
water, for the control session, and the sandwiches and a food sample on the two other
test days. They were given around 20 minutes to complete the meal. In an attempt to
minimize the influence of social interaction on the amount of food ingested,
participants were placed in an isolation booth to consume their meal (de Castro & de
Castro, 1989). The participants were given two sandwiches to begin and were
permitted to reach behind a partition to obtain as many sandwiches as they needed to
reach a level of comfortable fullness. They were unaware of how many sandwiches
were behind the partition (Rolls et al., 2002). Minimizing the risk of participants
passing a level of comfortable fullness, the sample was divided in thirds. On the test
days that the samples were provided, participants were instructed to eat the first two
thirds of the sample, to evaluate their level of fullness, and then to decide if eating the
sandwiches would interfere with finishing the sample and going beyond a comfortable
level of fullness. Participants were instructed to take five minutes to consume each
third of the sample. The written instruction for that part is presented in Appendix III.
During the sessions they had samples to eat, it was asked them to rank how much they
skills test and the appetite questionnaire. Before leaving the lab, participants were
instructed to keep a food record of each eating or drinking occasion until going to
sleep for the night. They were instructed in portion size estimation using NASCO
food models (Fort Atkinson, WI) and true-size pictures with a PowerPoint
presentation. Additionally, the participants were requested to complete the appetite
questionnaire on the palm pilot each hour and draw a single geometric form in the
palm pilot notepad every other hour until going to sleep for the night.
Dietary Analyses and Appetite/Sensory Assessments (ratings)
Food records were analyzed using version 7.6 of the Food Processor nutrition
database (ESHA, Research, Salem, Oregon). Satiation was estimated according the
calories consumed at lunch. Satiety was estimated in two ways. One by calories,
consumed after lunch, and the other by time (minutes between the participants
completing their lunch with a comfortable level of fullness, until the next eating or
drinking occasion greater than or equal to 150 kcal). Electronic Appetite Rating
Systems (EARS) was used to record participants’ hunger and fullness, before and
after consuming lunch, and each hour after leaving the lab. Questions about appetite
status, for example: “How hunger do you feel right now? How strong is your desire to
eat right now?” Were anchored with “not at all hunger / very weak” at the beginning
and “as hunger as I’ve ever felt / very strong” at the end of the scale. A schematically
Figure 1- Schematically summary of the study protocol, for the three sessions
(control, liquid or solid).
Statistical analysis
Means, standard deviations, and correlations were used to describe
distributions of all variables. Repeated measures analysis of variance with one
within-subject factor (meal form – fluid versus solid) was used for all analyses, and also BMI
(lean and obese) as between-subject factor were used to assess the all analyses for the
protein and carbohydrate experiment, but not for the fat. The criterion for statistical
significance was two-tailed p<0.05. Where appropriate, LSD test (pairwise
comparisons) was used for post hoc analyses. The Statistical Package for the Social
Science (SPSS) version 12.0 was used for all analyses. The dependent variables from
Typical breakfast
before meal
after meal
glucose test motor skill test EARS questionnaire
motor skill test EARS questionnaire
NASCO portion size training 3 hours fasting (at least)
At lunch visit
After lunch visit
lunch (+ sample or not) until comfortable full
food record (of any eating occasion until bed time)
participants food records were calories at lunch from the sandwiches consumed, total
calories at lunch (sandwiches plus sample), after lunch calories, total calories, and
satiety; and from the EARS were huger, fullness, desire to eat, preoccupation to eat,
desire for salt food, for sweet, for fat, and thrust. Power calculation of 85% indicated
a sample size of 20 participants per group (lean x obese), permitting detection of
between-group treatment effects equal to a standardized of 1 at the 5% probability
RESULTS
The mean of hedonic ratings of the samples (how much participants like the
food) is presented at Figure 2. There was no significant difference between the cheese
and milk at the protein experiment, however there was difference between the
samples for the carbohydrate (P<0.01) and fat (P<0.05) experiments.
Figure 2 - Mean of hedonic ratings of the samples, paired t- test (P<0.05).
Energy Intake
- Protein experiment:
Calories consumed from sandwiches at lunch were higher when participants
had the liquid load (P=0.001), compared to the solid. At the control session calories
consumed from sandwiches didn’t differ when participants had the liquid load,
however, they were higher (P=0.0001) when they had the solid load.
There was a significant interaction among treatments and BMI for total
calories consumed at lunch (P=0.037), sandwiches calories plus sample. Obese group
ate more (577.3 kcal) than lean (435.6 kcal) with the liquid load (P=0.009), and also Like
extremely
Dislike extremely
How much subjects like the samples
0 1 2 3 4 5 6 7 8 9 Experiments Milk Cheese W. Juice W. Fruit Coconut milk Coconut meat
Protein Carbohydrate Fat
P=0.0001
P=0.034
they ate more with the liquid load (577.3 kcal) compared to the solid (470.7 kcal),
(P=0.031).
Calories consumed after lunch tended to be lower with the solid load
(P=0.064), and also, for total calories (P=0.062) through the day. Satiety was not
significant, and also neither BMI, for all parameters analyzed. Means and standard
deviation (ME + SD) of the protein experiment are presented at Table 3.
Table 3 - Means and standard deviation of calories consumed and satiety for the protein experiment:
Session
Calories from sandwiches at lunch (kcal) Total lunch calories (kcal) After lunch calories (kcal) Total calories day (kcal) Satiety (minutes)
Control 361.9+117.7A 1457.1+516.8A 1891.6+581.7A 210.8+115.0A
Liquid 331.4+162.0A TRTxBMI* 1408.1+765.3A 1914.48+812.5A 229.1+111.5A
Solid 264.6+129.3B 1225.7+585.1A 1665.3+633.7A 248.6+160.5A
Means + SD, same letter at column are not significant different, F test (P<0.05). * Significant interaction among treatments and BMI (P=0.037).
- Carbohydrate experiment:
There was a significant interaction among treatments and BMI for calories
consumed at lunch from sandwiches (P=0.006). Obese group ate less calories of
sandwiches (199.9 kcal) than lean (394.4 kcal) with the liquid load (P=0.015).
No difference in total calories consumed at lunch was found when participants had
liquid and solid loads, however when a potential outlier subject was removed of the
analysis (n=39), total calories consumed at lunch was higher with the liquid load,
compared to the solid (P=0.032). Also, during both liquid (P=0.001) and solid
(P=0.009) sessions, total calories consumed at lunch was higher than control, either
with or without this outlier subject.
Calories consumed after lunch (P=0.044) and also through the day (P=0.026)
control and liquid, but they were higher with control (P=0.014) compared to solid.
Because later consumption was different we proceeded the analysis with the profile of
the nutrients from participants food records. Among the macronutrients, we found
statistic significance only for carbohydrate, when after control its consumption was
higher than after liquid (P=0.043), and solid (P=0.001) sessions. However,
carbohydrate calories consumed after liquid and solid did not differ between them.
For grams of food consumed later, control tended to be higher than liquid (P=0.086),
however it was really higher just than solid (P=0.002). Also, for grams of food
consumed after lunch, liquid and solid did not differ. Sugar consumption was higher
after liquid load compared to solid (P=0.042), and also higher with control compared
to solid (P=0.008). No difference was found among treatments for calories consumed
after lunch from beverages, volume of beverages consumed, and water, and satiety
(calculated by minutes) in this experiment. BMI was not significant for all parameters
Table 4 - Means and standard deviation of calories consumed and satiety for the carbohydrate experiment:
Variables Control Liquid Solid
Calories from sandwiches at lunch (kcal) TRTxBMI*
Total calories at lunch (kcal) n=40 382.2+205.4A 472.1+243.4B 447.8+234.1B Total calories at lunch (kcal) n=39 379.6+207.4A 478.5+243.2B 446.6+237.9C After lunch calories (kcal) 1641.2+774.4A 1497.9+516.8A 1304.6+579.5B Total calories of the day (kcal) 2023.4+812.7A 1970.0+612.2A 1752.5+614.2B
Satiety (minutes) 221.4+116.9A 226.2+126.9A 226.2+105.2A
Protein after lunch (g) 59.2+38.6A 56.7+27.9A 47.4+18.5A
Carbohydrate after lunch (g) 214.5+118.5A 183.1+79.9B 168.3+87.3B
Fat after lunch (g) 74.7+91.1A 58.9+34.5A 49.2+26.1A
Weight of food after lunch (g) 1917.9+814.0A 1716.7+732.3AB 1567.9+747.5B
Sugar after lunch (g) 86.2+66.8A 80.4+55.4A 63.6+54.3B
Calories from beverages after lunch (kcal) 217.5+206.4A 260.7+354.0A 185.0+201.0A
Volume of beverages after lunch (ml) 1182.7+638.4A 1086.7+729.5A 1001.3+671.3A
Water after lunch (ml) 1514.1+760.4A 1360.5+690.5A 1281.9+680.2A
Means + SD, same letter at line are not significant different, F test (P<0.05). * Significant interaction among treatments and BMI (P=0.006).
- Fat experiment:
No difference was found among treatments for calories from sandwiches at
lunch, after lunch, and satiety. Total calories consumed at lunch were lower at control
session, compared to liquid (P=0.0001), and solid (P=0.008), and tended to be higher
for liquid compared to solid (P =0.055). Means and standard deviation (ME + SD) are
presented at Table 5.
Table 5 – Means and standard deviation of calories consumed and satiety for the fat experiment: Session Calories from sandwiches at lunch (kcal) Total lunch calories (kcal) After lunch calories (kcal)
Total calories day (kcal)
Satiety (minutes)
Control 360.3+159.7A 360.3+159.7A 1935.1+1009.2A 2295.5+1041.0A 216.1+137.9A
Liquid 363.3+231.6A 538.3+237.9B 1940.3+1054.0A 2478.6+1175.2A 215.1+127.9A
Solid 306.1+176.9A 481.1+187.6B 1654.9+696.6A 2136.1+729.1A 239.4+109.5A
Appetite ratings
- Protein and carbohydrate experiment:
No significant effect among treatments and BMI was found for the average
daily ratings of any appetite variables analyzed. Means and standard deviation (ME +
SD) are presented at Table 6 for the protein experiment and Table 7 for the
carbohydrate one.
Table 6 – Means and standard deviation of appetite variables of the protein experiment:
Variables Control Liquid Solid
Hunger 31.6+9.5A 33.0+9.4A 32.9+9.7A
Fullness 41.6+12.6A 41.1+12.2A 41.5+12.5A
Desire to eat 32.3+10.9A 31.5+10.9A 31.5+11.3A
Preoccupation to eat 27.1+12.9A 26.7+12.1A 27.5+12.2A
Desire for SALT food 17.9+12.0A 18.8+13.3A 17.6+12.3A
Desire for SWEET food 24.6+12.9A 22.7+14.7A 24.4+14.4A
Desire for FAT food 17.0+12.2A 17.1+13.5A 17.1+13.4A
Thrust 35.9+13.3A 37.5+10.8A 36.2+14.2A
Means + SD same letter at line are not significant different, F test (P<0.05).
Table 7 – Means and standard deviation of appetite variables of the carbohydrate experiment:
Variables Control Liquid Solid
Hunger 31.9+10.4A 31.3+9.5A 32.4+10.5A
Fullness 42.7+12.1A 42.6+13.6A 41.5+12.4A
Desire to eat 32.7+10.2A 31.2+11.8A 32.5+11.6A
Preoccupation to eat 27.0+11.3A 26.5+12.5A 28.1+11.5A
Desire for SALT food 21.5+12.0A 21.9+13.1A 23.0+12.3A
Desire for SWEET food 28.1+13.0A 23.8+11.4A 23.5+12.1A
Desire for FAT food 19.8+11.4A 18.4+10.5A 20.0+12.0A
Thrust 43.7+14.2A 41.8+15.3A 43.2+15.9A
Means + SD same letter at line are not significant different, F test (P<0.05).
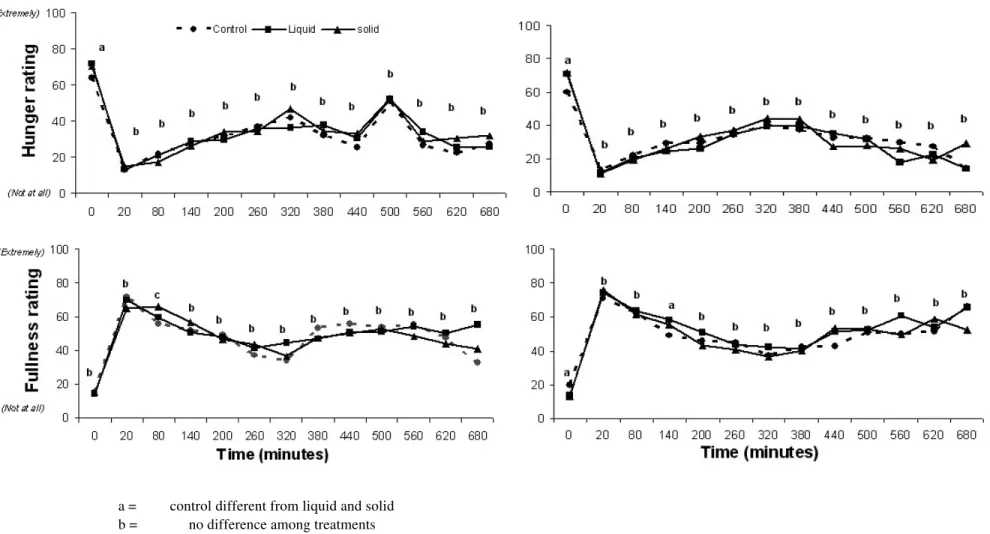
The variation of participant’s hunger and fullness were also analyzed through
the day, for the protein and carbohydrate experiments (Figure 3). The main
differences found were for the protein experiment. Fullness was higher one hour later
Figure 3. Means of hunger and fullness ratings of the control, liquid and solid sessions through the time for the protein and carbohydrate experiment.
a = control different from liquid and solid b = no difference among treatments c = solid different from control and liquid
d = liquid different from control and solid
Protein Experiment
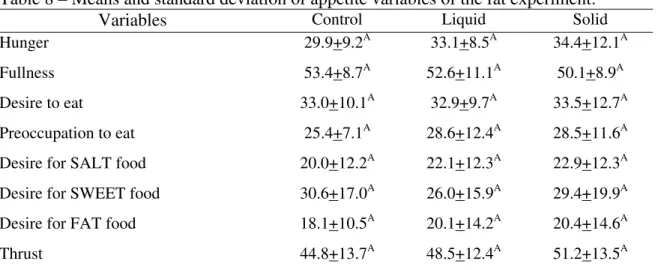
- Fat experiment:
No significant effect among treatments was found for the average daily ratings
of any appetite variables analyzed. Means and standard deviation (ME + SD) are
presented at Table 8.
Table 8 – Means and standard deviation of appetite variables of the fat experiment:
Variables Control Liquid Solid
Hunger 29.9+9.2A 33.1+8.5A 34.4+12.1A
Fullness 53.4+8.7A 52.6+11.1A 50.1+8.9A
Desire to eat 33.0+10.1A 32.9+9.7A 33.5+12.7A
Preoccupation to eat 25.4+7.1A 28.6+12.4A 28.5+11.6A
Desire for SALT food 20.0+12.2A 22.1+12.3A 22.9+12.3A
Desire for SWEET food 30.6+17.0A 26.0+15.9A 29.4+19.9A
Desire for FAT food 18.1+10.5A 20.1+14.2A 20.4+14.6A
Thrust 44.8+13.7A 48.5+12.4A 51.2+13.5A
DISCUSSION
The sensorial evaluation of the samples used in a study investigating satiation
and satiety is essential to analyze the final results. Some studies do not measure that
or they do not make any consideration about the differences found in the taste of the
samples used in their final results. In this study, carbohydrate and fat liquid samples
received lower taste scores than solid ones (Figure 2). However, a weak correlation
between their taste scores and later calories consumption was verified (Appendix IV).
In other words, there was no influence in later consumption of the participants by the
lower taste score of those samples. We assumed that participants gave lower taste
scores for the watermelon juice and the coconut milk because those samples are very
rarely consumed by them. On the other hand, no difference in the taste scores was
found for milk and cheese, which are foods often consumed by them.
The analyses of the energy intake at lunch and through the day could show
some clear results about the use of liquid and solid foods. As it was said before, the
main hypothesis addressed in this paper is that energy from fluids has a weaker
influence in the control of satiety, compared to the same energy level presented by
solid foods, leading many times in compensatory dietary responses (DiMeglio &
Mattes, 2000).
In this study satiation was clearly lower with liquid load, compared to solid for
the protein (Table 3) and carbohydrate (Table 4) experiments, and maybe it will be
also with a bigger sample for the fat (Table 5). Calories consumed after lunch was
significant higher after liquid load compared to solid in the carbohydrate experiment,
and tended to be higher in the other two experiments, showing its weak power on
However, many studies have shown opposite results (Jordan et al., 1981; Rolls
et al., 1990; Spiegel et al., 1994; Himaya & Louis-Sylvestre, 1998; Santangelo et al.,
1998; Rolls et al., 1999). Most of these studies have used as food stimuli, yogurt,
snacks and especially soup, consumed as a pre-load in a meal, or immediately before
the test meal. The most common not controlled confounding factors in those studies
were: macronutrient content, weight, temperature, volume, palatability, fiber content
and structure, cognitive impression, and also the different design focus of each one.
Soup is a very heterogeneous food category. It usually differs from beverages in
nutrient content, temperature, and presentation form. It has a cognitive impression of
a meal and not a snack. Thus, the studies that use soup as the liquid diet to be
compared with solids have a complete different design, and should not be compared
to those that use beverages as the liquid diet.
Mustad, Jonnalagadda et al. (1999) could not find any difference in hunger
and satiety using a matched liquid-formula diet with a solid-formula diet in
macronutrients; however other physical characteristics of the diets, especially fiber
content, were different.
Mattes (2005) worked also with soup, however one of his macronutrients
system, apples, had a juice version for comparison. In this case, it was shown that the
beverage had the weakest satiety effect, compared to the soup and the fruit. But there
were some points that could influence the results such as a large range of age (18-60
years) and BMI (18- 35 kg/m2) of the participants, the different temperatures of the
Additionally to the physical attributes of foods that can affect satiation and
satiety, hunger ratings and energy intake can also be affected by participants’ age,
gender and dietary restraint (Almiron-Roig et al., 2003).
Contrasting the first group of studies cited, and agreeing with Mattes (2005),
several other studies shown that solid pre-loads were more satiating than liquids. The
earliest study, Haber, Heaton et al. (1977), shown greater reduction of hunger after
ingestion of apples, compared to apple puree, and this one greater than apple juice.
Nevertheless, other components such as weight, temperature, volume, palatability,
fiber content and structure, cognitive impression, etc, were not controlled because the
main focus was in food glycemia. Similarly, Bolton, Heaton et al. (1981) compared
fruit with juice, oranges and grapes, finding that solids were stronger to decrease
hunger, but with the same problems of the last study, and not including any energy
intake measurement. Likewise, Tournier and Louis-Sylvestre (1991) shown that when
most of the energy was ingested in liquid form, no compensation as observed. They
controlled nutrient composition, weight, temperature and palatability, varying
physical state with use of matodextrines and gelatin. Although hunger ratings did not
differ after liquid and solid, total energy intake was higher when most of the pre-load
energy was in liquid form. However, in this study, the freedom to drink water could
influence the results.
Two other studies, Hulshof, De Graaf et al. (1993) and De Graaf & Hulshof
(1996), found higher satiety after consumption of solid compared to liquid foods. But
also, some conditions in those studies could mask the results, in particular no
nose clips wore by subject, respectively (Hulshof et al., 1993), likewise, differences in
energy density and weight of the samples (de Graaf & Hulshof, 1996).
More recently, DiMeglio and Mattes (2000) contrasted liquid x solid
carbohydrate using soda and candy. They found 118% of energy intake compensation
during the use of the solid load, and no significance decrease in energy intake during
the use of the liquid. Drawbacks that could influence these results were the freedom
of time that participants had to eat the loads during the day, and under controlled
laboratory conditions to measure food intake.
Two other studies, Mattes and Rothacker (2001) and Davidson and Swithers
(2005), showed that differences in beverages viscosity can strongly affect hunger.
They are inversely related. But the design of these studies was to compare liquids,
more or less viscose, and not to contrast them with solid food.
No macronutrient-specific response was found at the carbohydrate experiment,
but sugar consumption was higher after liquid load, even though participants did not
show any difference for the desire to eat sweet foods with the EARS among the three
sessions. Those findings are probably related to the common participants underreport
food intake assessed by food records, plus the free-living condition that can greatly
affect some data in short investigations. This result agrees with Gatenby, Aaron et al.
(1997) that also did not find any macronutrient compensation in a long-term study
with free-living subjects using modified foods.
The present study tried to get a more complete picture of these controversies,
by the use of more controlled conditions and less variability in food composition, in
About the possible mechanisms of action involved with satiation and satiety,
fiber content was controlled in this study, however its structure was different for the
carbohydrate experiment after blended the watermelon to obtain the juice. The liquid
sample probably had a weaker contribution of fibers on satiety and satiation than the
solid, by the breakdown of the fibers. This could be another explanation for the higher
consumption with liquid at that experiment.
Lack of mastication also could have contributed for the greater values of
calories consumed with the liquid load. This potential mechanism related also to the
control of the appetite cascade seems to affect more satiation than satiety, in the case
of the protein experiment; but it seems to affect both for the carbohydrate one. The
absence of chewing might result in decreased pancreatic exocrine and endocrine
responses when compared to solids (Brand et al., 1982). Also, in general, liquids are
emptied from the stomach at a much higher rate than solids and they may induce
weak signals in the gastrointestinal tract that would otherwise lead to further energy
intake (Spiegel et al., 1994; Spiegel et al., 1997; Almiron-Roig et al., 2003;
Almiron-Roig & Drewnowski, 2003).
Almiron-Roig, Chen et al. (2003) have pointed in their review that solids may
exert their impact on satiety primarily through energy content, rather than volume
(Kirkmeyer & Mattes, 2000), whereas beverages show a stronger effect of volume
and weaker effect of energy (Rolls et al., 1990). Also, they mentioned that solids can
appear to be more satiating than liquids when there is a long time delay between
load and the meal, but liquids can appear to be more satiating than solids when
true, those two considerations could be another reason for such controversies about
this theme in the literature.
Body weight related to physical state of the food was another main focus of
this paper. Few studies compared solid and liquid foods in lean and obese people.
Pliner (1973) failed to show differences in eating behavior between normal weight
and obese subjects. His work just showed a tendency of the leans to eat less after the
liquid pre-load than solid. However, the pre-loads, flavored milk and an angel food
cake plus jam differed in many physical attributes and macronutrients composition.
In the three experiments we could see more clearly that body weight
influences calories consumed especially in the protein one, when the obese group ate
more calories at lunch, with the liquid load, than the leans (577.3 vs 435.6 kcal). Even
receiving a bigger load of milk than the lean ones, 100 kcal difference, they did not
show any compensation. Also, obese ones ate more calories at lunch with the liquid
load compared with the solid (577.3 vs 470.7 kcal). These data shown that obese
people seems to have a weaker control of calories consumed with liquids, especially
at short term (Drewnowski et al., 1994), compared to lean ones. Protein is the
strongest macronutrient in the satiety cascade and also is very powerful to release
cholecystokinin, CCK, hence that is why these differences and others, illustrated at
figure 3, were detected more clearly for this experiment.
In the carbohydrate experiment, the obese group ate less calories at lunch
(from sandwiches), with the liquid load, than the leans (199.9 vs 394.4 kcal), which
was ad libitum. Two possible explanations for that are gastric empty and insulin
action that may be differentiated in obese people. Glasbrenner, Pieramico et al. (1993)
liquid emptying in obese subjects compared to lean, using a orange juice and an egg
ham sandwich. Also, it has been shown that the increase of body weight contributes to
insulin resistance (Jenkins et al., 2000; McLaughlin et al., 2004; Reaven, 2005). Both,
liquid samples, the orange juice used in Glasbrenner, Pieramico et al. (1993) study,
and the watermelon juice used in this study are examples of high glycemic index
foods. Then, in a normal pathway, they should decrease satiety by the fast release of
insulin, therefore stimulating food intake (Ludwig, 2000; Roberts, 2000). It did not
happen at the carbohydrate experiment, suggesting that obese participants probably
had a dysfunction of this system.
Thus, the mechanisms by which fluids escape appetite controls have not been
sufficiently characterized, but we strongly believed that cognitive, sensory, osmotic,
gastrointestinal transit, endocrine, and other processes are involved.
In conclusion, our data shown liquid foods leaded to higher calories
consumption in a short term, satiation, but also it has some influence at long term,
satiety, compared to solids. Therefore, the control of liquid caloric foods, especially as
beverages combined in a meal or as a snack, must be limited in the prevention and
ACKNOWLEDGMENTS
I would like to thank Dr. Mattes for all coordination and help with the project,
and his entire lab group, especially Amy Devitt, Christy Wood and Judy George.
Also, I appreciated all statistic assistance by Nilupa Gunaratna, and the contributions
of the initial design of the study by John Potter. This work was supported by CNPq,
Coordenação de Aperfeiçoamento de Pessoal de Nível Superior (CAPES),