Future Economics of Liver Transplantation: A
20-Year Cost Modeling Forecast and the
Prospect of Bioengineering Autologous Liver
Grafts
Dany Habka1, David Mann2, Ronald Landes3*, Alejandro Soto-Gutierrez4,5,6,7*
1Health Systems Reform, Beirut, Lebanon,2Cellular Dynamics International, Madison, WI, United States of America,3Solving Organ Shortage, Austin, TX, United States of America,4Department of Pathology, University of Pittsburgh, Pittsburgh, PA, United States of America,5Thomas E. Starzl Transplantation Institute, University of Pittsburgh, Pittsburgh, PA, United States of America,6McGowan Institute for Regenerative Medicine, University of Pittsburgh, Pittsburgh, PA, United States of America,7SOS Whole Liver Research Community, Austin, TX, United States of America
*[email protected](ASG); [email protected](RL)
Abstract
During the past 20 years liver transplantation has become the definitive treatment for most severe types of liver failure and hepatocellular carcinoma, in both children and adults. In the U.S., roughly 16,000 individuals are on the liver transplant waiting list. Only 38% of them will receive a transplant due to the organ shortage. This paper explores another option: bioengi-neering an autologous liver graft. We developed a 20-year model projecting future demand for liver transplants, along with costs based on current technology. We compared these cost projections against projected costs to bioengineer autologous liver grafts. The model was divided into: 1) the epidemiology model forecasting the number of wait-listed patients, operated patients and postoperative patients; and 2) the treatment model forecasting costs (pre-transplant-related costs; transplant (admission)-related costs; and 10-year post-trans-plant-related costs) during the simulation period. The patient population was categorized using the Model for End-Stage Liver Disease score. The number of patients on the waiting list was projected to increase 23% over 20 years while the weighted average treatment costs in the pre-liver transplantation phase were forecast to increase 83% in Year 20. Pro-jected demand for livers will increase 10% in 10 years and 23% in 20 years. Total costs of liver transplantation are forecast to increase 33% in 10 years and 81% in 20 years. By com-parison, the projected cost to bioengineer autologous liver grafts is $9.7M based on current catalog prices for iPS-derived liver cells. The model projects a persistent increase in need and cost of donor livers over the next 20 years that’s constrained by a limited supply of donor livers. The number of patients who die while on the waiting list will reflect this ever-growing disparity. Currently, bioengineering autologous liver grafts is cost prohibitive. How-ever, costs will decline rapidly with the introduction of new manufacturing strategies and economies of scale.
a11111
OPEN ACCESS
Citation:Habka D, Mann D, Landes R,
Soto-Gutierrez A (2015) Future Economics of Liver Transplantation: A 20-Year Cost Modeling Forecast and the Prospect of Bioengineering Autologous Liver Grafts. PLoS ONE 10(7): e0131764. doi:10.1371/ journal.pone.0131764
Editor:Salvatore Gruttadauria, ISMETT-UPMC Italy/
University of Catania, ITALY
Received:February 4, 2015
Accepted:June 5, 2015
Published:July 15, 2015
Copyright:© 2015 Habka et al. This is an open
access article distributed under the terms of the Creative Commons Attribution License, which permits unrestricted use, distribution, and reproduction in any medium, provided the original author and source are credited.
Data Availability Statement:All relevant data are
within the paper and its Supporting Information files.
Funding:Dr. Dany Habka, a modeling and
Introduction
Approximately 30 million people in the U.S. have a liver disorder. About 40,000 of them will prog-ress to end-stage liver disease, which is responsible for approximately 30,000 deaths annually in the U.S. [1,2]. Medical therapy can extend life, but the only curative therapy for severe end-stage liver disease is allogeneic liver transplantation—either a partial liver from a living-related donor or a whole cadaveric liver. However, liver transplantation is severely limited by the supply of donors.
In many ways, liver transplantation has been a victim of its own success. As transplantation science evolved, indications for this therapeutic modality expanded to include many causes of acute and chronic liver failure, cirrhosis, inherited metabolic diseases and some cases of cancers [3]. Yet the pool of donor livers failed to keep pace with the growing demand; in some areas it is losing ground. In the U.S., the annual number of cadaveric donor livers decreased from 7,014 in 2006 to 5,798 in 2014, according to data collected by the Organ Procurement and Transplanta-tion Network. Living donaTransplanta-tion numbers have also declined, falling from about 524 donors in 2001 to 230 in 2014 [4]. Of the 16,000 people on the liver waiting list in 2014, less than half of them (5,527) received a transplant [4]. To make matters worse, the donor pool is expected to shrink further due to the obesity epidemic. Liver steatosis is increasingly common in donors and is a significant risk factor in liver transplantation [5]. These data point to one fact: Organ availability is an absolute constraint on the number of liver transplants that can be performed.
Numerous unconventional strategies have been explored to increase the number of livers available for transplantation. These include: the use of marginal donors, an ill-defined group com-prised of donors over the age of 60; donors with greater than 30% hypernatremia or macrosteato-sis; donors with positive serologies for the hepatitis C or hepatitis B virus; donors with a cold ischemia time of greater than 12 hours; non-heart-beating donors; and grafts from split-livers or living-related donors [3,6]. Resuscitation of marginal quality donor organs using machine perfu-sion [7] and the production of pigs with genetic manipulations [8] has also been explored. Unfor-tunately, these alternative approaches have presented a variety of practical and logistic difficulties. Because the liver has the ability to regenerate completely after severe liver failure, it benefits from methods of temporary hepatic support and hepatocyte transplantation [9]. Auxiliary liver transplantation [10] has also developed as an effective therapeutic option for patients with acute liver failure and inborn errors of liver metabolism, though this approach has inherent limiting factors similar to orthotopic liver transplantation.
Creating a universally available liver graft from autologous tissue and cells would increase the number of organs available for transplantation and eliminate the need for a life-long regi-men of immune suppression drugs and their complications. Clearly there is a compelling social need to perform liver transplantation more widely. Now that many of the scientific elements are falling into place, it will likely be possible to bioengineer a liver from autologous cells.
The transplant community faces major challenges treating end-stage liver disease—social, political and monetary. In this paper we attempt to define the size of the problem by creating an economic model for liver transplantation over the next 20 years. We projected the popula-tion in need plus the costs of treatment with convenpopula-tional allogeneic liver transplantapopula-tion. Then we looked at the prospective costs of transplanting livers bioengineered from autologous induced pluripotent stem cells (iPSCs).
Methods
Economic Model
Our model is divided into two parts: The Epidemiology Model and the Treatment Costs Model. The Epidemiology Model forecasts the population dynamics of liver transplantation: company had any additional role in the study design,
data collection and analysis, decision to publish, or preparation of the manuscript. Alejandro Soto-Gutierrez also receives support (DK099257) from The National Institutes of Health. The specific roles of these authors are articulated in the‘author contributions’section.
Competing Interests:Dr. Ron Landes is the current
wait-listed patients; operated patients, and postoperative patients out to 10 years. A simulation period of 20 years is considered for the cohort of wait-listed patients. (Patients prior to 2014 or after 2033 are excluded).
The Treatment Costs Model forecasts costs generated during the simulation period. Costs are divided into pre-transplant-related costs, transplant (admission)-related costs and 10-year post-transplant-related costs. The patient population has been categorized using the Model for End-Stage Liver Disease (MELD) score. The pre-transplant-related costs are allocated per MELD score (<9, 10–19, 20–29, 30–39,>40). They account for the costs generated one year
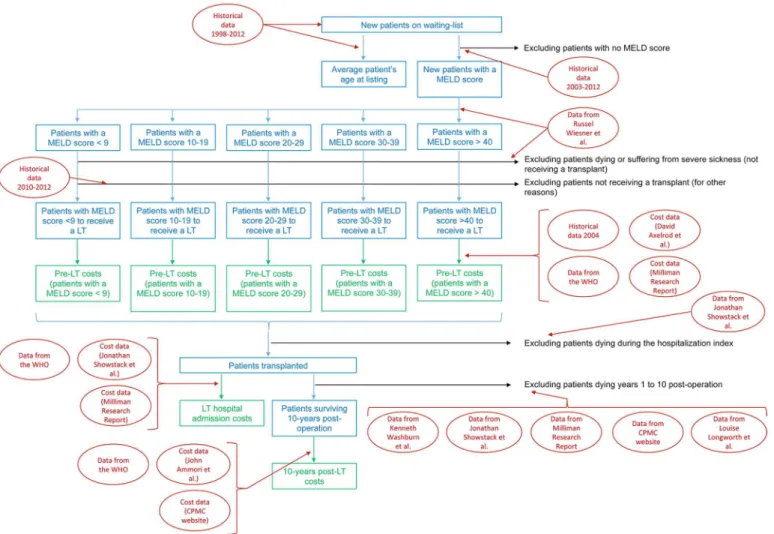
prior to transplant (for severe illness) or while patients are on the waiting list (for moderate ill-ness with waiting time exceeding one year). In this way we were able to capture the costs of treatment prior to transplantation for severely ill patients—who will be on the waiting list for days to a couple of months—compared to patients who are less ill and could be on the waiting list for up to five years. Due to the lack of published data, the admission-related costs and post-transplant-related costs are shown for all patients without regard to the MELD score. All costs are expressed in 2014 U.S. dollars (USD) and, where appropriate, were adjusted to 2014 USD using the Gross Domestic Product (GDP) deflator-based calculator [11]. The 20-years fore-casted cost values were discounted to present value at a rate of 3% per year [12,13].Fig 1 shows the model scheme.
Forecast metrics. The outcomes of the Epidemiology Model are the number of new patients listed each year and their distributions based on MELD score and age at listing. Addi-tionally, the following metrics are forecast: (Pre-liver transplantation) number of patients who will die or suffer severe illness on the waiting list; (Pre-liver transplantation) number of patients who will not receive a liver transplantation; (Pre-liver transplantation) number of patients who will receive a liver transplant; (Admission) number of patients surviving surgery; and (Post-liver transplantation) number of patients surviving Year 1 through Year 10 after (Post-liver transplantation.
Outcomes of the Treatment Cost Model are: 1) the discounted treatment costs during the pre-liver transplantation phase, per to-be transplanted patients and per MELD score; 2) the discounted total resources used from the day of transplantation to discharge, per transplant-operated patient; and 3) the discounted total costs of treatment 10 years post-liver transplanta-tion per patients surviving for 10 years. All metrics are shown over the 20-year period of simu-lation and at Years 1, 10 and 20.
Uncertainty and sensitivity analyses. In numerical modeling, an uncertainty analysis employs different techniques for determining the reliability of model predictions and accounts for various sources of uncertainty in model input and design. In our model an uncertainty anal-ysis is performed to generate plausible value ranges of the costs metrics at Year 20 (2033), and to assess the certainty at which the base case can be achieved. For this purpose, parameters are varied according to a realistic distribution and 30,000 Monte Carlo iterations are run using Oracle Crystal-Ball software. We then performed a sensitivity analysis, which determines how different values of an independent variable will impact the financial output metrics.
Data sources. The epidemiology and costs data are collected from various literature sources and are summarized inTable 1.
list pricing. In this case study, Cellular Dynamics International (CDI) is used as the vendor
(http://www.cellulardynamics.com). Factored into the per-vial pricing are the manufacturing
costs, royalty payments for IP rights to commercialize, and a profit margin for the vendor. Software. The model is built in Microsoft Excel 2013. Uncertainty and sensitivity analyses are performed with Oracle Crystal-Ball.
Results
Epidemiology Model
Assuming the current environment of liver transplantation does not change over the next 20 years, our first set of analyses predicts the total number of new patients on the waiting list will increase from 10,367 new patients in 2014 to 12,763 patients in 2033. This represents a 23% increase in demand for liver transplantation over 20 years. When we compare these figures to the percent of patients with non-identified or non-indicated MELD score on the OPTN data-base and those with inactive status, the number of new patients on the waiting list with a MELD score is predicted to increase from 7,934 new patients in 2014 to a maximum of 8,006 new patients in 2020, before decreasing to 7,600 new patients in 2033. This decrease does not Fig 1. Model Scheme.Blue and green rectangles represent, respectively, the forecast outputs of the Epidemiology Model and the Treatment Costs Model. Data used to perform the forecasts are shown in red square (refer toTable 1for further details on data source).
Table 1. Model inputs’values and their associated distributions/ranges.
Real patients’cohort size and characteristics in year 2012
Reference Parameter Distribution Base Low High
HHS-HRSA-SRTR [14] New patients on waiting-list Fixed 10,143 -
-Percent patients with not-defined MELD score
Fixed 0.094 -
-Percent patients with inactive status on waiting-list
Fixed 0.129 -
-Percent patients with MELD score 6–14 Fixed 0.432 - -Percent patients with MELD score 15–34 Fixed 0.319 - -Percent patients with MELD score>35 Fixed 0.026 -
-Percent age group 18–34 Fixed 0.042 -
-Percent age group 35–49 Fixed 0.147 -
-Percent age group 50–64 Fixed 0.627 -
-Percent age group>65 Fixed 0.184 -
-Theoretical patients’cohort size and characteristics forecasts (General Epidemiology Model)
Reference Parameter Distribution Base Low High
HHS-HRSA-SRTR [14] / Computed Percent change new patients on waiting-list Triangular 0.011 -0.014 0.079 Percent change patients with not-defined
MELD score
Triangular 0.076 0.049 0.094
Percent change patients with inactive status on waiting list
Triangular -0.005 -0.068 0.051
Percent change patients with MELD score 6–14
Triangular -0.027 -0.04 -0.006
Percent change patients with MELD score 15–34
Triangular 0.022 0.002 0.046
Percent change patients with MELD score>35
Triangular 0.045 -0.021 0.205
Russel Wiesner et al. [15] / Computed Percent patients with MELD score<9 Triangular 0.036 0.027 0.045 Percent patients with MELD score 10–19 Triangular 0.524 0.393 0.655 Percent patients with MELD score 20–29 Triangular 0.319 0.24 0.399 Percent patients with MELD score 30–39 Triangular 0.086 0.064 0.107 Percent patients with MELD score>40 Triangular 0.035 0.026 0.044 HHS-HRSA-SRTR [14] / Computed Percent change patients with MELD
score<9
Variable -0.027 Variable Variable
Percent change patients with MELD score 10–19
Variable -0.003 Variable Variable
Percent change patients with MELD score 20–29
Variable 0.022 Variable Variable
Percent change patients with MELD score 30–39
Variable 0.034 Variable Variable
Percent change patients with MELD score>40
Variable 0.045 Variable Variable
HHS-HRSA-SRTR [14] / Computed Percent change age group 18–34 Fixed -0.022 -
-Percent change age group 35–49 Fixed -0.068 -
-Percent change age group 50–64 Fixed 0.025 -
-Percent change age group>65 Fixed 0.047 -
-Theoretical patients’cohort size and characteristics forecasts (Pre-Transplantation Epidemiology Model)
Reference Parameter Distribution Base Low High
Table 1. (Continued)
HHS-HRSA-SRTR [14] / Russel Wiesner et al. [15] / Computed
Mortality and severe sickness rates for patients on waiting-list with MELD score<9 @ 3-month
Fixed 0.029 -
-@ 1-year Fixed 0.051 -
-@ 2-years Fixed 0.062 -
-@ 3-years Fixed 0.069 -
-@ 4-years Fixed 0.076 -
-@ 5-years Fixed 0.084 -
-@ 6-years Fixed 0.092 -
-@ 7-years Fixed 0.102 -
-@ 8-years Fixed 0.112 -
-@ 9-years Fixed 0.124 -
-@ 10-years Fixed 0.137 -
-HHS-HRSA-SRTR [14] / Russel Wiesner et al. [15] / Computed
Mortality and severe sickness rates for patients on waiting-list with MELD score 10–19 @ 3-month
Fixed 0.077 -
-@ 1-year Fixed 0.135 -
-@ 2-years Fixed 0.165 -
-@ 3-years Fixed 0.182 -
-@ 4-years Fixed 0.201 -
-@ 5-years Fixed 0.222 -
-Russel Wiesner et al. [15] Mortality and severe sickness rates for patients on waiting-list with MELD score 20–29 @ 3-month
Fixed 0.235 -
-Mortality and severe sickness rates for patients on waiting-list with MELD score 30–39 @ 3-month
Fixed 0.602 -
-Mortality and severe sickness rates for patients on waiting-list with MELD score>40 @ 3-month
Fixed 0.793 -
-HHS-HRSA-SRTR [14] / Computed Percent annual change in time to transplant Triangular 0.017 -0.017 0.051 HHS-HRSA-OPTN [4] Waiting time to LT for patients with MELD
score<10 (days)
Triangular 1776 1538 2125
Waiting time to LT for patients with MELD score 11–18 (days)
Triangular 639 592 698
Waiting time to LT for patients with MELD score 19–24 (days)
Triangular 106 93 116
Waiting time to LT for patients with MELD score>25 (days)
Triangular 20 18 22
Waiting time to LT for patients with Liver Status 1 (days)
Triangular 6 5 7
HHS-HRSA-SRTR [14] / Computed Percent of eligible patients not-going for a liver transplant
Uniform 0.213 0.204 0.222
Theoretical patients’cohort size and characteristics forecasts (Hospital Admission Epidemiology Model)
Reference Parameter Distribution Base Low High
Table 1. (Continued)
Jonathan Showstack et al. [16] Percent patient required re-transplantation Fixed 0.03 - -Percent patient died during the index
hospitalization
Fixed 0.06 -
-Percent patient with UNOS status in hospital but not in ICU
Fixed 0.24 -
-Percent patient with UNOS status in ICU Fixed 0.09 -
-Percent donor age 60+ years Fixed 0.07 -
-Percent patient age 60+ years Fixed 0.19 -
-Percent patient with Alcoholic Liver Disease Fixed 0.2 - -Percent patient with Child-Pugh Class C Fixed 0.35 -
-Theoretical patients’cohort size and characteristics forecasts (Post-Transplantation Epidemiology Model)
Reference Parameter Distribution Base Low High
Kenneth Washburn et al. [17] / Milliman Research Report [18] / Jonathan Showstack et al. [16] / CPMC website [19] / Louise Longworth et al. [20]
Post-transplantation survival rate @ Year 1 Fixed 0.90 -
-@ Year 2 Fixed 0.85 -
-@ Year 3 Fixed 0.79 -
-@ Year 4 Fixed 0.76 -
-@ Year 5 Fixed 0.74 -
-@ Year 6 Fixed 0.71 -
-@ Year 7 Fixed 0.69 -
-@ Year 8 Fixed 0.67 -
-@ Year 9 Fixed 0.65 -
-@ Year 10 Fixed 0.63 -
-John Ammori et al. [21] First 90 post-operative days frequency of acute cellular rejection
Triangular 0.11 0.11 0.60
Frequency of biliary complications Triangular 0.33 0.10 0.33 Frequency of hepatic artery thrombosis Triangular 0.03 0.03 0.12 Frequency of superficial skin infection Triangular 0.16 0.12 0.20
Frequency of pneumonia Triangular 0.16 0.12 0.20
Frequency of bloodstream infection Triangular 0.16 0.12 0.20
Frequency of peritonitis Triangular 0.17 0.13 0.21
Frequency of urinary tract infection Triangular 0.17 0.13 0.21 Frequency of clostridium difficile colitis Triangular 0.10 0.08 0.13 Frequency of other infections Triangular 0.55 0.41 0.69 Frequency of venous thromboembolism Triangular 0.07 0.05 0.09
Frequency of reoperation Triangular 0.23 0.17 0.29
Frequency of primary non-function Triangular 0.03 0.02 0.04 Frequency of hepatic vein stenosis Triangular 0.07 0.05 0.09 Frequency of acute renal failure Triangular 0.17 0.13 0.21
Treatment Costs Model (general)
Reference Parameter Distribution Base Low High
WHO-GHED [22] / Computed Annual cost increase rate Triangular 0.049 0.0258 0.0604
Eugene Yen et al. [12] / David Torgerson and James Raftery [13]
Annual cost discount rate Triangular 0.03 0.015 0.045
Pre-Transplantation Treatment Costs Model (costs for 2014-Year 1)
Reference Parameter Distribution Base Low High
Table 1. (Continued)
David Axelrod et al. [23] / Adjusted Average monthly spending in pre-transplantation phase for patients with MELD score<9
Triangular $347 $35 $658
Average monthly spending in pre-transplantation phase for patients with MELD score 10–19
Triangular $1,578 $1,097 $2,058
Average monthly spending in pre-transplantation phase for patients with MELD score 20–29
Triangular $19,602 $13,060 $26,143
Average monthly spending in pre-transplantation phase for patients with MELD score 30–39
Triangular $31,644 $20,417 $42,871
David Axelrod et al. [23] / Computed Average monthly spending in pre-transplantation phase for patients with MELD score>40
Variable $51,085 Variable Variable
Milliman Research Report [18] / Adjusted Costs adjustment for last 30 days pre-transplantation costs (for patients with MELD score<30)
Triangular $26,469 $13,235 $39,704
Hospital Admission Treatment Costs Model (costs for 2014-Year 1)
Reference Parameter Distribution Base Low High
Milliman Research Report [18] / Adjusted Organ procurement costs Triangular $73,989 $36,995 $110,984
Hospital admission costs Fixed $330,242 -
-Jonathan Showstack et al. [16] Percent of hospital admission costs due to immunosuppressive
Triangular 0.081 0.041 0.121
Percent of hospital admission costs due to anti-infective
Triangular 0.050 0.025 0.075
Percent of hospital admission costs due to other medications
Triangular 0.011 0.005 0.016
Percent of hospital admission costs due to blood products
Triangular 0.120 0.060 0.180
Percent of hospital admission costs due to operating room
Triangular 0.088 0.044 0.132
Percent of hospital admission costs due to respiratory services
Triangular 0.041 0.021 0.062
Percent of hospital admission costs due to special care
Triangular 0.140 0.070 0.210
Percent of hospital admission costs due to other room and care
Triangular 0.162 0.081 0.243
Percent of hospital admission costs due to immunosuppressive monitoring
Triangular 0.010 0.005 0.014
Percent of hospital admission costs due to other laboratory
Triangular 0.145 0.073 0.218
Percent of hospital admission costs due to chest radiography
Triangular 0.011 0.006 0.017
Percent of hospital admission costs due to ultrasound
Triangular 0.006 0.003 0.009
Percent of hospital admission costs due to other imaging
Triangular 0.020 0.010 0.030
Percent of hospital admission costs due to pathology
Triangular 0.007 0.004 0.011
Percent of hospital admission costs due to material services
Triangular 0.089 0.045 0.134
Percent of hospital admission costs due to miscellaneous
Triangular 0.018 0.009 0.027
Milliman Research Report [18] / Adjusted Physician fees during transplant Triangular $48,562 $24,281 $72,843
reflect a decrease in demand for liver transplantation. It reflects the classification of the data reported to the OPTN database and our decision to exclude patients with no reported MELD score. A correction is made to account for those patients in the estimation of potential U.S. liver transplantation demand and the potential U.S. liver transplantation direct medical expenses.
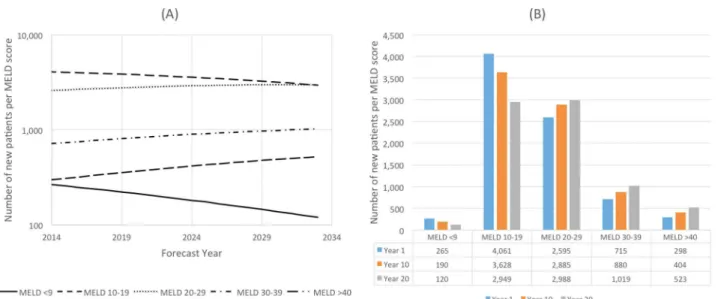
The forecast of the number of new patients who will be added to the transplant list each year from 2014 to 2033 per MELD score is shown inFig 2A. These predictions indicate the patients are moving from lower MELD score categories to higher MELD score categories. Between 2014 and 2033 (Fig 2B):
Table 1. (Continued)
Jonathan Showstack et al. [16] Percent increase in costs of treatment for patient requiring re-transplantation
Triangular 1.54 0.77 2.31
For patient with UNOS status in hospital but not ICU
Triangular 0.15 0.08 0.23
For patient with UNOS status in ICU Triangular 0.42 0.21 0.63 For patient receiving an organ from a 60
+ donor
Triangular 0.28 0.14 0.42
For patient aged 60+ years Triangular 0.17 0.09 0.26 For patient with alcoholic liver disease Triangular 0.26 0.13 0.39 For patient with Child-Pugh Class C Triangular 0.41 0.21 0.62
10-Years Post-Transplantation Treatment Costs Model (costs for 2014-Year 1)
Reference Parameters Distribution Base Low High
John Ammori et al. [21] / Computed First 90 post-operative days average costs Triangular $139,746 $50,610 $228,882 John Ammori et al. [21] / Adjusted Additional costs due to acute cellular
rejection
Triangular $21,317 $10,659 $31,976
Additional costs due to biliary complications Triangular $40,457 $20,229 $60,686 Additional costs due to hepatic artery
thrombosis
Triangular $83,085 $41,543 $124,628
Additional costs due to superficial skin infection
Triangular $(2,883) $(4,325) $(1,442)
Additional costs due to pneumonia Triangular $59,122 $29,561 $88,683 Additional costs due to bloodstream
infection
Triangular $75,616 $37,808 $113,424
Additional costs due to peritonitis Triangular $88,187 $44,094 $132,281 Additional costs due to urinary tract infection Triangular $50,609 $25,305 $75,914 Additional costs due to clostridium difficile
colitis
Triangular $33,939 $16,970 $50,909
Additional costs due to other infections Triangular $50,118 $25,059 $75,177 Additional costs due to venous
thromboembolism
Triangular $39,148 $19,574 $58,722
Additional costs due to reoperation Triangular $82,231 $41,116 $123,347 Additional costs due to primary non-function Triangular $78,812 $39,406 $118,218 Additional costs due to hepatic vein
stenosis
Triangular $54,370 $27,185 $81,555
Additional costs due to acute renal failure Triangular $60,766 $30,383 $91,149
CPMC website [19] Annual cost of immunosuppressive, per
patient
Fixed $36,708 -
-Table 1 summarizes all the parameters used to perform the epidemiology and treatment cost forecasts with the literature reference or database from which the values were taken. It also shows the distribution and ranges of parameters that were varied to perform the uncertainty and sensitivity analyses.
• The number of patients with a MELD score<9 will decrease by 55%
• The number of patients with a MELD score 10–19 will decrease by 27%
• The number of patients with a MELD score 20–29 will increase by 15%
• The number of patients with a MELD score 30–39 will increase by 42%
• The number of patients with a MELD score>40 will increase by 76%
The largest MELD category in 2014 (51%) will be patients scoring 10–19, whereas in 2033 the 20–29 MELD score category will be the largest at 39%. This study predicts that patients' age at listing will increase from an average of 57.7 years in 2014 to an average of 62 years in 2033, a 7% increase.
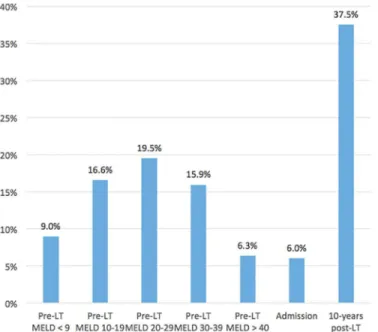
Based on the OPTN database, this model projects that 65% of the simulated patients over a 20-year period would receive a liver transplant, 18% would not undergo the transplant opera-tion (including patients refusing the operaopera-tion, patients delisted following improvement in their health conditions, and for other reasons not explicitly stated in the OPTN database). Addition-ally, the model outcomes predict that 6% of the patients who are operated on would die during hospitalization for transplantation and 63% of transplanted patients would survive the 10-year period following transplantation.Fig 3provides information regarding the predicted mortality percentages. We also found that a lower proportion of patients with a high MELD scores (>30),
compared to those with a MELD score<30, are predicted to die due to the significantly shorter
wait-time for an organ for sicker patients compared to those in better health.
Treatment Costs Model
The second set of analyses of forecasting the financial metrics show that the treatment of a patient in the pre-liver transplantation phase will cost between $49,407 (MELD score<9) and
$613,020 (MELD score>40) on Year 1. It will increase, respectively, to $71,621 and $867,564
in Year 20. The weighted average treatment costs in the liver transplantation phase are pre-dicted to be $168,386 in Year 1 and will increase by 83% to $307,610 by Year 20. The treatment costs for a patient receiving a liver transplantation (admission phase) and those 10 years post-Fig 2. Number of New Patients per MELD score.(A) Metric evolution over 20-years. (B) Metric forecasts at Years 1, 10 and 20.
transplantation will increase by 42% between Year 1 and Year 20 from, respectively, $588,580 to $836,788 and from $670,839 to $949,391 (Fig 4). The total weighted treatment costs of a liver transplantation, all three phases included, will increase from $1,427,805 per patient in Year 1 to $2,093,789 per patient in Year 20 (Fig 4).
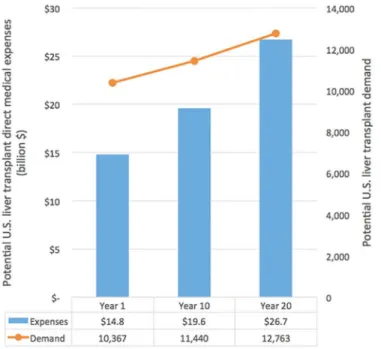
Fig 5summarizes the potential U.S. liver transplant demand and the potential U.S. liver
transplant medical expenses at Years 1, 10 and 20. Our model predicts that the demand for liver organs will increase by 10% in 10 years and by 23% in 20 years. The potential total costs of liver transplantation (assuming all patients survive the pre-transplantation, admission and 10-year post-transplantation phases) will increase from $14.8 billion to $19.6 billion in 10 years (a 33% increase) and to $26.7 billion in 20 years (an 81% increase).
Uncertainty Analysis
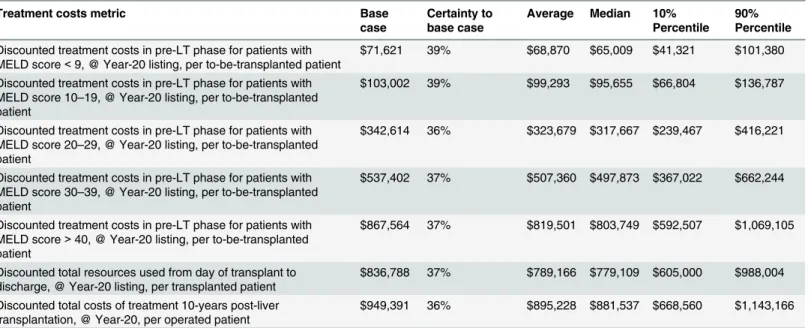
The uncertainty analysis indicates thecertaintyto achieve the cost projections (at or above), at Year 20, is 36%-39% for the pre-transplant-related costs, 37% for the hospital admission-related costs and 36% for the 10-year post-transplant-admission-related costs (Table 2.). The averages of the 30,000 Monte Carlo iterations are, compared to the base case, 3.6%-5.6% lower for the pre-transplant-related costs and 5.7% lower for the hospital admission-related costs and 10-year post-transplant-related costs. The 10%-90% percentile intervals are as follows:
• Discounted treatment costs in the pre-transplantation phase for patients with MELD score
<9: $41,321-$101,380 per patient
• Discounted treatment costs in the pre-transplantation phase for patients with MELD score 10–19: $66,804-$136,787 per patient
• Discounted treatment costs in the pre-transplantation phase for patients with MELD score 20–29: $239,467-$416,221 per patient
Fig 3. Percent of theoretic patients that would die per liver transplantation phase.The figure shows the predicted mortality percentages. A lower proportion of patients with a high MELD scores (>30), compared to those with a MELD score<30, are predicted to die due to the significantly shorter wait-time for an organ for sicker patients compared to those in better health.
• Discounted treatment costs in the pre-transplantation phase for patients with MELD score 30–39: $367,022-$662,244 per patient
• Discounted treatment costs in the pre-transplantation phase for patients with MELD score
>40: $592,507-$1,069,105 per patient
Fig 5. Potential U.S. liver transplant demand and potential U.S. liver transplant medical expenses at Years 1, 10 and 20.The demand for liver organs will increase by 10% in 10 years and by 23% in 20 years.
doi:10.1371/journal.pone.0131764.g005
Fig 4. Discounted costs (per theoretical patient and per liver transplantation phase) and total discounted costs of liver transplantation (per theoretical patient) at Years 1, 10 and 20.The total weighted treatment costs of a liver transplantation will increase from $1,427,805 per patient in Year 1 to $2,093,789 per patient in Year 20.
• Discounted total costs from day of transplant to discharge: $605,000-$988,004 per patient
• Discounted total costs of treatment 10-years post-transplant: $668,560-$1,143,166 per patient
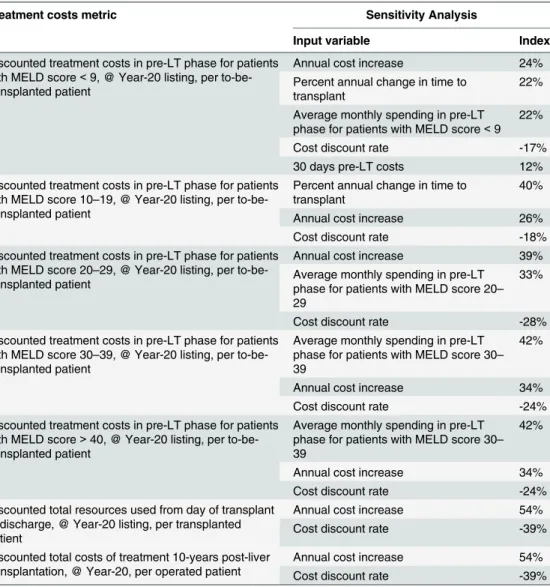
Sensitivity Analysis
The sensitivity analysis revealed that all treatment costs model outputs, at Year 20, are sensitive to the annual cost increase (sensitivity index 24%-54%) and the annual cost discount rate (sen-sitivity index -17% to -28%) (Table 3). Pre-transplantation-related costs, per MELD category, are also sensitive to the average monthly spending in the pre-transplantation phase (except for MELD score 10–19; sensitivity index 22% to 42%), the last 30-days pre-transplantation costs (only for MELD score<9; sensitivity index 12%), and the percent in annual change in time to
transplant (only MELD scores<9 and 10–19; sensitivity index 22% to 40%).
Projection of Costs to Manufacture Liver Grafts from iPSCs
The manufacture and universal availability of a liver graft from autologous tissue and cells would change the paradigm of organ transplantation by increasing the number of organs avail-able for transplantation, and eliminate the need for life-long immune suppression and its com-plications. Several strategies are being developed for construction of whole organs using the decellularized whole organ matrix, and subsequent re-seeding with relevant cell types, in physi-ologically appropriate bioreactors [24–30]. Engineering pluripotency of human somatic cells by the ectopic expression of transcription factors has opened the possibility of generating autol-ogous cells for cell/organ replacement therapies. Thus, iPSCs are of special interest because they could be patient specific, can be propagated indefinitely as undifferentiated cells and can differentiate into practically any cell type [31].
Table 2. Results of the Uncertainty Analysis.
Treatment costs metric Base
case
Certainty to base case
Average Median 10% Percentile
90% Percentile
Discounted treatment costs in pre-LT phase for patients with MELD score<9, @ Year-20 listing, per to-be-transplanted patient
$71,621 39% $68,870 $65,009 $41,321 $101,380
Discounted treatment costs in pre-LT phase for patients with MELD score 10–19, @ Year-20 listing, per to-be-transplanted patient
$103,002 39% $99,293 $95,655 $66,804 $136,787
Discounted treatment costs in pre-LT phase for patients with MELD score 20–29, @ Year-20 listing, per to-be-transplanted patient
$342,614 36% $323,679 $317,667 $239,467 $416,221
Discounted treatment costs in pre-LT phase for patients with MELD score 30–39, @ Year-20 listing, per to-be-transplanted patient
$537,402 37% $507,360 $497,873 $367,022 $662,244
Discounted treatment costs in pre-LT phase for patients with MELD score>40, @ Year-20 listing, per to-be-transplanted patient
$867,564 37% $819,501 $803,749 $592,507 $1,069,105
Discounted total resources used from day of transplant to discharge, @ Year-20 listing, per transplanted patient
$836,788 37% $789,166 $779,109 $605,000 $988,004
Discounted total costs of treatment 10-years post-liver transplantation, @ Year-20, per operated patient
$949,391 36% $895,228 $881,537 $668,560 $1,143,166
An uncertainty analysis is used to assess the accuracy of the projections made, giving the percentage at which it’s likely to achieve (or exceed) the projected (base) value. (Example: the costs of hospital admission period are likely to be higher than the projections in 37% of the cases.) The uncertainty analysis also gives the averages (certainty equal to 50%) and the confidence intervals (the most likely values ranging from 10% to 90% percentiles).
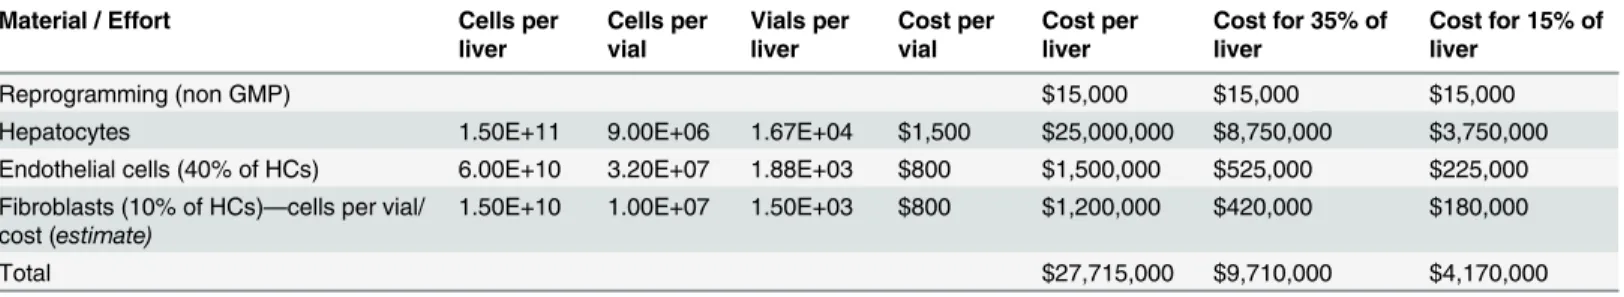
InTable 4we show the cost projections estimated based on the number of iPSC-derived hepatocytes and iPSC-derived endothelial cells along with donor-derived fibroblasts (not cur-rently a CDI catalog product) needed to populate the entire liver and represent a base case esti-mate representative of the high end of projected costs [32–34]. Included in the cost model in
Table 4is the list price associated with reprogramming primary tissue to iPSCs, which is
rela-tively insignificant. Most of the cost is associated with hepatocyte production. However, although reprogramming itself is not a major contributor to cost, selecting an optimal clone for production can require a considerable amount of expertise. In some instances of end-stage liver disease, and for inborn errors of liver metabolism, an entire liver may not be required and Table 3. Results of the Sensitivity Analysis.
Treatment costs metric Sensitivity Analysis
Input variable Index
Discounted treatment costs in pre-LT phase for patients with MELD score<9, @ Year-20 listing, per to-be-transplanted patient
Annual cost increase 24%
Percent annual change in time to transplant
22%
Average monthly spending in pre-LT phase for patients with MELD score<9
22%
Cost discount rate -17%
30 days pre-LT costs 12%
Discounted treatment costs in pre-LT phase for patients with MELD score 10–19, @ Year-20 listing, per to-be-transplanted patient
Percent annual change in time to transplant
40%
Annual cost increase 26%
Cost discount rate -18%
Discounted treatment costs in pre-LT phase for patients with MELD score 20–29, @ Year-20 listing, per to-be-transplanted patient
Annual cost increase 39%
Average monthly spending in pre-LT phase for patients with MELD score 20– 29
33%
Cost discount rate -28%
Discounted treatment costs in pre-LT phase for patients with MELD score 30–39, @ Year-20 listing, per to-be-transplanted patient
Average monthly spending in pre-LT phase for patients with MELD score 30– 39
42%
Annual cost increase 34%
Cost discount rate -24%
Discounted treatment costs in pre-LT phase for patients with MELD score>40, @ Year-20 listing, per to-be-transplanted patient
Average monthly spending in pre-LT phase for patients with MELD score 30– 39
42%
Annual cost increase 34%
Cost discount rate -24%
Discounted total resources used from day of transplant to discharge, @ Year-20 listing, per transplanted patient
Annual cost increase 54%
Cost discount rate -39%
Discounted total costs of treatment 10-years post-liver transplantation, @ Year-20, per operated patient
Annual cost increase 54%
Cost discount rate -39%
A sensitivity analysis assesses which model input has most influence on the model output, meaning a small change in that specific input value will result in high variation in the model output. Other model inputs might have a moderate influence (an input variation that would result in a comparable variation in the output) or low influence (meaning even a high variation in the input wouldn’t affect the output). A sensitivity analysis is designed to select the most sensitive inputs, for which high precision and accurate information are required.
auxiliary partial liver transplantation has been suggested as a therapeutic option [10]. For this reason, we’ve also projected the costs of manufacturing only 35% and 15% of a liver.
Discussion
The simple truth is that significantly more livers are needed for transplantation. Transplanta-tion is the definitive treatment for end-stage liver disease, yet one in ten people on the trans-plant waiting list die because of the dearth of organs. Additionally, the number of individuals on the waiting list gauges only a fraction of the true need. According to clinicians, thousands more could benefit from a transplant but are precluded from the waiting lists because they have not yet reached critical status. The shortfall of organs is predicted to rise in the coming decades given the increasing prevalence of liver-damaging viruses, a surge in fatty liver disease, and a buildup of environmental toxins.
The social need for greater availability of livers for transplant is bolstered by an economic argument. The epidemiology and treatment costs models forecast demand for liver transplan-tation will increase by 10% in 10 years and by 23% in 20 years. Total weighted treatment costs of a liver transplantation—including pre-operative, admission and post-operative phases—will increase from $1,427,805 per patient in Year 1 to $2,093,789 in Year 20 (Fig 4).
This study is subject to certain limitations with the major challenge being access to data-bases. To build and run the model, data was collected from different sources and databases available online (Table 1) which may have introduced errors in computing and forecasting the epidemiology and financial metrics. The result of studies relying on retrospective data may also be compromised by potential coding errors and incompleteness [35]. Additionally, as a conse-quence of the sparse data, the impact of the MELD score on treatment costs is only evaluated in the pre-liver transplant phase.
Moreover, our model excludes several new developments that are likely to modify the course of liver transplantation. Currently, the top four causes of chronic liver disease in patients on the U.S. liver transplant waitlist are chronic hepatitis C virus (HCV) infection, alcoholic liver disease (ALD), nonalcoholic steatohepatitis (NASH), and a combination of chronic HCV infection and ALD (HCV/ALD). However, these rankings may change. New direct-acting anti-viral agents are transforming the treatment of chronic hepatitis C. A recently approved single-tablet regimen of the hepatitis C virus (HCV) NS5A inhibitor ledipasvir and the NS5B inhibi-tor sofosbuvir (ledipasvir/sofosbuvir; Harvoni) has been reported highly effective [36–38]. However, it is an expensive therapy and cost may represent a barrier to treatment [39]. Also additional studies have demonstrated a lower than expected prevalence of chronic HCV in the U.S., raising the concern the decrease is secondary to HCV-related deaths [40]. Meanwhile, NASH increased 170 percent, making it the second leading etiology of chronic liver disease among new liver transplant waitlist registrants in 2013. During the same period, new waitlist registrants with ALD increased 45 percent, and registrants with chronic HCV infection Table 4. Projection of Costs to Manufacture a Liver from iPSCs.
Material / Effort Cells per
liver
Cells per vial
Vials per liver
Cost per vial
Cost per liver
Cost for 35% of liver
Cost for 15% of liver
Reprogramming (non GMP) $15,000 $15,000 $15,000
Hepatocytes 1.50E+11 9.00E+06 1.67E+04 $1,500 $25,000,000 $8,750,000 $3,750,000
Endothelial cells (40% of HCs) 6.00E+10 3.20E+07 1.88E+03 $800 $1,500,000 $525,000 $225,000 Fibroblasts (10% of HCs)—cells per vial/
cost (estimate)
1.50E+10 1.00E+07 1.50E+03 $800 $1,200,000 $420,000 $180,000
Total $27,715,000 $9,710,000 $4,170,000
increased 14 percent [41]. The number of patients with NASH awaiting liver transplantation is anticipated to continue climbing, while availability of donor organs is expected to decline. Combined, these factors reveal the changing epidemiology of patients awaiting liver transplan-tation in the U.S.
Additionally, several novel cellular therapies to induce tolerance in solid-organ transplant patients have entered early-phase clinical trials [42]. Although immunosuppression is neces-sary to prevent immune attacks on the transplanted organ, it also imposes substantial morbid-ity and mortalmorbid-ity risks for transplant recipients. Whether these novel cellular therapies aimed at improving organ tolerance will have a significant impact on the organ donor pool will have to be determined.
However, despite these limitations the financial outcomes forecasted in Year 1 in our model are in similar ranges as those reported by Buchanan [43] and co-workers (2009) for 990 patients ($77,100 with MELD score 6–14 to $237,300 with MELD score 28–40) for the period one-year pre-transplant; $267,200-$332,200, respectively, for the transplant admission period; and $71,300 to $88,000, respectively for the period one-year post-transplant [43].
From the results of Buchanan et al [43] one should note that the MELD score has a higher impact on treatment costs in the pre-transplant period compared to treatment costs of trans-plant admission and post-transtrans-plant periods. Also, high variability exists in the costs reported by the authors, with the coefficient of variation exceeding 100% in many cases (97% to 166% for the pre-transplantation-related costs; 70% to 76% for the hospital admission-related cost; and 150% to 211% for the one-year post-transplantation costs) [43]. If it's generally recognized that the MELD score is a driver of costs in liver transplantation, the latter result shows that other drivers exist and should be identified and accounted for.
Liver allocation in the U.S. is donation-based with the sickest patients prioritized using the Model for End-Stage Liver Disease (MELD) score. Following implementation of the MELD sys-tem, the number of patients who died while on the waiting list fell, but the health status of listed patients deteriorated. Care of wait-listed patients is expensive. The cost of treating severely ill patients, reflected by a high MELD score, requires longer hospital admissions, more frequent and longer use of Intensive Care Units, and more laboratory tests and medications [43].
Further complicating the problem, organ availability is limited not only by the number of donors, but also by the inability to converteligibledonor organs intoactualdonor organs. Schnitzler et al (2005) [44] have suggested that, due to the lack of identification of prospective donors and the difficulty in obtaining consent, the eligible-donor/actual-donor conversion rate is estimated to be just 42%. This represents an annual loss of 250,000 life-years in the U.S. alone. New measures have been employed to counter the organ shortage. The cold ischemia time (the time from aortic clamping in the donor to the time of removal from ice prior to trans-plantation) has been increased from 6 hours to more than 18 hours [45], and organs from donors with a high Donor Risk Index are being used [46]. Still, the shortage of livers for trans-plantation persists.
Social policy may ameliorate the shortage in the short term. Adopting an opt-out system, for example, will make all citizens automatic donors unless they choose to opt out and will cer-tainly increase the availability of organs. This will put the eligible-donor/actual-donor conver-sion rate at 100% and presumably will not fall below the current rate. Additionally, creating a marketplace for organs has proponents, but this proposed solution raises numerous ethical concerns, generating considerable opposition. Neither an opt-out system nor establishing a marketplace for organs is a likely probable solution.
manufacture of replacement organs is no longer science fiction. Relatively soon anyone need-ing a liver could have one bioengineered from one of their own skin cells. Because there will be no immune reaction, there will be no need for immunosuppressive drugs, an added clinical and financial benefit over using a cadaveric organ.
How far are we from a bioengineered organ? The factors that drive the self-organization of the cells comprising the liver are not yet fully detailed. The question becomes, do we need to recapitulate all the evolutionary programming that drives cells to form metazoan structures? Perhaps there are shortcuts. That’s the promise of decellularized scaffolds [47]. Will decellulari-zation provide the basis of the protocol to bioengineer a liver? Or, will it simply be a platform for studying the self-organization of the hepatocytes and endothelial cells that comprise a liver? It remains to be seen.
Blood or skin cells from a person with a high MELD score are already the sources of iPSCs from which hepatocyte precursor cells are made. In anin vitroorin vivobioreactor, or by means of bioprinting, these hepatocyte precursor cells will provide the building blocks for a customized liver that originates from patient-specific somatic cells.
Certainly the current tremendous cost ($9.7M) to bioengineer just 35% of a liver—a tissue mass that may be sufficient to maintain critical metabolic function—is not a viable option. However, these costs will decrease dramatically as this therapeutic approach gains traction. Why? Because the bulk of the manufacturing cost is associated with cell production and these costs will fall with economies of scale.
The time required for reprogramming and selecting a clone for production can be reduced by banking personal iPSCs (comprehensive iPSC banking will likely be a critical component of healthcare in the future), which places the focus on reducing the costs associated with multiple growth and differentiation media used in the manufacturing process.
Reagents comprised of growth factors and small molecules are used to activate and/or repress signaling pathways at key checkpoints that determine cellular fate. Pulling these molec-ular levers at the precise moments necessary to drive well-defined tissue specification across the appropriate germ layers of endoderm, ectoderm and mesoderm requires knowledge of the signaling mechanisms affecting gene regulation and protein signaling cascades.
Technicians begin the cell-production process upstream of differentiation with the initial culture of the stem cells. Stem-cell culture is typically effected in mTeSR or the more cost effi-cient and defined E8 media, both of which are composed of growth factors and signaling mole-cules. These media provide stable stem cell cultures in the absence of a feeder layer, minimizing variability and maintaining the cells in a state of readiness to enter differentiation.
There are multiple hepatocyte differentiation protocols. All follow the same approximate timeline of 25–30 days and employ similar induction factors [48–51] (bFGF and Activin A, HGF, Oncostatin M, Dexamethasone, etc.). Reagents comprise over 50% of current costs for differentiation from iPSCs, so achieving cost improvements here will be critical to the goal of manufacturing a liver. Beyond the issue of cost of differentiation, differentiated cells derived from iPSCs may still be immature, functionally resembling a fetal or neonatal phenotype. Achieving the appropriate cellular maturity may prove to be critical for most kinds of liver fail-ure. This is a realistic expectation given the stem-cell field is still in its adolescence and will con-tinue to expand at an accelerated rate over time. High-volume demand for affordable reagents to support manufacture of differentiated tissue will drive economies of scale.
or as ade novoengineered scaffold used in combination with a bioreactor device. Any of these approaches could lead to improvements in production scale and concomitant cost reductions. The cost of sequencing the first human genome was approximately $300 million [52,53]. (Factor in all the ground-laying research funded through government programs over the pre-ceding 15 years and the price tag exceeds $3 billion [52].) Today, a human genome can be sequenced in a few days for a cost of $3,000-$5,000 [54].
Given the potential to benefit from numerous cost-saving measures—lower reagent costs, improved production system technology, increased scale, and the use of earlier stage progenitor cells—future cell-manufacturing costs will certainly be a fraction of current estimates. It follows that the cost of bioengineering replacement livers for transplant will be financially feasible in the not too distant future.
Nevertheless, organ-engineering technology is in its infancy and will need to overcome countless translational hurdles. For instance, complete reestablishment of the liver micro-architecture would require incorporation of liver nonparenchymal cells (e.g. bile duct cells, sinusoidal endothelial cells, stellate cells, etc), necessitating iPSC differentiation for these cell types. Additionally, differentiated cells derived from iPSCs may still be immature, functionally resembling fetal or neonatal phenotype. Cell maturity may prove to be critical for diseases requiring functional differentiated cells. So although proof-of-principle for whole-organ assembly and transplantation has been shown for three of the solid organs (heart, liver, lungs), numerous obstacles must be overcome before the cells generated can be used widely in preclini-cal studies. Perhaps other innovative technologies already on the horizon (e.g. organ repro-gramming) may change the future of liver transplantation [55–57].
Supporting Information
S1 Economic Model. A 20-Year Epidemiology Model and Treatment Costs Model for Liver Transplantation.
(XLSX)
Acknowledgments
We thank the National Institutes of Health (DK099257) for its support of work by A.S.-G. We drew from data and analyses reported in the 2012 Annual Data Report of the US Organ Pro-curement and Transplantation Network and the Scientific Registry of Transplant Recipients have been supplied by the United Network for Organ Sharing and the Minneapolis Medical Research Foundation under contract with HHS/HRSA. Where appropriate, we also used 2014 data from the OPTN database. The authors alone are responsible for reporting and interpreting these data; the views expressed herein are those of the authors and not necessarily those of the U.S. Government.
Author Contributions
Conceived and designed the experiments: DH RL AS-G. Performed the experiments: DH DM. Analyzed the data: DH DM G. Contributed reagents/materials/analysis tools: DH DM AS-G. Wrote the paper: DH DM RL AS-AS-G.
References
1. Hoyert DL, Xu J. Deaths: preliminary data for 2011. Natl Vital Stat Rep. 2012; 61(6):1–51. PMID: 24984457.
3. Jimenez-Romero C, Caso Maestro O, Cambra Molero F, Justo Alonso I, Alegre Torrado C, Manrique Municio A, et al. Using old liver grafts for liver transplantation: where are the limits? World J Gastroen-terol. 2014; 20(31):10691–702. doi:10.3748/wjg.v20.i31.10691PMID:25152573; PubMed Central PMCID: PMC4138450.
4. U.S. Department of Health & Human Services HRaSA. Organ Procurement and Transplantation Net-work (OPTN). Available:http://optn.transplant.hrsa.gov/.
5. Busuttil RW, Tanaka K. The utility of marginal donors in liver transplantation. Liver Transpl. 2003; 9 (7):651–63. doi:10.1053/jlts.2003.50105PMID:12827549.
6. Zarrinpar A, Busuttil RW. Liver transplantation: past, present and future. Nat Rev Gastroenterol Hepa-tol. 2013; 10(7):434–40. doi:10.1038/nrgastro.2013.88PMID:23752825.
7. Graham JA, Guarrera JV. "Resuscitation" of marginal liver allografts for transplantation with machine perfusion technology. J Hepatol. 2014; 61(2):418–31. doi:10.1016/j.jhep.2014.04.019PMID: 24768755.
8. Cooper DK, Hara H, Ezzelarab M, Bottino R, Trucco M, Phelps C, et al. The potential of genetically-engineered pigs in providing an alternative source of organs and cells for transplantation. J Biomed Res. 2013; 27(4):249–53. doi:10.7555/JBR.27.20130063PMID:23885264; PubMed Central PMCID: PMC3721033.
9. Soltys KA, Soto-Gutierrez A, Nagaya M, Baskin KM, Deutsch M, Ito R, et al. Barriers to the successful treatment of liver disease by hepatocyte transplantation. J Hepatol. 2010; 53(4):769–74. doi:10.1016/j. jhep.2010.05.010PMID:20667616; PubMed Central PMCID: PMC2930077.
10. Ciria R, Davila D, Heaton N. Auxiliary liver transplantation in children. Curr Opin Organ Transplant. 2011; 16(5):489–93. doi:10.1097/MOT.0b013e32834a94cfPMID:21897245.
11. Converter of current to real US dollars (using GDP deflator) 2014 [cited 2014 6th November 2015]. Available:http://stats.areppim.com/calc/calc_usdlrxdeflator.php.
12. Yen EF, Hardinger K, Brennan DC, Woodward RS, Desai NM, Crippin JS, et al. Cost-effectiveness of extending Medicare coverage of immunosuppressive medications to the life of a kidney transplant. Am J Transplant. 2004; 4(10):1703–8. doi:10.1111/j.1600-6143.2004.00565.xPMID:15367228.
13. Torgerson D, Raftery J. Economics notes: measuring outcomes in economic evaluations. BMJ. 1999; 318(7195):1413. PMID:10334758; PubMed Central PMCID: PMC1115785.
14. (SRTR) OPaTNOaSRoTR. OPTN/SRTR 2012 Annual Data Report. Rockville, MD: Department of Health and Human Services, Health Resources and Services Administration. 2014:1–185.
15. Wiesner R, Edwards E, Freeman R, Harper A, Kim R, Kamath P, et al. Model for end-stage liver dis-ease (MELD) and allocation of donor livers. Gastroenterology. 2003; 124(1):91–6. doi:10.1053/gast. 2003.50016PMID:12512033.
16. Showstack J, Katz PP, Lake JR, Brown RS Jr., Dudley RA, Belle S, et al. Resource utilization in liver transplantation: effects of patient characteristics and clinical practice. NIDDK Liver Transplantation Database Group. JAMA. 1999; 281(15):1381–6. PMID:10217053.
17. Washburn WK, Pollock BH, Nichols L, Speeg KV, Halff G. Impact of recipient MELD score on resource utilization. Am J Transplant. 2006; 6(10):2449–54. doi:10.1111/j.1600-6143.2006.01490.xPMID: 16889598.
18. Bentley TS, Hanson SG, Hauboldt RH. 2011 U.S. organ and tissue transplant cost estimates and dis-scussion. Milliman Research Report. 2011:2–16.
19. California Pacific Medical Center website 2014. Available:http://www.cpmc.org/advanced/liver/ patients/topics/finance.html.
20. Longworth L, Young T, Buxton MJ, Ratcliffe J, Neuberger J, Burroughs A, et al. Midterm cost-effective-ness of the liver transplantation program of England and Wales for three disease groups. Liver Transpl. 2003; 9(12):1295–307. doi:10.1016/j.lts.2003.09.012PMID:14625830.
21. Ammori JB, Pelletier SJ, Lynch R, Cohn J, Ads Y, Campbell DA, et al. Incremental costs of post-liver transplantation complications. J Am Coll Surg. 2008; 206(1):89–95. doi:10.1016/j.jamcollsurg.2007. 06.292PMID:18155573.
22. Global Health Expenditure Database [Internet]. World Health Organization 2014. Available:http://apps. who.int/nha/database/Select/Indicators/en.
23. Axelrod DA, Dzebisashvili N, Lentine K, Segev DL, Dickson R, Tuttle-Newhall E, et al. Assessing varia-tion in the costs of care among patients awaiting liver transplantavaria-tion. Am J Transplant. 2014; 14(1):70– 8. doi:10.1111/ajt.12494PMID:24165015.
25. Ott HC, Clippinger B, Conrad C, Schuetz C, Pomerantseva I, Ikonomou L, et al. Regeneration and orthotopic transplantation of a bioartificial lung. Nat Med. 2010; 16(8):927–33. doi:10.1038/nm.2193 PMID:20628374.
26. Ott HC, Matthiesen TS, Goh SK, Black LD, Kren SM, Netoff TI, et al. Perfusion-decellularized matrix: using nature's platform to engineer a bioartificial heart. Nat Med. 2008; 14(2):213–21. doi:10.1038/ nm1684PMID:18193059.
27. Petersen TH, Calle EA, Zhao L, Lee EJ, Gui L, Raredon MB, et al. Tissue-engineered lungs for in vivo implantation. Science. 2010; 329(5991):538–41. doi:10.1126/science.1189345PMID:20576850; PubMed Central PMCID: PMC3640463.
28. Song JJ, Guyette JP, Gilpin SE, Gonzalez G, Vacanti JP, Ott HC. Regeneration and experimental orthotopic transplantation of a bioengineered kidney. Nat Med. 2013; 19(5):646–51. doi:10.1038/nm. 3154PMID:23584091; PubMed Central PMCID: PMC3650107.
29. Uygun BE, Soto-Gutierrez A, Yagi H, Izamis ML, Guzzardi MA, Shulman C, et al. Organ reengineering through development of a transplantable recellularized liver graft using decellularized liver matrix. Nat Med. 2010; 16(7):814–20. doi:10.1038/nm.2170PMID:20543851; PubMed Central PMCID: PMC2930603.
30. Yagi H, Fukumitsu K, Fukuda K, Kitago M, Shinoda M, Obara H, et al. Human-scale whole-organ bioen-gineering for liver transplantation: a regenerative medicine approach. Cell Transplant. 2013; 22 (2):231–42. doi:10.3727/096368912X654939PMID:22943797; PubMed Central PMCID: PMC3682787.
31. Takahashi K, Tanabe K, Ohnuki M, Narita M, Ichisaka T, Tomoda K, et al. Induction of pluripotent stem cells from adult human fibroblasts by defined factors. Cell. 2007; 131(5):861–72. Epub 2007/11/24. doi: 10.1016/j.cell.2007.11.019PMID:18035408.
32. Sohlenius-Sternbeck AK. Determination of the hepatocellularity number for human, dog, rabbit, rat and mouse livers from protein concentration measurements. Toxicol In Vitro. 2006; 20(8):1582–6. doi:10. 1016/j.tiv.2006.06.003PMID:16930941.
33. Si-Tayeb K, Lemaigre FP, Duncan SA. Organogenesis and development of the liver. Dev Cell. 2010; 18(2):175–89. doi:10.1016/j.devcel.2010.01.011PMID:20159590.
34. Blouin A, Bolender RP, Weibel ER. Distribution of organelles and membranes between hepatocytes and nonhepatocytes in the rat liver parenchyma. A stereological study. J Cell Biol. 1977; 72(2):441–55. PMID:833203; PubMed Central PMCID: PMC2110997.
35. Menzin J, White LA, Nichols C, Deniz B. The economic burden of advanced liver disease among patients with hepatitis C virus: a large state Medicaid perspective. BMC Health Serv Res. 2012; 12:459. doi:10.1186/1472-6963-12-459PMID:23241078; PubMed Central PMCID: PMC3529684.
36. Inc. GS. Harvoni (Ledipasvir and Sofosbuvir) tablets for oral use: US prescribing information. European Medicines Agency. 2015.
37. Harvoni (ledipasvir/sofosbuvir) film-coated tablets: EU summary of product characteristics. 2014.
38. Pawlotsky J-M. Hepatitis C treatment: the data flood goes on-an update from the liver meeting 2014. Gastroenterology. 2015; 148(3):468–79. Epub 2015 Jan 7. doi:10.1053/j.gastro.2015.01.002PMID: 25576860
39. Hoofnagle JH, Sherker AH. Therapy for hepatitis C—the costs of success. N Engl J Med. 2014; 370 (16):1552–3. doi:10.1056/NEJMe1401508PMID:24725236.
40. Denniston MM, Jiles RB, Drobeniuc J, Klevens RM, Ward JW, McQuillan GM, et al. Chronic hepatitis C virus infection in the United States, National Health and Nutrition Examination Survey 2003 to 2010. Ann Intern Med. 2014; 160(5):293–300. doi:10.7326/M13-1133PMID:24737271.
41. Wong RJ, Aguilar M, Cheung R, Perumpail RB, Harrison SA, Younossi ZM, et al. Nonalcoholic steato-hepatitis is the second leading etiology of liver disease among adults awaiting liver transplantation in the United States. Gastroenterology. 2015; 148(3):547–55. doi:10.1053/j.gastro.2014.11.039PMID: 25461851.
42. Geissler EK, Hutchinson JA. Cell therapy as a strategy to minimize maintenance immunosuppression in solid organ transplant recipients. Curr Opin Organ Transplant. 2013; 18(4):408–15. doi:10.1097/ MOT.0b013e328363319dPMID:23838645.
43. Buchanan P, Dzebisashvili N, Lentine KL, Axelrod DA, Schnitzler MA, Salvalaggio PR. Liver transplan-tation cost in the model for end-stage liver disease era: looking beyond the transplant admission. Liver Transpl. 2009; 15(10):1270–7. doi:10.1002/lt.21802PMID:19790155.
45. Schnitzler MA, Woodward RS, Brennan DC, Whiting JF, Tesi RJ, Lowell JA. The economic impact of preservation time in cadaveric liver transplantation. Am J Transplant. 2001; 1(4):360–5. PMID: 12099381.
46. Salvalaggio PR, Dzebisashvili N, MacLeod KE, Lentine KL, Gheorghian A, Schnitzler MA, et al. The interaction among donor characteristics, severity of liver disease, and the cost of liver transplantation. Liver Transpl. 2011; 17(3):233–42. doi:10.1002/lt.22230PMID:21384505.
47. Soto-Gutierrez A, Wertheim JA, Ott HC, Gilbert TW. Perspectives on whole-organ assembly: moving toward transplantation on demand. J Clin Invest. 2012; 122(11):3817–23. doi:10.1172/JCI61974 PMID:23114604; PubMed Central PMCID: PMC3484436.
48. Sullivan GJ, Hay DC, Park IH, Fletcher J, Hannoun Z, Payne CM, et al. Generation of functional human hepatic endoderm from human induced pluripotent stem cells. Hepatology. 2010; 51(1):329–35. doi: 10.1002/hep.23335PMID:19877180; PubMed Central PMCID: PMC2799548.
49. Si-Tayeb K, Noto FK, Nagaoka M, Li J, Battle MA, Duris C, et al. Highly efficient generation of human hepatocyte-like cells from induced pluripotent stem cells. Hepatology. 2010; 51(1):297–305. doi:10. 1002/hep.23354PMID:19998274; PubMed Central PMCID: PMC2946078.
50. Ulvestad M, Nordell P, Asplund A, Rehnstrom M, Jacobsson S, Holmgren G, et al. Drug metabolizing enzyme and transporter protein profiles of hepatocytes derived from human embryonic and induced pluripotent stem cells. Biochem Pharmacol. 2013; 86(5):691–702. doi:10.1016/j.bcp.2013.06.029 PMID:23856292.
51. Ma X, Duan Y, Tschudy-Seney B, Roll G, Behbahan IS, Ahuja TP, et al. Highly efficient differentiation of functional hepatocytes from human induced pluripotent stem cells. Stem Cells Transl Med. 2013; 2 (6):409–19. doi:10.5966/sctm.2012-0160PMID:23681950; PubMed Central PMCID: PMC3673753.
52. The Human Genome Project Completion: Frequently Asked Questions: National Human Genome Research Institute; 2010 [cited 2010 01/07/2015]. Available:http://www.genome.gov/11006943.
53. Yarbrough C, Thomson A. International Human Genome Sequencing Consortium Announces“Working Draft”of Human Genome 2000. Available:http://www.nih.gov/news/pr/jun2000/nhgri-26.htm.
54. Hayden EC. Technology: The $1,000 genome. Nature. 2014; 507(7492):294–5. doi:10.1038/507294a PMID:24646979.
55. Bredenkamp N, Ulyanchenko S, O'Neill KE, Manley NR, Vaidya HJ, Blackburn CC. An organized and functional thymus generated from FOXN1-reprogrammed fibroblasts. Nat Cell Biol. 2014; 16(9):902–8. doi:10.1038/ncb3023PMID:25150981; PubMed Central PMCID: PMC4153409.
56. Nishikawa T, Bell A, Brooks JM, Setoyama K, Melis M, Han B, et al. Resetting the transcription factor network reverses terminal chronic hepatic failure. J Clin Invest. 2015; 125(4):1533–44. doi:10.1172/ JCI73137PMID:25774505.