www.atmos-chem-phys.net/17/1759/2017/ doi:10.5194/acp-17-1759-2017
© Author(s) 2017. CC Attribution 3.0 License.
Anthropogenic influences on the physical state of submicron
particulate matter over a tropical forest
Adam P. Bateman1, Zhaoheng Gong1, Tristan H. Harder2,a, Suzane S. de Sá1, Bingbing Wang3,4, Paulo Castillo5, Swarup China3, Yingjun Liu1, Rachel E. O’Brien2,b, Brett B. Palm6, Hung-Wei Shiu3,c, Glauber G. Cirino7, Ryan Thalman5,d, Kouji Adachi8, M. Lizabeth Alexander3, Paulo Artaxo9, Allan K. Bertram10, Peter R. Buseck11, Mary K. Gilles2, Jose L. Jimenez6, Alexander Laskin3, Antonio O. Manzi7, Arthur Sedlacek5, Rodrigo A. F. Souza12, Jian Wang5, Rahul Zaveri3, and Scot T. Martin1,13
1School of Engineering and Applied Sciences, Harvard University, Cambridge, MA, USA 2Chemical Sciences Division, Lawrence Berkeley National Laboratory, Berkeley, CA, USA
3William R. Wiley Environmental Molecular Sciences Laboratory, Pacific Northwest National Laboratory, Richland, WA, USA
4State Key Laboratory of Marine Environmental Science, College of Ocean and Earth Sciences, Xiamen University, Xiamen, China
5Environmental and Climate Sciences Department, Brookhaven National Laboratory, Upton, NY, USA 6Department of Chemistry and Cooperative Institute for Research in Environmental Sciences (CIRES), University of Colorado, Boulder, CO, USA
7National Institute of Amazonian Research, Manaus, Amazonas, Brazil
8Atmospheric Environment and Applied Meteorology Research Department, Meteorological Research Institute, Tsukuba, Ibaraki, Japan
9Departamento de Física Aplicada, University of São Paulo, São Paulo, Brazil 10Department of Chemistry, University of British Columbia, Vancouver, BC, Canada
11School of Earth and Space Exploration & School of Molecular Sciences, Arizona State University, Tempe, AZ, USA 12Amazonas State University, Manaus, Amazonas, Brazil
13Department of Earth and Planetary Sciences, Harvard University, Cambridge, MA, USA anow at: Physikalisches Institut, Universität Würzburg, Am Hubland, 97074 Würzburg, Germany bnow at: Department of Civil and Environmental Engineering, Massachusetts Institute of Technology, Cambridge, MA, USA
cnow at: Scientific Research Division, National Synchrotron Radiation Research Center, Hsinchu, Taiwan 30076 dnow at: Departments of Chemistry and Natural Resources, Snow College, Richfield, UT, USA
Correspondence to:Scot T. Martin ([email protected])
Received: 17 July 2016 – Published in Atmos. Chem. Phys. Discuss.: 17 August 2016 Revised: 3 January 2017 – Accepted: 5 January 2017 – Published: 6 February 2017
Abstract. The occurrence of nonliquid and liquid physi-cal states of submicron atmospheric particulate matter (PM) downwind of an urban region in central Amazonia was inves-tigated. Measurements were conducted during two intensive operating periods (IOP1 and IOP2) that took place during the wet and dry seasons of the GoAmazon2014/5 campaign. Air masses representing variable influences of background conditions, urban pollution, and regional- and
parti-cles adhered as a campaign average. Secondary organic ma-terial, produced for the most part by the oxidation of volatile organic compounds emitted from the forest, produces liquid PM over this tropical forest. During periods of anthropogenic influence, by comparison, the rebound fraction dropped to as low as 60 % at 95 % RH. Analyses of the mass spec-tra of the atmospheric PM by positive-matrix factorization (PMF) and of concentrations of carbon monoxide, total par-ticle number, and oxides of nitrogen were used to identify time periods affected by anthropogenic influences, includ-ing both urban pollution and biomass burninclud-ing. The occur-rence of nonliquid PM at high RH correlated with these in-dicators of anthropogenic influence. A linear model having as output the rebound fraction and as input the PMF fac-tor loadings explained up to 70 % of the variance in the ob-served rebound fractions. Anthropogenic influences can con-tribute to the presence of nonliquid PM in the atmospheric particle population through the combined effects of molec-ular species that increase viscosity when internally mixed with background PM and increased concentrations of nonliq-uid anthropogenic particles in external mixtures of anthro-pogenic and biogenic PM.
1 Introduction
Particulate matter (PM) directly affects the Earth’s climate by scattering and absorbing solar radiation and indirectly through effects on clouds (Ramanathan et al., 2001). The magnitude of these effects depends in part on the physical and chemical properties of the particulate matter (Andreae and Rosenfeld, 2008). The physical state of PM, as liquid or nonliquid, can influence the growth rates of small parti-cles and ultimately the production of cloud condensation nu-clei (CCN) (Riipinen et al., 2011; Perraud et al., 2012). Liq-uid particles pose negligible in-particle diffusion barriers for condensing species and therefore can grow rapidly. By com-parison, nonliquid particles, referring to both semisolid and solid particles, can have different behavior. For some con-ditions, semisolid particles can grow slowly because of in-particle limits on rates of molecular diffusion, and solid par-ticles can grow even more slowly when limited to surface ad-sorption (Riipinen et al., 2012; Shiraiwa and Seinfeld, 2012; Li et al., 2015). Liquid compared to nonliquid PM can also affect reactivity (Kuwata and Martin, 2012; Li et al., 2015). As a consequence of the differing growth mechanisms, the growth of small particles can be relatively disfavored in a population of liquid particles of heterogeneous sizes com-pared to a similar population of nonliquid particles (Zaveri et al., 2014). An implication can be that CCN concentrations are ultimately greater for a population of nonliquid particles that grows to CCN sizes, as compared to a population of liq-uid particles.
Secondary organic material (SOM), produced by the oxi-dation of biogenic volatile organic compounds (BVOCs), is a major source of atmospheric PM, especially over forested re-gions where SOM often dominates the mass concentration of submicron PM (Hallquist et al., 2009; Jimenez et al., 2009). The physical state of SOM has been studied in both labo-ratory (Vaden et al., 2011; Kuwata and Martin, 2012; Per-raud et al., 2012; Saukko et al., 2012; Renbaum-Wolff et al., 2013; Kidd et al., 2014; Bateman et al., 2015; Li et al., 2015; Liu et al., 2015; Pajunoja et al., 2015; Song et al., 2015) and ambient environments (Virtanen et al., 2010; O’Brien et al., 2014; Bateman et al., 2016; Pajunoja et al., 2016). For back-ground conditions of the Amazonian tropical forest, a re-gion dominated by isoprene-derived SOM and high RH, PM was mostly liquid (Bateman et al., 2016). For a boreal forest in northern Europe, a region dominated by pinene-derived SOM and low RH, PM was largely nonliquid (Virtanen et al., 2010). The combined set of laboratory and ambient stud-ies shows that the physical state of PM with high SOM con-tent depends on the surrounding relative humidity (RH). This effect arises in part because organic particles are hygroscopic to various extents depending on composition. Water absorp-tion, which is favored at elevated RH, has a plasticizing effect on physical state (Koop et al., 2011).
The physical state of PM affected by urban pollution over forests remains largely unexplored. A single day of ambient observations in central Amazonia suggested that ambient PM affected by urban pollution tended toward a nonliquid state (Bateman et al., 2016), and laboratory studies support the idea of an important modulating role of pollution in the phys-ical state of SOM. A nonliquid state was favored for SOM produced from single-ring aromatic species (Liu et al., 2015; Song et al., 2015) as well as SOM mixed with polycyclic aro-matic hydrocarbons (PAHs) (Zelenyuk et al., 2012; Abram-son et al., 2013; Berkemeier et al., 2014). Organic molecules associated with urban pollution and industrial activities tend to be less hygroscopic than biogenic SOM (Hersey et al., 2013). When internally mixed within biogenic SOM, the an-thropogenic molecules have a tendency to reduce water up-take and thereby increase the viscosity of the mixed particles. A similar line of reasoning leads to an identical hypothesis for the effects of biomass burning emissions. Compared to prevailing background conditions of SOM dominance over many forests, PM produced by biomass burning leads to a net effect of decreased water uptake when the PM mixes into the background particle population (Dusek et al., 2011).
and IOP2) of the GoAmazon2014/5 experiment, correspond-ing to the wet and dry seasons (Martin et al., 2016). The re-search site (−3.2133◦,−60.5987◦), called “T3”, was located 70 km downwind of the city of Manaus, with a population of 2 million, in central Amazonia. Air masses representing background conditions, urban pollution, and regional- and continental-scale biomass burning passed over the research site. Herein, anthropogenic influence refers to all but back-ground conditions. Under backback-ground conditions, the submi-cron PM in this region is dominated by biogenic SOM (Chen et al., 2009, 2015).
2 Experimental design
An impactor apparatus was used for the study of particle re-bound (Bateman et al., 2014, 2015, 2016; Li et al., 2016). The apparatus was housed inside a temperature-controlled research trailer at the T3 site. Particulate matter was sampled at 5 m above ground through copper tubing with an outer di-ameter of 13 mm (0.5 in.). In sequence, a drying unit reduced the sampled flow to 25 % RH or lower, a differential mobil-ity analyzer (DMA; TSI 3085) selected a subpopulation of dried particles having a narrow distribution of electric mo-bility, and a humidification unit (Nafion tubes; Perma Pure, MD 110) elevated the RH of the mobility-filtered flow to the targeted RH of a measurement. The drying unit consisted of a Nafion drier in series with a silica gel diffusion drier, and the silica gel was replaced every 2 days. After passing the dryer, DMA, and humidifier, the resulting flow was split and passed through three impactors operated in parallel. Labelsi, ii, andiiirefer to each of the three impactors. Each impactor was operated at a flow rate of 1.0 L min−1, corresponding to a set point aerodynamic diameterda∗of 84.9±5.4 nm (Bate-man et al., 2014). Particle number concentrations, denoted by Ni, Nii, or Niii, exiting the impactors were measured
by three independent condensation particle counters (CPCs; TSI 3010). Measurements were conducted from 14 Febru-ary to 16 March 2014 during IOP1 and from 4 September to 15 October 2014 during IOP2.
The three impactors differed from one another by having uncoated, coated, or no impaction plate. The impactor with the uncoated plate passed both nonimpacted and rebounded particles. The impactor with the coated plate (Dow Corn-ing high-vacuum grease) passed only nonimpactCorn-ing particles. The impactor with no plate passed all particles. Its purpose was to serve as a compensation arm for possible miscella-neous particle losses, such as wall loss. Based on the parti-cle number concentrations measured downstream of the im-pactors, the rebound fraction was calculated as follows (Bate-man et al., 2014):
f = Ni−Nii Niii−Nii
. (1)
The terms Ni,Nii, and Niii represent the particle number
concentration measured downstream of the impactors with uncoated, coated, and no impaction plate, respectively. The standard deviation of the rebound fraction was based on er-ror propagation for uncertainty inNofN−1/2(Agarwal and Sem, 1980).
A rebound curve representingf(RH) constituted an indi-vidual data set. For most measurements, the DMA setting for electric mobility was held constant (typically 190 nm), the RH in the humidification unit was changed stepwise every few minutes, andf was continuously recorded. Additional protocols of DMA settings and RH profiles were used in a few cases. All protocols, including differences between IOP1 and IOP2, are described in Sect. S1 of the Supplement.
In conjunction with the rebound measurements, parti-cles were collected for imaging by transmission electron microscopy (TEM) and scanning transmission X-ray mi-croscopy (STXM). Images in some cases can directly suggest the liquid or nonliquid state of individual particles (O’Brien et al., 2014; Wang et al., 2016). Samples for imaging were collected as follows. A fourth impactor was added in paral-lel with the other three impactors. Imaging substrates were affixed to the impaction plate, and multiple substrates were mounted to the plate for concurrent collection for the vari-ous microscopy techniques. Substrates included grids coated with formvar (EMJapan Co., Tokyo, Japan) or lacey carbon (Ted Pella Inc., USA) for TEM and silicon nitride membrane windows (Silson, UK) for STXM. The flow rate and set point aerodynamic diameter of the fourth impactor were the same as for the other three impactors. The collected particles rep-resented those that adhered to the substrate at impact, and an assumption in the analysis is that rebound from the substrate was similar to that from the uncoated plate. The flow through this fourth impactor was pulled by an in-line TEM autosam-pler (Arios Inc., Tokyo, Japan; Adachi et al., 2014). In this way, the setup separately collected particles that adhered to the grids on the impaction plate and particles that rebounded from the impaction plate and passed to the autosampler. The autosampler collected particles having aerodynamic diame-ters from 60 to 350 nm. Particles adhered to the TEM strates in the autosampler, yet rebounded from the TEM sub-strates in the impactor because of the significantly different particle impact velocities between the two impactors (i.e., cut point and impactor design). Samples were collected for TEM analysis between 30 September and 15 October 2014. Sam-ples were collected for STXM analysis between 01:00 and 10:00 UTC on 1 October 2014.
through bright-field microscopy, and particle composition was investigated by EDS. For the STXM at a fixed photon energy, an image was obtained by detecting the transmitted light at each pixel while raster scanning the sample. Spa-tially resolved NEXAFS spectra were obtained from a set of images recorded at different photon energies. The NEXAFS spectra provided chemical bonding information and quanti-tative elemental ratios (Moffet et al., 2010a, b; O’Brien et al., 2014; Piens et al., 2016). Section S2 of the Supplement presents further technical information concerning the TEM and STXM/NEXAFS analyses.
Additional colocated measurements used in the data anal-ysis herein included a high-resolution time-of-flight aerosol mass spectrometer (AMS; Aerodyne Inc.), a single-particle soot photometer (SP2; Droplet Measurement Technologies), a size-resolved cloud condensation nuclei counter (CCNC; Droplet Measurement Technologies, CCNC-100), a conden-sation particle counter (TSI, CPC 3772) for measuring parti-cle number concentrations, an integrated cavity output spec-troscope (ICOS; Los Gatos) for measuring carbon monox-ide (CO) concentration, and a trace-level enhanced detec-tor (TLE; Thermo Scientific, Model 42i, with further cus-tomization) for the measuring concentrations of nitrogen ox-ides (NOy). The latter three instruments were deployed at the
T3 site as part of the US Department of Energy (DOE) Atmo-spheric Radiation Measurement (ARM) Climate Research Facility, including the ARM Mobile Facility One (AMF-1) and the Mobile Aerosol Observing System (MAOS) (Mather and Voyles, 2013; Martin et al., 2016). This facility also col-lected the meteorological data used herein, including tem-perature, relative humidity, wind direction, and wind speed. The AMS measured the chemical composition in real time of non-refractory submicron particles (DeCarlo et al., 2006). The high-resolution data of the organic component in “V-mode” were used in conjunction with positive-matrix factor-ization (PMF) analysis (Ulbrich et al., 2009) to obtain sta-tistical factors and the associated time series of factor load-ings for each season (de Sá et al., 2016). As a surrogate for concentrations of black carbon, the SP2 measured the time-resolved scattering and incandescence produced by ir-radiated refractory, light-absorbing components of individual particles with volume-equivalent diameters between 70 and 600 nm (Schwarz et al., 2006; Moteki and Kondo, 2007). The size-resolved CCN activity was obtained by classifying dry particles using a DMA (TSI 3081) and then exposing them successively to a range of supersaturations inside the CCNC (Thalman et al., 2017). The hygroscopicity and CCN activ-ity were analyzed viaκ-Köhler theory, which relates parti-cle critical supersaturation to the initial dry diameter and hy-groscopicity (Petters and Kreidenweis, 2007; Petters et al., 2009).
3 Results and discussion 3.1 Rebound observations
Particle rebound or particle adhesion at impact depends on the balance of energies. Particle rebound occurs when the kinetic energy before impact is greater than the sum of dis-sipation and surface adhesion energies after impact (Tsai et al., 1990; Bateman et al., 2014). The dissipation energy of liquid particles is much greater than that of solid particles because of additional mechanisms of dissipation available to the former. As a point of reference, the transition from re-bound to adhesion occurs across a viscosity transition of 102 to 1 Pa s for sucrose particles for the operating conditions of the impactor (Bateman et al., 2015). The viscosity range cor-responding to the rebound transition can depend on particle composition, but this aspect is not investigated herein.
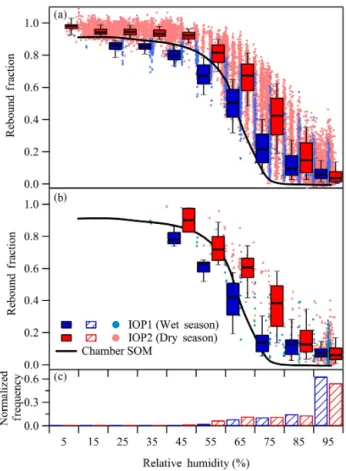
The rebound curves of particles with 190 nm in mobil-ity diameter are shown in Fig. 1a for IOP1 and IOP2. For RH < 50 %, the rebound fraction was between 0.8 and 1.0. For RH > 50 %, the rebound fraction decreased monotoni-cally to a low value, typimonotoni-cally 0. The shape of the rebound curve in Fig. 1a is similar to that for particles of secondary organic material produced in the Harvard Environmental Chamber (Bateman et al., 2015). The rebound fraction of SOM particles produced from isoprene orα-pinene became 0 for RH > 90 %.
The subset of the data for which the apparatus RH matched the ambient RH is shown in Fig. 1b (see Sect. S3 of the Sup-plement). In light of the distribution of ambient RH values (see Fig. 1c), the data set in Fig. 1b implies that submicron PM in this tropical environment was liquid most of the time. Bateman et al. (2016) reported such a result for observations under background conditions at this site for data sets col-lected in 2013 a few months before GoAmazon2014/5 began. The results reported for GoAmazon2014/5 represent a longer time series (i.e., 550 compared to 30 rebound curves) and re-inforce the generality of the earlier results found by Bateman et al. (2016) on the prevalence of liquid PM for this forested region under background conditions.
Figure 1.Rebound fraction as a function of apparatus relative hu-midity during IOP1 (blue) and IOP2 (red) corresponding to the wet and dry seasons, respectively, in central Amazonia. Panel(a)shows all measurements. Panel(b)shows the subset of data for which the apparatus RH matched the ambient relative humidity (see Supple-ment Sect. S3). Panel(c)represents the probability density function of relative humidity at the T3 site during the wet and dry seasons of 2014. Points represent rebound measurements for particles having mobility diameters of 190 nm. Statistics for measurements groups by relative humidity are represented in box–whisker format. A hor-izontal line within the box indicates the median of the points, the horizontal lines at the box boundaries indicate quartiles, and the horizontal lines most distant from the box indicate 10 and 90 % quantiles. For comparison, the black line shows the rebound curve for particles of secondary organic material produced by photooxida-tion of an isoprene/α–pinene mixture in the Harvard Environmental Chamber (Bateman et al., 2015).
and increased regional biomass burning during IOP2 in the dry season (see Sect. 3.2).
Probability density functions (PDFs) of the rebound frac-tion at 75 % RH based on the data sets of Fig. 1a are shown in Fig. 2 for (a) IOP1 and (b) IOP2 for three types of air masses during day- and nighttime-periods. The daytime period is 12:00 to 16:00 LT (local time) (16:00 to 20:00 UTC) and the nighttime period is 23:00 to 04:00 LT (03:00 to 08:00 UTC). Air masses were identified as influenced by local to regional biomass burning, as influenced by Manaus pollution, or as background. The classification scheme was based on
con-Figure 2.The probability density function of rebound fraction dur-ing(a)IOP1 and(b)IOP2 for categorization by type of air mass and time of day: background conditions (green), Manaus pollution (red), and biomass burning (orange). Solid and dashed lines repre-sent daytime (12:00 to 16:00 LT; 16:00 to 20:00 UTC) and nighttime measurements (23:00 to 04:00 LT; 03:00 to 08:00 UTC). Results are shown for an apparatus RH of 75 % and for particles having a mobil-ity diameter of 190 nm. No data sets fit the classification of Manaus pollution during the nighttime of IOP2 (i.e., absence of a red dashed line in panelb).
centration regimes of particle number, carbon monoxide, and odd nitrogen (NOy), as presented in Sect. S4 of the
Sup-plement. Background conditions included contributions from both natural processes and the long-distance transport and extensive oxidation of biomass burning emissions (Chen et al., 2009; Martin et al., 2010). Natural processes in this re-gion were dominated by the production of secondary organic material from oxidation of plant emissions (Martin et al., 2010; Pöschl et al., 2010). Figure 2a shows that the mode value of the PDF became higher under the influence of Man-aus pollution compared to background conditions, meaning that rebound became more probable, indicating an increasing presence of nonliquid PM at 75 % RH. In Fig. 2b, the mode value became even higher under the influence of biomass burning. For each type of air mass, the nighttime mode val-ues were higher than the daytime equivalents. The day–night differences were lowest under background conditions.
anthro-pogenic nonliquid particles from local emissions at night, in-cluding smoldering fires during IOP2. During the day, the boundary layer expands and dilution is more effective. In ad-dition, the production of liquid secondary organic material by biogenic processes is comparatively more rapid.
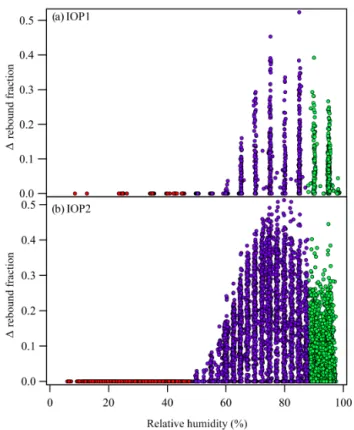
For further analysis, the rebound curves recorded under background conditions were averaged separately for IOP1 and IOP2 (see Fig. 1a and Sect. S5 of the Supplement). These two background-average curves served as references against which deviations in rebound fraction were calculated for all air masses. Rebound deviation represents the excess nonliq-uid PM over background conditions after detrending the data for dependence on relative humidity. The rebound deviations for IOP1 and IOP2 are plotted in Fig. 3. Rebound deviations as high as+0.5 in rebound fraction were observed. Statistics for Fig. 3 are summarized in Table S1, including the subset of measurements matched with the ambient RH. For the full set of data, including the full range of RH, rebound deviations greater than 0.1 represented 17 and 35 % of the observations during IOP1 and IOP2, respectively. These deviations, cor-responding to increased rebound and thus indicating an in-creasing presence of nonliquid PM, corresponded to the an-thropogenic influences, as developed further in Sect. 3.2.
3.2 Relationships between rebound and other observations
3.2.1 Case studies
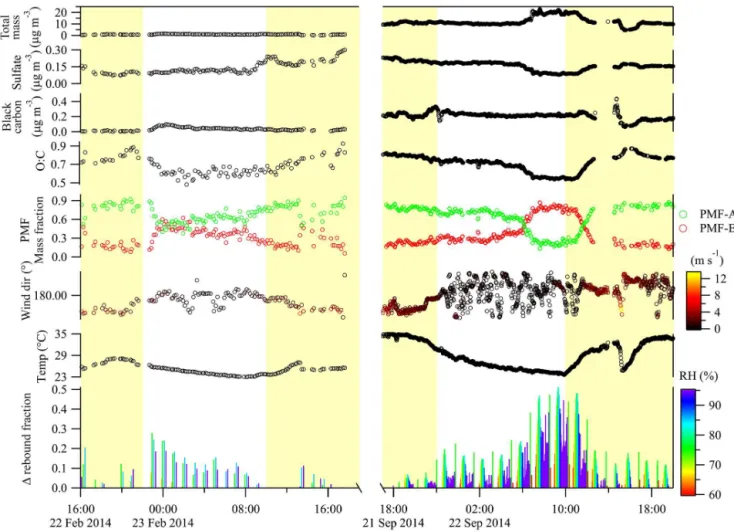
Transitions between background and polluted conditions across 24 h periods are presented in Fig. 4 as representative examples for each IOP. The bottom panel shows the devia-tion in rebound fracdevia-tion relative to the background-average curve (see Sect. S5 of the Supplement). Color coding distin-guishes relative humidity. From bottom to top, other panels in the figure show temperature, wind direction, wind speed, relative fractions of two groups of AMS PMF factor load-ings, black carbon (BC) concentration, sulfate concentration, and total submicron PM mass concentration. Processes con-tributing to the loading of PMF group A are largely associ-ated with the background atmosphere of Amazonia, includ-ing the possibility of long-range transport and extensive oxi-dation of biomass burning emissions. Processes contributing to the loading of PMF group B are largely associated with urban pollution and local and regional biomass burning (see Sect. S6 of the Supplement).
Shifts in the deviation of the rebound fraction from the background-average curve are apparent in the time series in the bottom panels of Fig. 4. At these times, the fractional loading of PMF group A decreased and that of PMF group B increased, indicating a shift away from background condi-tions. Background conditions were characterized by high loadings of PMF group A and small rebound deviations. In the left panel (IOP1) is an example of one type of anthro-pogenic event: black carbon concentration and the fractional
Figure 3.Deviation in rebound fraction relative to the average curve for background conditions during(a)IOP1 and(b)IOP2. Red, pur-ple, and green correspond to the RH regions of rebound, transition, and adhesion, respectively, for the background-average curve. Re-sults are shown for particles having a mobility diameter of 190 nm.
loading of PMF group B abruptly increased together. The re-bound deviation simultaneously increased, indicating an in-creasing presence of nonliquid PM, especially above 70 % RH. In the right panel (IOP2) is an example of a second type of anthropogenic event: the background air mass was gen-tly replaced by an air mass characterized by small increases in rebound deviation and fractional loading of PMF group B, yet it was lacking an associated increase in black carbon con-centration. In an example of a third type of anthropogenic event, this air mass was later replaced by an air mass charac-terized by a strong increase in the fractional loading of PMF group B, total PM mass concentration, and rebound devia-tion. Around 15:00 UTC, a convective event associated with rainfall decreased temperature, changed wind direction, and increased wind velocity; background conditions returned.
Figure 4.Time series of representative species during two pollution events for IOP1 and IOP2 (left and right sides of figures, respectively). Total mass concentration plotted in the figure represents the sum of the AMS and black carbon mass concentrations measured for submicron PM. The PMF mass fractions are expressed in relative terms to one another and necessarily sum to unity. Time on the abscissa is expressed in UTC.
Some of these adhering particles had a mixed composition, appearing as solid cores surrounded by halos of flattened liq-uid shells. The horizontal dimensions of the flattened parti-cles approached 1 to 2 µm for vertical dimensions of tens of nanometers. Pöschl et al. (2010) previously recorded simi-lar images for ambient particles in the wet season of 2008 in central Amazonia during the Amazonian Aerosol Char-acterization Experiment (AMAZE-08) (Martin et al., 2010). For comparison to the images of the adhering particles, ages of particles that rebounded at 95 % RH from the im-paction plate are shown in Fig. 5b. These particles were col-lected downstream of the impactor. The images show that these particles had high vertical dimensions and spherical or dome-like morphologies and thus suggest that the particles experienced little deformation upon impact, as expected for solid particles.
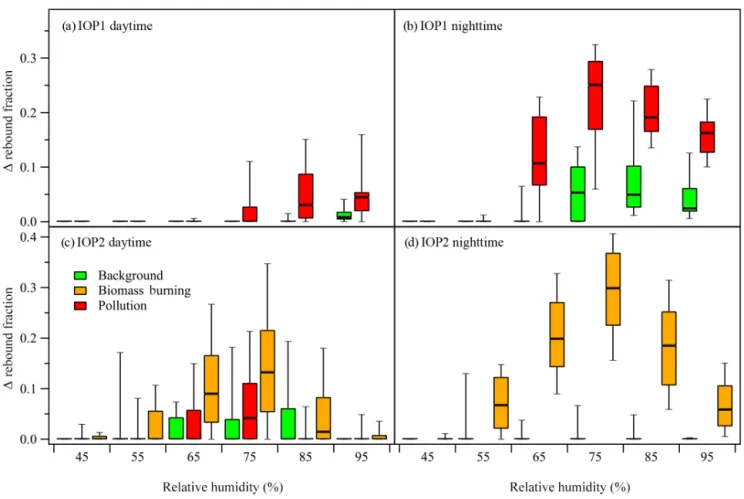
Figure 6.Deviation in rebound fraction for categorization by type of air mass and time of day. The box–whisker representation of the 10, 25, 50, 75, and 90 % quantiles of statistics for each RH bin is explained in the caption to Fig. 1. Air mass categorization is as for Fig. 2. Results are shown for particles having a mobility diameter of 190 nm.
3.2.2 Descriptive statistics
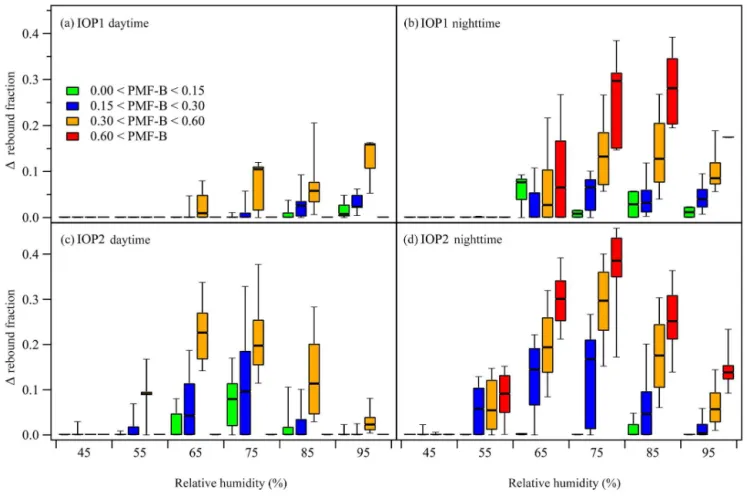
The results of Figs. 3 and 4 are further analyzed in Fig. 6. Rebound deviation statistics are shown by box–whisker rep-resentations for different windows of relative humidity. Fig-ure S1 of the Supplement presents an additional level of detail. The data sets were segregated for presentation by IOP1-IOP2, daytime-nighttime, and air mass type. For back-ground conditions, the rebound deviations relative to their av-erage were mostly 0, indicating that there was low variability among different background air masses. The exception was for the night periods of IOP1. By comparison, under anthro-pogenic influences, the rebound deviation was positive for both IOPs. Positive deviations were most significant between 65 and 95 % RH. In all cases, the nighttime deviations were greater than the daytime counterparts. For IOP2, the preva-lence of biomass burning confounded separate classifications of urban pollution and biomass burning, and a classification of biomass burning took precedent. Rebound deviations were strongest during these time periods. Statistics of the analysis are further summarized in Table S2 (see Sect. S7 of the Sup-plement). The average O : C ratios for the various air-mass classifications can be found in Table S3 of the Supplement.
3.2.3 Statistical correlations
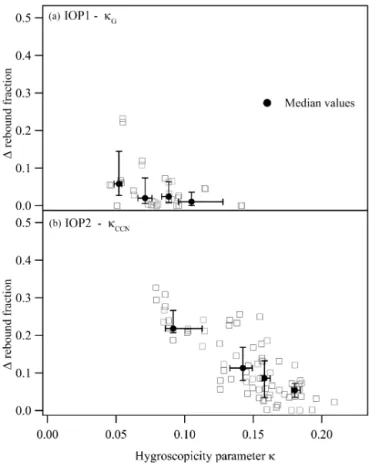
Given that water uptake is an important process for soften-ing organic material, scatter plots of the rebound deviation at 75 % RH with the hygroscopicity parameterκ are shown in Fig. 7a and b for the data sets from IOP1 and IOP2, respec-tively. Lower values ofκ represent decreased equilibrium in water uptake for a fixed RH (Petters and Kreidenweis, 2007). The plots show that the rebound deviation increased as theκ value decreased, meaning that particles of lower hygroscop-icity were less prone to being in liquid form.
The apparent shift to higherκ values from IOP1 to IOP2 might be explained by instrumental methods. During IOP1, κ values were measured using the impactor apparatus at sub-saturated RH (i.e., < 100 %) (see Sect. S8 of the Supplement). During IOP2,κ values were measured using a size-resolved CCN instrument at supersaturated RH (i.e., > 100 %) (Thal-man et al., 2017). Sub- and supersaturedκvalues can be sys-tematically different (Petters and Kreidenweis, 2007; Ruehl et al., 2016).
3.2.4 Chemical characteristics of rebounded particles An analysis of the relationship between rebound deviation and chemical characteristics is presented in Fig. 8 based on the fractional loading of PMF group B. The data sets are seg-regated for presentation by IOP1-IOP2, daytime-nighttime, and four bands of fractional loading. Within each panel, box– whisker statistics of rebound deviation are shown for differ-ent windows of relative humidity, ranging from 50 to 95 %. The figure shows that the rebound deviation increased at all RH values as the fractional loading of group B increased. The background-average curve used as the reference for re-bound deviation corresponded to a fractional loading of 0.00 to 0.15 for group B and 0.85 to 1.00 for group A. An increas-ing fractional loadincreas-ing of group B represented greater anthro-pogenic influence. The inference is that anthroanthro-pogenic influ-ences, represented by a combination of urban pollution and biomass burning, affected chemical composition in ways that increased the presence of nonliquid PM above 50 % RH.
Scatter plots between rebound deviation at 75 % RH and the fractional loading of group B are shown in Fig. 9a and b for the data sets of the two IOPs. The data points are col-ored according to the value of the hygroscopicity parame-ter κ. The plots show that rebound deviation increased for low hygroscopicity and high fractional loading of group B, in agreement with the presentation in Figs. 7a, b, and 8. Figures 9a and b further show that the highest rebound de-viations occurred during time periods affected by biomass burning and urban pollution, as characterized by the lowest values of κ and the highest fractional loadings of group B. Smaller κ values for lower fractional loadings of group B can be explained by the differences in O : C ratios between group A and B (Massoli et al., 2010): the O : C ratios were 0.95:0.95 (IOP1/IOP2) and 0.42:0.54 for groups A and B,
respectively.
Figure 7.Scatter plot of rebound deviation with the hygroscopic-ity parameterκfor(a)IOP1 and(b)IOP2. For clarity of presen-tation, data points are shown for apparatus RH values between 73 and 78 %, although the trend applies more broadly. As a guide to the eye, in each panel data are divided into four groups, and me-dians and quartiles of the groups are plotted as black circles and whiskers, respectively. Different techniques were used to measure κGandκCCN, as described in the main text.
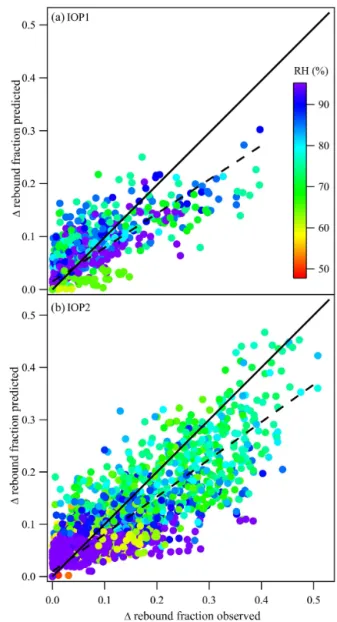
A model to predict rebound deviation based on chemical characteristics was constructed. The fractional loadings of PMF group A and B were used as model inputs, and model coefficients represented the effects of RH across nine bands (see Sect. S9 of the Supplement). The observed and predicted rebound deviations are plotted in Fig. 10. The corresponding coefficientsR2of determination were 0.65 and 0.72 for IOP1 and IOP2, respectively. Predicted values were biased high for low rebound deviation and biased low for high rebound devi-ation. The magnitudes of the model coefficients represented the relative importance of the two PMF groups in predicting rebound deviation (Table S5). In this regard group B domi-nated during both IOPs. This result is consistent with the role of anthropogenic influences in shifting the PM population to fewer liquid particles and more nonliquid particles.
influ-Figure 8.Deviation in rebound fraction for categorization by chemical characteristics. The box–whisker representation of the 10, 25, 50, 75, and 90 % quantiles of rebound fraction is explained in the caption to Fig. 1. The chemical characteristics are categorized by the fractional loading of PMF group B as < 0.15 (green), 0.15 to 0.3 (blue), 0.3 to 0.6 (orange), and > 0.6 (red).
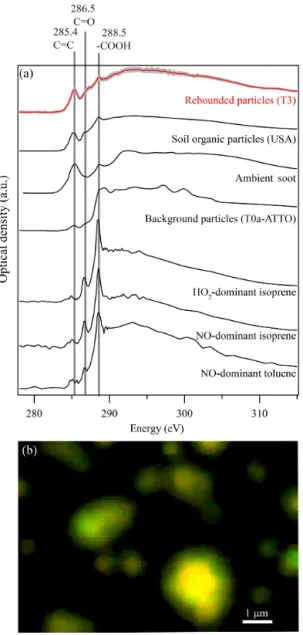
enced by biomass burning emissions. The carbon K-edge spectrum is shown in Fig. 11a, and the STXM image is shown in Fig. 11b. A notable feature of the NEXAFS spec-trum of the rebounded particles is the strong double bond. Pöhlker et al. (2012) previously collected NEXAFS spectra for samples collected at a background site in central Amazo-nia, and the strong feature of a double bond was absent. The spectra instead resembled those of different types of refer-ence biogenic secondary organic material.
For comparison to the spectrum collected of the rebounded particles, carbon K-edge spectra are shown for carbona-ceous particles collected in other field and laboratory stud-ies. Based on these results as well as those of the re-bound measurements, a hypothesis of soot or black carbon to explain the rebounding particles was ruled out on three grounds: the double-bond feature was homogeneously dis-tributed throughout the particles (Fig. 11b) compared to in-clusions that are typical for soot (Moffet et al., 2013; Knopf et al., 2014; O’Brien et al., 2014), rebound deviation and black carbon concentrations did not correlate (Fig. S3), and the spectroscopic signatures of rebounded particles and soot did not match (Fig. 11a). A hypothesis of VOC-derived
sec-ondary organic material, including possible changes because of shifts from HO2- to NO-dominant chemistry (P. Liu et al., 2016; Y. Liu et al., 2016), was also eliminated by compari-son of the NEXAFS spectrum of the rebounded particles to the reference spectra for laboratory samples. An important caveat to these interpretations is that some of the hypotheses ruled out for this particular day might still have a role to play on other days.
There was exceptional uniformity in the particle popula-tion characterized by STXM/NEXAFS, which could suggest that the rebounding PM represented distant sources or, al-ternatively, a strong single nearby source. The gray region around the red line in Fig. 11a illustrates the low variabil-ity across the population of analyzed particles (Fig. 11b). Moreover, the variability in the O : C ratio determined by the NEXAFS analysis was just±0.01 for O : C=0.34 (±0.03)
[±0.01], where the value in parentheses was the uncertainty
of the measurement and the value in the brackets was the variability across the image in Fig. 11b. During the same time period, the O : C ratio of the ambient PM was 0.77±0.04 by
dou-Figure 9.Scatter plot of rebound deviation with the fractional load-ing of PMF group B for(a)IOP1 and(b)IOP2. The data points are colored according to the corresponding hygroscopicity parameter κ. For clarity of presentation, data points are shown for apparatus RH values between 73 and 78 %, although the trend applies more broadly. As a guide to the eye, in each panel data are divided into four groups, and medians and quartiles of the groups are plotted as black circles and whiskers, respectively.
ble bond (C=C) content and increased fractional loading of
PMF group B.
Several speculations can be made for the origins of the particles leading to the data set from 1 October. The chem-ical constituents giving rise to the double bonds might de-rive from biological degradation products from incomplete combustion, such as in biomass burning (Tivanski et al., 2007; Keiluweit et al., 2010). Unexplained by this specula-tion, however, is the absence of a potassium signature in the NEXAFS spectra, which is typical of most biomass burning. Future collection of NEXAFS spectra would be advisable for the several different types of biomass burning in an Amazo-nian context, such as from nearby fields, regionally around Manaus, from other regions of South America 2 or 3 days away, and from Africa up to a week away. An alternative speculation for this data set is that solid organic particles pro-duced by the impact of raindrops on wet soil surfaces could be making a contribution to the rebounded PM analyzed here (Joung and Buie, 2015). Wang et al. (2016) recently reported the detection of airborne soil organic particles generated by this mechanism over agricultural fields in the central plains
Figure 10.Scatter plot of observed compared to predicted rebound deviation for(a)IOP1 and(b)IOP2. Predictions are based on linear combinations of the loadings of the two PMF groups. The linear coefficients used in the prediction were optimized as a function of RH (Table S5). The solid line represents a one-to-one correlation, and the dashed line represents the best linear fit. CoefficientsR2of determination were 0.65 and 0.72 for the IOP1 and IOP2 data sets, respectively. Points are color-coded by relative humidity.
Figure 11.STXM/NEXAFS analysis of particles collected after re-bound from the impaction plate. Samples were collected between 01:00 and 10:00 UTC on 1 October 2014.(a)Carbon K-edge spec-trum of rebounded particles (red). Lines at 285.4 and 288.5 eV highlight absorption by double bonds (C=C) and carboxylic acids (-COOH), respectively. The line in the region of 286.5 to 286.7 eV can have contributions from ketones, carbonyl-substituted aromat-ics, and phenolic species. For comparison, spectra are shown for carbonaceous particles collected in other field and laboratory stud-ies: soil organic particles from the central USA (Wang et al., 2016), soot from the ambient environment, atmospheric particles collected at a background site in central Amazonia (Pöhlker et al., 2012), and three laboratory samples of secondary organic mate-rial. Data sources: isoprene-derived SOM produced under HO2 -dominant conditions (O’Brien et al., 2014); isoprene-derived SOM produced under NO-dominant conditions (O’Brien et al., 2014), and toluene-derived SOM produced under NO-dominant conditions (this study).(b)STXM image from which the NEXAFS spectrum of panel(a)was obtained. Coloring is red for absorption at 285.4 eV (i.e., double bonds). Coloring is green for other types of functional-ities. The pixelation visible in the image corresponds to the STXM spatial resolution during data collection.
trimethylbenzene, and xylenes, by proton-transfer mass spec-trometry (Y. Liu et al., 2016). Rebound deviation correlated positively with the concentrations of these compounds dur-ing both IOPs, and the correlation was stronger durdur-ing the night. Laboratory studies show that the uptake of polycyclic aromatic hydrocarbons during the formation of biogenic PM can increase the viscosity of the PM (Vaden et al., 2011; Ze-lenyuk et al., 2012; Abramson et al., 2013; Liu et al., 2015).
4 Conclusions
Under background conditions, particles composed primarily of highly oxidized biogenic PM were hygroscopic, and they were liquid for the RH values prevailing over Amazonia at surface level. Anthropogenic influences of urban pollution and biomass burning decreased hygroscopicity, and nonliq-uid PM became more favored. The shift in physical state cor-related with increasing concentrations of C=C
functionali-ties and increasing fractional loadings of AMS PMF group B, both of which were indicative of anthropogenic influences. These results demonstrate the importance of anthropogenic influences in altering the physical properties of ambient par-ticulate matter over tropical forests.
5 Data availability
The underlying time series of data is provided as text files in the Supplement.
The Supplement related to this article is available online at doi:10.5194/acp-17-1759-2017-supplement.
Competing interests. The authors declare that they have no conflict of interest.
(FAPESP), the Brazil Scientific Mobility Program (CsF/CAPES), the US National Science Foundation, and the Japanese Ministry of the Environment. The work was conducted under scientific licenses 001030/2012-4 of the Brazilian National Council for Scientific and Technological Development (CNPq).
Edited by: T. Karl
Reviewed by: two anonymous referees
References
Abramson, E., Imre, D., Beranek, J., Wilson, J., and Zelenyuk, A.: Experimental determination of chemical diffusion within sec-ondary organic aerosol particles, Phys. Chem. Chem. Phys., 15, 2983–2991, doi:10.1039/c2cp44013j, 2013.
Adachi, K., Zaizen, Y., Kajino, M., and Igarashi, Y.: Mixing state of regionally transported soot particles and the coating effect on their size and shape at a mountain site in Japan, J. Geophys. Res.-Atmos., 119, 5386–5396, doi:10.1002/2013jd020880, 2014. Agarwal, J. K. and Sem, G. J.: Continuous-flow,
single-particle-counting condensation nucleus counter, J. Aerosol Sci., 11, 343– 357, doi:10.1016/0021-8502(80)90042-7, 1980.
Andreae, M. O. and Rosenfeld, D.: Aerosol-cloud-precipitation interactions. Part 1. The nature and sources of cloud-active aerosols, Earth Sci. Rev., 89, 13–41, doi:10.1016/j.earscirev.2008.03.001, 2008.
Bateman, A. P., Belassein, H., and Martin, S. T.: Impactor ap-paratus for the study of particle rebound: Relative humid-ity and capillary forces, Aerosol Sci. Technol., 48, 42–52, doi:10.1080/02786826.2013.853866, 2014.
Bateman, A. P., Bertram, A. K., and Martin, S. T.: Hygro-scopic influence on the semisolid-to-liquid transition of sec-ondary organic materials, J. Phys. Chem. A, 119, 4386–4395, doi:10.1021/jp508521c, 2015.
Bateman, A. P., Gong, Z., Liu, P., Sato, B., Cirino, G., Zhang, Y., Artaxo, P., Bertram, A. K., Manzi, A. O., Rizzo, L. V., Souza, R. A. F., Zaveri, R. A., and Martin, S. T.: Sub-micrometre partic-ulate matter is primarily in liquid form over Amazon rainforest, Nat. Geosci., 9, 34–37, doi:10.1038/ngeo2599, 2016.
Berkemeier, T., Shiraiwa, M., Pöschl, U., and Koop, T.: Compe-tition between water uptake and ice nucleation by glassy or-ganic aerosol particles, Atmos. Chem. Phys., 14, 12513–12531, doi:10.5194/acp-14-12513-2014, 2014.
Chen, Q., Farmer, D. K., Schneider, J., Zorn, S. R., Heald, C. L., Karl, T. G., Guenther, A., Allan, J. D., Robinson, N., Coe, H., Kimmel, J. R., Pauliquevis, T., Borrmann, S., Pöschl, U., An-dreae, M. O., Artaxo, P., Jimenez, J. L., and Martin, S. T.: Mass spectral characterization of submicron biogenic organic parti-cles in the Amazon basin, Geophys. Res. Lett., 36, L20806, doi:10.1029/2009gl039880, 2009.
Chen, Q., Farmer, D. K., Rizzo, L. V., Pauliquevis, T., Kuwata, M., Karl, T. G., Guenther, A., Allan, J. D., Coe, H., Andreae, M. O., Pöschl, U., Jimenez, J. L., Artaxo, P., and Martin, S. T.: Submi-cron particle mass concentrations and sources in the Amazonian wet season (AMAZE-08), Atmos. Chem. Phys., 15, 3687–3701, doi:10.5194/acp-15-3687-2015, 2015.
DeCarlo, P. F., Kimmel, J. R., Trimborn, A., Northway, M. J., Jayne, J. T., Aiken, A. C., Gonin, M., Fuhrer, K., Horvath, T., Docherty,
K. S., Worsnop, D. R., and Jimenez, J. L.: Field-deployable, high-resolution, time-of-flight aerosol mass spectrometer, Anal. Chem., 78, 8281–8289, doi:10.1021/ac061249n, 2006.
de Sá, S. S., Palm, B. B., Campuzano-Jost, P., Day, D. A., Newburn, M. K., Hu, W., Isaacman-VanWertz, G., Yee, L. D., Thalman, R., Brito, J., Carbone, S., Artaxo, P., Goldstein, A. H., Manzi, A. O., Souza, R. A. F., Mei, F., Shilling, J. E., Springston, S. R., Wang, J., Surratt, J. D., Alexander, M. L., Jimenez, J. L., and Martin, S. T.: Influence of urban pollution on the production of organic particulate matter from isoprene epoxydiols in central Amazo-nia, Atmos. Chem. Phys. Discuss., doi:10.5194/acp-2016-1020, in review, 2016.
Dusek, U., Frank, G. P., Massling, A., Zeromskiene, K., Iinuma, Y., Schmid, O., Helas, G., Hennig, T., Wiedensohler, A., and An-dreae, M. O.: Water uptake by biomass burning aerosol at sub-and supersaturated conditions: closure studies sub-and implications for the role of organics, Atmos. Chem. Phys., 11, 9519–9532, doi:10.5194/acp-11-9519-2011, 2011.
Hallquist, M., Wenger, J. C., Baltensperger, U., Rudich, Y., Simp-son, D., Claeys, M., Dommen, J., Donahue, N. M., George, C., Goldstein, A. H., Hamilton, J. F., Herrmann, H., Hoff-mann, T., Iinuma, Y., Jang, M., Jenkin, M. E., Jimenez, J. L., Kiendler-Scharr, A., Maenhaut, W., McFiggans, G., Mentel, Th. F., Monod, A., Prévôt, A. S. H., Seinfeld, J. H., Surratt, J. D., Szmigielski, R., and Wildt, J.: The formation, properties and im-pact of secondary organic aerosol: current and emerging issues, Atmos. Chem. Phys., 9, 5155–5236, doi:10.5194/acp-9-5155-2009, 2009.
Hersey, S. P., Craven, J. S., Metcalf, A. R., Lin, J., Lathem, T., Suski, K. J., Cahill, J. F., Duong, H. T., Sorooshian, A., Jonsson, H. H., Shiraiwa, M., Zuend, A., Nenes, A., Prather, K. A., Flagan, R. C., and Seinfeld, J. H.: Composition and hygroscopicity of the los angeles aerosol: Calnex, J. Geophys. Res.-Atmos., 118, 3016–3036, doi:10.1002/jgrd.50307, 2013.
Jimenez, J. L., Canagaratna, M. R., Donahue, N. M., Prevot, A. S. H., Zhang, Q., Kroll, J. H., DeCarlo, P. F., Allan, J. D., Coe, H., Ng, N. L., Aiken, A. C., Docherty, K. S., Ulbrich, I. M., Grieshop, A. P., Robinson, A. L., Duplissy, J., Smith, J. D., Wilson, K. R., Lanz, V. A., Hueglin, C., Sun, Y. L., Tian, J., Laaksonen, A., Raatikainen, T., Rautiainen, J., Vaattovaara, P., Ehn, M., Kulmala, M., Tomlinson, J. M., Collins, D. R., Cubi-son, M. J., Dunlea, E. J., Huffman, J. A., Onasch, T. B., Al-farra, M. R., Williams, P. I., Bower, K., Kondo, Y., Schnei-der, J., Drewnick, F., Borrmann, S., Weimer, S., Demerjian, K., Salcedo, D., Cottrell, L., Griffin, R., Takami, A., Miyoshi, T., Hatakeyama, S., Shimono, A., Sun, J. Y., Zhang, Y. M., Dzepina, K., Kimmel, J. R., Sueper, D., Jayne, J. T., Herndon, S. C., Trim-born, A. M., Williams, L. R., Wood, E. C., Middlebrook, A. M., Kolb, C. E., Baltensperger, U., and Worsnop, D. R.: Evolution of organic aerosols in the atmosphere, Science, 326, 1525–1529, doi:10.1126/science.1180353, 2009.
Joung, Y. S. and Buie, C. R.: Aerosol generation by raindrop im-pact on soil, Nat. Commun., 6, 6083, doi:10.1038/ncomms7083, 2015.
Kidd, C., Perraud, V., Wingen, L. M., and Finlayson-Pitts, B. J.: Integrating phase and composition of secondary organic aerosol from the ozonolysis ofα-pinene, P. Natl. Acad. Sci. USA, 111, 7552–7557, doi:10.1073/pnas.1322558111, 2014.
Knopf, D. A., Alpert, P. A., Wang, B., O’Brien, R. E., Kelly, S. T., Laskin, A., Gilles, M. K., and Moffet, R. C.: Microspectroscopic imaging and characterization of individually identified ice nucle-ating particles from a case field study, J. Geophys. Res.-Atmos., 119, 365–381, doi:10.1002/2014jd021866, 2014.
Koop, T., Bookhold, J., Shiraiwa, M., and Pöschl, U.: Glass tran-sition and phase state of organic compounds: Dependency on molecular properties and implications for secondary organic aerosols in the atmosphere, Phys. Chem. Chem. Phys., 13, 19238–19255, doi:10.1039/c1cp22617g, 2011.
Kuwata, M. and Martin, S. T.: Phase of atmospheric secondary or-ganic material affects its reactivity, P. Natl. Acad. Sci. USA, 109, 17354–17359, doi:10.1073/pnas.1209071109, 2012.
Li, Y. J., Liu, P. F., Gong, Z. H., Wang, Y., Bateman, A. P., Bergoend, C., Bertram, A. K., and Martin, S. T.: Chem-ical reactivity and liquid/nonliquid states of secondary or-ganic material, Environ. Sci. Technol., 49, 13264–13274, doi:10.1021/acs.est.5b03392, 2015.
Li, Y. J., Liu, P. F., Bergoend, C., Bateman, A. P., and Martin, S. T.: Rebounding hygroscopic inorganic aerosol particles: Liquids, gels, and hydrates, Aerosol Sci. Tech., doi:10.1080/02786826.2016.1263384, online first, 2016. Liu, P., Li, Y. J., Wang, Y., Gilles, M. K., Zaveri, R. A., Bertram,
A. K., and Martin, S. T.: Lability of secondary organic par-ticulate matter, P. Natl. Acad. Sci. USA, 113, 12643–12648, doi:10.1073/pnas.1603138113, 2016.
Liu, P. F., Abdelmalki, N., Hung, H.-M., Wang, Y., Brune, W. H., and Martin, S. T.: Ultraviolet and visible complex refractive in-dices of secondary organic material produced by photooxidation of the aromatic compounds toluene andm-xylene, Atmos. Chem. Phys., 15, 1435–1446, doi:10.5194/acp-15-1435-2015, 2015. Liu, Y., Brito, J., Dorris, M. R., Rivera-Rios, J. C., Seco, R.,
Bates, K. H., Artaxo, P., Duvoisin, S., Keutsch, F. N., Kim, S., Goldstein, A. H., Guenther, A. B., Manzi, A. O., Souza, R. A. F., Springston, S. R., Watson, T. B., McKinney, K. A., and Martin, S. T.: Isoprene photochemistry over the Ama-zon rainforest, P. Natl. Acad. Sci. USA, 113, 6125–6130, doi:10.1073/pnas.1524136113, 2016.
Martin, S. T., Andreae, M. O., Althausen, D., Artaxo, P., Baars, H., Borrmann, S., Chen, Q., Farmer, D. K., Guenther, A., Gunthe, S. S., Jimenez, J. L., Karl, T., Longo, K., Manzi, A., Müller, T., Pauliquevis, T., Petters, M. D., Prenni, A. J., Pöschl, U., Rizzo, L. V., Schneider, J., Smith, J. N., Swietlicki, E., Tota, J., Wang, J., Wiedensohler, A., and Zorn, S. R.: An overview of the Ama-zonian Aerosol Characterization Experiment 2008 (AMAZE-08), Atmos. Chem. Phys., 10, 11415–11438, doi:10.5194/acp-10-11415-2010, 2010.
Martin, S. T., Artaxo, P., Machado, L. A. T., Manzi, A. O., Souza, R. A. F., Schumacher, C., Wang, J., Andreae, M. O., Barbosa, H. M. J., Fan, J., Fisch, G., Goldstein, A. H., Guenther, A., Jimenez, J. L., Pöschl, U., Silva Dias, M. A., Smith, J. N., and Wendisch, M.: Introduction: Observations and Modeling of the Green Ocean Amazon (GoAmazon2014/5), Atmos. Chem. Phys., 16, 4785– 4797, doi:10.5194/acp-16-4785-2016, 2016.
Massoli, P., Lambe, A. T., Ahern, A. T., Williams, L. R., Ehn, M., Mikkila, J., Canagaratna, M. R., Brune, W. H., Onasch, T. B., Jayne, J. T., Petaja, T., Kulmala, M., Laaksonen, A., Kolb, C. E., Davidovits, P., and Worsnop, D. R.: Relationship between aerosol oxidation level and hygroscopic properties of laboratory generated secondary organic aerosol (SOA) particles, Geophys. Res. Lett., 37, L24801, doi:10.1029/2010gl045258, 2010. Mather, J. H. and Voyles, J. W.: The arm climate research facility: A
review of structure and capabilities, B. Am. Meteorol. Soc., 94, 377–392, doi:10.1175/BAMS-D-11-00218.1, 2013.
Moffet, R. C., Henn, T., Laskin, A., and Gilles, M. K.: Automated chemical analysis of internally mixed aerosol particles using X-ray spectromicroscopy at the carbon K-edge, Anal. Chem., 82, 7906–7914, doi:10.1021/ac1012909, 2010a.
Moffet, R. C., Tivanski, A. V., and Gilles, M. K.: Scanning trans-mission X-ray microscopy, in: Fundamentals and applications in aerosol spectroscopy, CRC Press, Boca Raton, USA, 419–462, 2010b.
Moffet, R. C., Rödel, T. C., Kelly, S. T., Yu, X. Y., Carroll, G. T., Fast, J., Zaveri, R. A., Laskin, A., and Gilles, M. K.: Spectro-microscopic measurements of carbonaceous aerosol ag-ing in Central California, Atmos. Chem. Phys., 13, 10445– 10459, doi:10.5194/acp-13-10445-2013, 2013.
Moteki, N. and Kondo, Y.: Effects of mixing state on black car-bon measurements by laser-induced incandescence, Aerosol Sci. Technol., 41, 398–417, doi:10.1080/02786820701199728, 2007. O’Brien, R. E., Neu, A., Epstein, S. A., MacMillan, A. C., Wang, B. B., Kelly, S. T., Nizkorodov, S. A., Laskin, A., Moffet, R. C., and Gilles, M. K.: Physical properties of ambient and laboratory-generated secondary organic aerosol, Geophys. Res. Lett., 41, 4347–4353, doi:10.1002/2014gl060219, 2014.
Pajunoja, A., Lambe, A. T., Hakala, J., Rastak, N., Cummings, M. J., Brogan, J. F., Hao, L., Paramonov, M., Hong, J., Prisle, N. L., Malila, J., Romakkaniemi, S., Lehtinen, K. E. J., Laak-sonen, A., Kulmala, M., Massoli, P., Onasch, T. B., Donahue, N. M., Riipinen, I., Davidovits, P., Worsnop, D. R., Petäjä, T., and Virtanen, A.: Adsorptive uptake of water by semisolid sec-ondary organic aerosols, Geophys. Res. Lett., 42, 3063–3068, doi:10.1002/2015gl063142, 2015.
Pajunoja, A., Hu, W., Leong, Y. J., Taylor, N. F., Miettinen, P., Palm, B. B., Mikkonen, S., Collins, D. R., Jimenez, J. L., and Virtanen, A.: Phase state of ambient aerosol linked with water uptake and chemical aging in the southeastern US, Atmos. Chem. Phys., 16, 11163–11176, doi:10.5194/acp-16-11163-2016, 2016.
Perraud, V., Bruns, E. A., Ezell, M. J., Johnson, S. N., Yu, Y., Alexander, M. L., Zelenyuk, A., Imre, D., Chang, W. L., Dabdub, D., Pankow, J. F., and Finlayson-Pitts, B. J.: Nonequilibrium atmospheric secondary organic aerosol forma-tion and growth, P. Natl. Acad. Sci. USA, 109, 2836–2841, doi:10.1073/pnas.1119909109, 2012.
Petters, M. D. and Kreidenweis, S. M.: A single parameter repre-sentation of hygroscopic growth and cloud condensation nucleus activity, Atmos. Chem. Phys., 7, 1961–1971, doi:10.5194/acp-7-1961-2007, 2007.
Piens, D. S., Kelly, S. T., Harder, T. H., Petters, M. D., O’Brien, R. E., Wang, B., Teske, K., Dowell, P., Laskin, A., and Gilles, M. K.: Measuring mass-based hygroscopicity of atmospheric particles through in situ imaging, Environ. Sci. Technol., 50, 5172–5180, doi:10.1021/acs.est.6b00793, 2016.
Pöhlker, C., Wiedemann, K. T., Sinha, B., Shiraiwa, M., Gun-the, S. S., Smith, M., Su, H., Artaxo, P., Chen, Q., Cheng, Y. F., Elbert, W., Gilles, M. K., Kilcoyne, A. L. D., Mof-fet, R. C., Weigand, M., Martin, S. T., Pöschl, U., and An-dreae, M. O.: Biogenic potassium salt particles as seeds for sec-ondary organic aerosol in the Amazon, Science, 337, 1075–1078, doi:10.1126/science.1223264, 2012.
Pöschl, U., Martin, S. T., Sinha, B., Chen, Q., Gunthe, S. S., Huffman, J. A., Borrmann, S., Farmer, D. K., Garland, R. M., Helas, G., Jimenez, J. L., King, S. M., Manzi, A., Mikhailov, E., Pauliquevis, T., Petters, M. D., Prenni, A. J., Roldin, P., Rose, D., Schneider, J., Su, H., Zorn, S. R., Artaxo, P., and An-dreae, M. O.: Rainforest aerosols as biogenic nuclei of clouds and precipitation in the Amazon, Science, 329, 1513–1516, doi:10.1126/science.1191056, 2010.
Ramanathan, V., Crutzen, P. J., Kiehl, J. T., and Rosenfeld, D.: At-mosphere – aerosols, climate, and the hydrological cycle, Sci-ence, 294, 2119–2124, doi:10.1126/science.1064034, 2001. Renbaum-Wolff, L., Grayson, J. W., Bateman, A. P., Kuwata, M.,
Sellier, M., Murray, B. J., Shilling, J. E., Martin, S. T., and Bertram, A. K.: Viscosity ofα-pinene secondary organic material and implications for particle growth and reactivity, P. Natl. Acad. Sci. USA, 110, 8014–8019, doi:10.1073/pnas.1219548110, 2013.
Riipinen, I., Pierce, J. R., Yli-Juuti, T., Nieminen, T., Häkkinen, S., Ehn, M., Junninen, H., Lehtipalo, K., Petäjä, T., Slowik, J., Chang, R., Shantz, N. C., Abbatt, J., Leaitch, W. R., Kerminen, V.-M., Worsnop, D. R., Pandis, S. N., Donahue, N. M., and Kul-mala, M.: Organic condensation: a vital link connecting aerosol formation to cloud condensation nuclei (CCN) concentrations, Atmos. Chem. Phys., 11, 3865–3878, doi:10.5194/acp-11-3865-2011, 2011.
Riipinen, I., Yli-Juuti, T., Pierce, J. R., Petaja, T., Worsnop, D. R., Kulmala, M., and Donahue, N. M.: The contribution of organics to atmospheric nanoparticle growth, Nat. Geosci., 5, 453–458, doi:10.1038/ngeo1499, 2012.
Ruehl, C. R., Davies, J. F., and Wilson, K. R.: An interfacial mech-anism for cloud droplet formation on organic aerosols, Science, 351, 1447–1450, doi:10.1126/science.aad4889, 2016.
Saukko, E., Lambe, A. T., Massoli, P., Koop, T., Wright, J. P., Croasdale, D. R., Pedernera, D. A., Onasch, T. B., Laaksonen, A., Davidovits, P., Worsnop, D. R., and Virtanen, A.: Humidity-dependent phase state of SOA particles from biogenic and an-thropogenic precursors, Atmos. Chem. Phys., 12, 7517–7529, doi:10.5194/acp-12-7517-2012, 2012.
Schwarz, J. P., Gao, R. S., Fahey, D. W., Thomson, D. S., Watts, L. A., Wilson, J. C., Reeves, J. M., Darbeheshti, M., Baum-gardner, D. G., Kok, G. L., Chung, S. H., Schulz, M., Hen-dricks, J., Lauer, A., Karcher, B., Slowik, J. G., Rosenlof, K. H., Thompson, T. L., Langford, A. O., Loewenstein, M., and Aikin, K. C.: Single-particle measurements of midlatitude black carbon and light-scattering aerosols from the boundary layer to the lower stratosphere, J. Geophys. Res.-Atmos., 111, D16207, doi:10.1029/2006jd007076, 2006.
Shiraiwa, M. and Seinfeld, J. H.: Equilibration timescale of atmo-spheric secondary organic aerosol partitioning, Geophys. Res. Lett., 39, L24801, doi:10.1029/2012gl054008, 2012.
Song, M., Liu, P. F., Hanna, S. J., Li, Y. J., Martin, S. T., and Bertram, A. K.: Relative humidity-dependent viscosities of isoprene-derived secondary organic material and atmospheric implications for isoprene-dominant forests, Atmos. Chem. Phys., 15, 5145–5159, doi:10.5194/acp-15-5145-2015, 2015.
Thalmann, R., de Sá, S. S., Palm, B. B., Barbosa, H. M. J., Pöhlker, M., Alexander, M. L., Brito, J., Carbone, S., Castillo, P., Day, D. A., Kuang, C., Manzi, A., Ng, N. L., Sedlacek III, A. J., Souza, R., Springston, S., Watson, T., Pöhlker, C., Pöschl, U., Andreae, M. O., Artaxo, P., Jimenez, J. L., Martin, S. T., and Wang, J.: CCN activity and organic hygroscopicity of Amazonian aerosols downwind of an urban region in central Amazonia: Seasonal and diel variations and impact of anthropogenic emissions, in prepa-ration, 2017.
Tivanski, A. V., Hopkins, R. J., Tyliszczak, T., and Gilles, M. K.: Oxygenated interface on biomass burn tar balls determined by single particle scanning transmission X-ray microscopy, J. Phys. Chem. A, 111, 5448–5458, doi:10.1021/jp070155u, 2007. Tsai, C. J., Pui, D. Y. H., and Liu, B. Y. H.: Capture and rebound
of small particles upon impact with solid-surfaces, Aerosol Sci. Technol., 12, 497–507, doi:10.1080/02786829008959364, 1990. Ulbrich, I. M., Canagaratna, M. R., Zhang, Q., Worsnop, D. R., and Jimenez, J. L.: Interpretation of organic components from Posi-tive Matrix Factorization of aerosol mass spectrometric data, At-mos. Chem. Phys., 9, 2891–2918, doi:10.5194/acp-9-2891-2009, 2009.
Vaden, T. D., Imre, D., Beranek, J., Shrivastava, M., and Zelenyuk, A.: Evaporation kinetics and phase of laboratory and ambient secondary organic aerosol, P. Natl. Acad. Sci. USA, 108, 2190– 2195, doi:10.1073/pnas.1013391108, 2011.
Virtanen, A., Joutsensaari, J., Koop, T., Kannosto, J., Yli-Pirila, P., Leskinen, J., Makela, J. M., Holopainen, J. K., Pöschl, U., Kul-mala, M., Worsnop, D. R., and Laaksonen, A.: An amorphous solid state of biogenic secondary organic aerosol particles, Na-ture, 467, 824–827, doi:10.1038/nature09455, 2010.
Wang, B., Harder, T. H., Kelly, S. T., Piens, D. S., China, S., Ko-varik, L., Keiluweit, M., Arey, B. W., Gilles, M. K., and Laskin, A.: Airborne soil organic particles generated by precipitation, Nat. Geosci., 9, 433–437, doi:10.1038/ngeo2705, 2016. Zaveri, R. A., Easter, R. C., Shilling, J. E., and Seinfeld, J. H.:
Modeling kinetic partitioning of secondary organic aerosol and size distribution dynamics: representing effects of volatility, phase state, and particle-phase reaction, Atmos. Chem. Phys., 14, 5153–5181, doi:10.5194/acp-14-5153-2014, 2014.